

Abstract
Given the importance of identifying dementia prodromes for future treatment efforts, we examined two methods of diagnosing mild cognitive impairment (MCI) and determined whether empirically-derived MCI subtypes of these diagnostic methods were consistent with one another as well as with conventional MCI subtypes (i.e., amnestic, non-amnestic, single-domain, multi-domain). Participants were diagnosed with MCI using either conventional Petersen/Winblad criteria (n = 134; >1.5 SDs below normal on one test within a cognitive domain) or comprehensive neuropsychological criteria developed by Jak et al. (2009) (n = 80; >1 SD below normal on two tests within a domain), and the resulting samples were examined via hierarchical cluster and discriminant function analyses. Results showed that neuropsychological profiles varied depending on the criteria used to define MCI. Both criteria revealed an Amnestic subtype, consistent with prodromal Alzheimer’s disease (AD), and a Mixed subtype that may capture individuals in advanced stages of MCI. The comprehensive criteria uniquely yielded Dysexecutive and Visuospatial subtypes, whereas the conventional criteria produced a subtype that performed within normal limits, suggesting its susceptibility to false positive diagnostic errors. Whether these empirically-derived MCI subtypes correspond to dissociable neuropathologic substrates and represent reliable prodromes of dementia will require additional follow-up.
Keywords: Mild cognitive impairment, Amnestic MCI, Non-amnestic MCI, Dementia, Cluster analysis, Neuropsychology
INTRODUCTION
Mild cognitive impairment (MCI) is a useful construct that assists clinicians and researchers in identifying older adults at risk of developing Alzheimer’s disease (AD) or other dementia syndromes. MCI is generally defined as objective impairment on neuropsychological tests, with maintenance of intact global cognitive functioning and activities of daily living (Petersen, 2004). Although MCI is considered a risk factor for AD, many individuals diagnosed with MCI may remain stable, progress to a non-AD dementia such as vascular dementia (VaD) (Mitchell & Shiri-Feshki, 2009), or show improvement on cognitive tests upon follow-up (Loewenstein et al., 2009). These divergent outcomes may be due to the lack of a universal operational definition of MCI and the use of different assessment protocols among clinical and research practices, resulting in widely varying prevalence and progression rates (Ganguli et al., 2011; Jak et al., 2009; Luck, Luppa, Briel, & Riedel-Heller, 2010). For example, a recent review of population-based studies observed a wide range of reported rates for both incidence (21.5–71.3 per 1000 person-years) and prevalence (3–42%) of MCI (Ward, Arrighi, Michels, & Cedarbaum, 2012). This review observed that, although many studies reported using the Petersen criteria to diagnose MCI, the specific operational definitions used often differed.
Several factors involved in the definition of MCI may differ across settings. For instance, the cutoff used to define impairment based on age- and/or education-corrected normative data ranges between 1 and 2 standard deviations below the mean across studies (Bickel, Mosch, Seigerschmidt, Siemen, & Forstl, 2006; Busse, Hensel, Guhne, Angermeyer, & Riedel-Heller, 2006; Delano-Wood et al., 2008, 2009; Eppig et al., 2012; Libon et al., 2010, 2011; Manly et al., 2008). Additionally, specific neuropsychological measures included in the diagnosis can vary widely from a comprehensive neuropsychological battery of many cognitive domains to abbreviated batteries that define selected cognitive domains using only one measure (i.e., recall of a story paragraph to assess memory) or brief global screening instruments (Grundman et al., 2004; Rountree et al., 2007). Furthermore, the number of impaired scores that constitute an MCI diagnosis varies, and many studies require only one measure to fall within the impaired range.
The definition of MCI has evolved to include individuals with primary memory impairments (amnestic MCI) and individuals with non-memory impairments (non-amnestic MCI) (Winblad et al., 2004). These subtypes are further delineated as “single-domain” or “multi-domain,” depending on the number of cognitive domains impaired. These distinctions can provide useful information regarding which individuals are at greatest risk for further cognitive decline. Additionally, more comprehensively defined MCI diagnoses requiring low performances on two tests within a cognitive domain have shown increased reliability and stability of diagnosis (Jak et al., 2009; Loewenstein et al., 2009). For example, Loewenstein and colleagues (2009) reported that, if one test was used to diagnose amnestic MCI, 56% of the individuals improved, 25% remained stable, and 19% declined over a 2- to 3-year period. However, if two impaired scores in a domain were required, none of these individuals showed improvements over the same follow-up period, 50% remained stable, and 50% declined.
MCI is clearly a complex and heterogeneous clinical construct, and the variable nature of current definitions compounds the difficulty in satisfactorily linking the expressed cognitive deficits to specific underlying neural substrates. In addition to improving specificity by assessing a wide range of cognitive abilities, characterizing specific patterns of neuropsychological deficits may provide a clearer, more heuristically meaningful methodology to investigate brain-behavior relationships in MCI. This possibility is especially important since, although distinctions between amnestic and non-amnestic MCI can be useful, some longitudinal studies have noted that both subtypes have approximately equal proportions of “pure” AD pathology, infarcts, or other pathologies at autopsy (Schneider, Arvanitakis, Leurgans, & Bennett, 2009), suggesting that the current nosology of MCI is not successfully characterizing the underlying neuropathologic substrates of “amnestic” and “non-amnestic” cognitive impairment profiles. Providing improved specification (and stability) of neuropsychological impairments in MCI may allow for better prediction of decline and identification of those with neural changes associated with AD versus other dementias such as VaD, dementia with Lewy bodies (DLB), or dementia with mixed pathologies.
Cluster analytic techniques examine how individuals group together based on patterns of performance on a variety of measures. Since this method does not require individuals to conform to predetermined criteria (i.e., amnestic or non-amnestic), it provides an empirical perspective of subtyping within MCI that may identify more homogenous subgroups reflecting common etiology and probable outcomes. Recent studies have begun to examine empirically-derived subtypes of MCI in clinic-based samples (Delano-Wood et al., 2009; Eppig et al., 2012; Libon et al., 2010, 2011) and our study was designed to extend these methods to a community-based sample to examine if similar subtypes emerge in a more generalized setting. Furthermore, we conducted two analyses to investigate how the operational definition of MCI influenced the formation of these clustered MCI subtypes. We examined patterns of performance across memory, language, executive functions, attention, and visuo-spatial skills and used cluster analytic and discriminant function techniques to investigate how MCI subtypes assembled based on a confluence of impaired scores. Based on prior studies, we predicted the emergence of a memory-impaired group, a multi-domain amnestic group, and a dysexecutive group when using conventional MCI definitional criteria, and an alternative pattern via a comprehensive MCI definitional scheme, perhaps with differential impairment within domains (e.g., deficits in memory recall vs. recognition) as well as in additional domains (e.g., attention or visuospatial).
METHODS
Participants
Participants included 197 non-demented older adults participating in a longitudinal study of aging at the University of California, San Diego (UCSD) and the VA San Diego Healthcare System. All participants were independently functioning older adults recruited into the longitudinal study from the San Diego community via newspaper advertisements and flyers placed in senior centers targeting individuals who were either healthy, normally aging older adults or who were at-risk for developing Alzheimer’s disease. We also recruited participants from the UCSD Alzheimer’s Disease Research Center. As is frequently common in community-based studies of normal aging, the vast majority of participants were Caucasian (n = 189). Exclusion criteria for the study included diagnosis of dementia, history of neurological disease, head injury that included a loss of consciousness, psychiatric diagnosis, and substance dependence. The study was approved by the institutional review boards at UCSD and the VA San Diego Healthcare System, and informed consent was obtained from all participants.
Based on a detailed neuropsychological evaluation, 134 older adults were diagnosed with MCI using conventional Petersen/Winblad diagnostic criteria (16 = single-domain amnestic, 74 = single-domain non-amnestic; 29 = multi-domain amnestic, 15 = multi-domain non-amnestic) (Petersen & Morris, 2005; Winblad et al., 2004). These criteria defined MCI by using a cutoff of 1.5 or more standard deviations (SDs) below normative means on at least one measure in the neuropsychological battery. In contrast, 80 participants were diagnosed with MCI using comprehensive diagnostic criteria (14 = single-domain amnestic, 29 = single-domain non-amnestic; 27 = multi-domain amnestic, 10 = multi-domain non-amnestic) requiring low performances (defined as greater than 1 SD below normative means) on at least two measures within a cognitive domain for an individual to be classified as having MCI (Jak et al., 2009). Additionally, both MCI criteria required that performance-based measurement of instrumental activities of daily living remained intact (Independent Living Scales; Loeb, 1996; t scores ≥40). MCI diagnoses were based on performance in five cognitive domains (attention, language, visuospatial function, episodic memory, and executive function) with each domain made up of at least three measures (see Table 1). A sample of 57 participants was classified as cognitively normal based on both criteria and included in the study to develop normative Z-scores for each measure included in the analyses. This normal control group did not differ from either the conventional (n = 134) or the comprehensive (n = 80) MCI groups in age or years of education (all p-values >.13). There were a greater proportion of women in the cognitively normal group (42 W/15 M) than in the conventional MCI (75 W/59 M; p = .02) and comprehensive MCI (44 W/36 M; p = .03) groups.
Table 1.
Neuropsychological measures administered (those in italics were included in cluster analyses and discriminant function analyses)
| Verbal Memorya | CVLT: Trials 1–5 Total, Long-Delay Free Recall, Yes/No Recognition Accuracy WMS-R LM: Delayed Free Recall, Recognition Discriminability |
| Executive Functions | TMT Part B, D-KEFS CWIT – Inhibition/Switching, WCST 48-Card Version (categories, perseverative errors), D-KEFS Design Fluency Switching |
| Language | BNT, Letter Fluency (FAS), Animal Fluency |
| Visuospatial/ Visual Memoryb | WISC-R Block Design, WMS-R VR Immediate Recall, WMS-R Delayed Free Recall, DRS Construction, Clock Drawing |
| Attention | WAIS-R Digit Span Forward (span length), D-KEFS Visual Scanning, DRS Attention, TMT Part A |
Note: CVLT = California Verbal Learning Test (CVLT-I (N = 69), Delis, Kramer, Kaplan, & Ober, 1987 or CVLT-II (N = 127), Delis, Kramer, Kaplan, & Ober, 2000); WMS-R LM and VR = Wechsler Memory Scale Revised Logical Memory and Visual Reproduction subtests (Wechsler, 1987); TMT = Trail Making Test (Reitan & Wolfson, 1985); D-KEFS CWIT = Delis-Kaplan Executive Function System Color-Word Interference Test (Delis, Kaplan, & Kramer, 2001); BNT = Boston Naming Test (Kaplan, Goodglass, & Weintraub, 1983); WISC-R = Wechsler Intelligence Scale for Children Revised (Wechsler, 1974); DRS = Dementia Rating Scale; WAIS-R = Wechsler Adult Intelligence Scale Revised (Wechsler, 1981). Normative data were drawn from Mayo’s Older Americans Normative Studies or from other published norms.
CVLT recognition accuracy (hit rate – false positive rate) was used due to differences in the recognition discriminability index across the two versions of the CVLT.
The longstanding practice of our UCSD ADRC to administer the children’s version of the Block Design test was based on its easier level of difficulty for patients with dementia, thereby improving its range and lowering its floor (Salmon & Butters, 1992). Normative data for this test were calculated from age- and education-adjusted norms drawn from local unpublished data derived from the UCSD ADRC.
Measures
Thirteen neuropsychological measures were included in the cluster analyses (see Table 1). These measures represent common clinical instruments used for assessing the early cognitive manifestations of AD (i.e., episodic memory, semantic knowledge, executive function), but also include domains more typically impaired in early stages of other forms of dementia such as VaD (i.e., executive function, attention, visuospatial abilities). Additionally, depressive symptoms were assessed with the Geriatric Depression Scale (GDS), a commonly used measure of depression in older adults (Yesavage et al., 1983).
Statistical Analyses
To conduct the cluster analyses using scores based on a common metric, raw scores on each of the neuropsychological measures were first transformed to Z-scores based on the means and standard deviations of the normal control group on each measure. Two hierarchical cluster analyses were then conducted using the Z-scores. The first cluster analysis included all subjects diagnosed as MCI using conventional Petersen/Winblad criteria, and the second cluster analysis only included subjects diagnosed as MCI using the comprehensive criteria. Consistent with recent clinical studies of MCI (Delano-Wood et al., 2009), Ward’s method was used to calculate the distance between each cluster (squared Euclidean distance) and merge clusters together that produced the smallest increase in overall distances within clusters. The number of clusters was chosen based on examination of the resulting cluster structure using the dendogram plot. To more quantitatively examine the significance of the cluster solution and assess the particular measures that best separated each cluster, a discriminant function analysis was conducted using the cognitive measures as predictors and the number of clusters as the outcome. Lastly, χ2 analyses were conducted to statistically compare the original MCI subtypes (e.g., amnestic, non-amnestic) and the empirically-derived MCI subtypes.
RESULTS
Cluster Analyses
MCI subtype classification using conventional criteria
A cluster analysis of the 134 participants diagnosed with MCI using the conventional Petersen/Winblad criteria resulted in three distinct groups (see Table 2). We also examined a four cluster solution but, as this resulted in very unbalanced groups (1: n = 39, 2: n = 64, 3: n = 26, 4: n = 5), it was determined that this was not an optimal solution. The first group (n = 39) was considered an Amnestic/Language MCI subgroup based on mildly impaired memory and verbal fluency performances. The second group (n = 31) was identified as a Mixed or multi-domain MCI subgroup based on impaired scores on measures of memory (recall and recognition measures), executive function, language, and visuospatial function. The third subgroup (n = 64) performed within normal limits on all measures included in the cluster analysis.
Table 2.
Demographic and neuropsychological characteristics of mild cognitive impairment (MCI) subtypes resulting from cluster analysis of participants diagnosed via conventional MCI criteria (left) and cluster analysis of participants diagnosed via comprehensive criteria (right)
| Conventional MCI criteria
|
Comprehensive MCI criteria
|
||||||||||
|---|---|---|---|---|---|---|---|---|---|---|---|
| Amnestic/language (n = 39) | Mixed (n = 31) | Cluster derived Normal (n = 64) | F | Sig | Dysexecutive (n = 13) | Amnestic (n = 34) | Mixed (n = 14) | Visuospatial (n = 19) | F | Sig | |
| Demographic characteristics | |||||||||||
| Age | 76.1 (7.4) | 79.4 (7.7) | 73.6 (8.6) | 5.45 | p <.01 | 80.1 (7.1) | 72.6 (8.1) | 80.2 (9.1) | 73.1 (7.7) | 5.06 | p <.01 |
| Education | 16.3 (2.2) | 14.9 (2.6) | 16.5 (2.3) | 5.10 | p <.01 | 14.6 (3.2) | 15.9 (2.4) | 15.4 (2.4) | 16.8 (2.4) | 2.04 | p = .12 |
| Gender (F/M) | 14/25 | 18/13 | 43/21 | χ2 = 9.7 | p <.01 | 9/4 | 12/22 | 7/7 | 16/3 | χ2 = 13.1 | p <.01 |
| Cluster analysis measures | |||||||||||
| Language | |||||||||||
| Boston Naming Test | −0.5 (1.0) | −1.2 (1.5) | 0.0 (0.6) | 12.43 | p <.001 | −0.7 (1.1) | −0.5 (0.8) | −1.8 (1.5) | 0.2 (0.4) | 11.23 | p <.001 |
| Animal Fluency | −1.0 (0.7) | −0.9 (0.9) | −0.1 (0.8) | 13.99 | p <.001 | −1.7 (0.3) | −0.6 (0.7) | −1.4 (0.5) | −0.1 (0.5) | 20.94 | p <.001 |
| Letter Fluency | −1.1 (0.8) | −0.5 (1.3) | 0.0 (1.2) | 11.25 | p <.001 | −1.6 (1.0) | −0.8 (0.9) | −0.5 (1.1) | 0.2 (1.1) | 8.86 | p <.001 |
| Memory | |||||||||||
| CVLT Long-Delay free recall | −1.4 (0.8) | −1.6 (0.9) | 0.2 (0.8) | 60.48 | p <.001 | −0.4 (0.9) | −1.3 (0.7) | −2.2 (0.9) | 0.4 (0.7) | 29.93 | p <.001 |
| CVLT Recognition Accuracy | −1.3 (1.3) | −1.7 (1.6) | 0.2 (0.7) | 33.91 | p <.001 | −0.1 (0.9) | −1.2 (1.1) | −2.7 (1.5) | 0.5 (0.6) | 23.50 | p <.001 |
| LM Delayed Recall | −1.0 (1.0) | −1.8 (0.9) | 0.2 (1.0) | 38.61 | p <.001 | −0.6 (0.9) | −1.4 (1.1) | −2.5 (0.7) | 0.4 (0.9) | 26.70 | p <.001 |
| LM Recognition Accuracy | −0.6 (2.0) | −1.0 (1.1) | 0.3 (0.7) | 8.63 | p <.001 | −0.3 (0.6) | −0.5 (0.9) | −2.4 (2.3) | 0.3 (0.8) | 13.05 | p <.001 |
| Executive Function | |||||||||||
| Trail Making Test Part B | −0.8 (0.9) | −2.4 (2.7) | −0.1 (0.9) | 18.32 | p <.001 | −4.1 (2.8) | −0.5 (0.8) | −2.1 (1.9) | −0.4 (1.1) | 13.12 | p <.001 |
| D-KEFS CWIT I/S | −0.8 (1.5) | −1.6 (2.5) | −0.1 (1.2) | 8.37 | p <.001 | −1.0 (1.9) | −0.6 (1.8) | −2.6 (2.9) | −0.6 (1.3) | 3.26 | p = .03 |
| Attention | |||||||||||
| WAIS Digit Span Forward | −0.1 (1.3) | −0.2 (1.0) | 0.0 (1.3) | 0.50 | p = .60 | −0.8 (1.1) | 0.1 (1.2) | −0.5 (0.9) | 0.1 (1.4) | 3.04 | p = .03 |
| D-KEFS TMT Visual Scan | −0.7 (1.6) | −0.6 (1.0) | −0.1 (0.8) | 1.95 | p = .15 | −1.0 (1.3) | −0.2 (1.3) | −0.3 (0.6) | −0.6 (0.8) | 2.73 | p = .05 |
| Visuospatial/Visual Memory | |||||||||||
| WISC Block Design | −0.3 (0.9) | −2.1 (0.9) | −0.3 (1.3) | 22.32 | p <.001 | −2.0 (1.2) | −0.8 (1.1) | −1.8 (1.1) | −1.0 (1.6) | 1.95 | p = .13 |
| VR Immediate recall | −0.3 (0.9) | −2.0 (1.3) | 0.0 (1.0) | 31.57 | p <.001 | −1.9 (1.8) | −0.6 (1.2) | −1.6 (1.2) | 0.0 (1.3) | 5.52 | p = .002 |
Note: CVLT = California Verbal Learning Test; CVLT recognition accuracy = yes/no hit rate minus yes/no false positive rate; LM = Wechsler Memory Scale-Revised Logical Memory; D-KEFS TMT and CWIT I/S = Delis-Kaplan Executive Function System Trailmaking Test and Color-Word Interference Test Inhibition/Switching; WAIS Digit Span Forward = Wechsler Adult Intelligence Scale-Revised forward span length; WISC = Wechsler Intelligence Scale for Children-Revised; VR = Wechsler Memory Scale-Revised Visual Reproduction
Demographically, the three subgroups differed in terms of age (F(2,131) = 5.45; p <.01) and years of education (F(2,131) = 5.10; p <.01). Post hoc Tukey tests indicated that the Mixed group was significantly older than the Cluster Derived Normal group and had fewer years of education than both the Amnestic/Language and Cluster Derived Normal subgroups. Additionally, the three groups differed in terms of gender composition (χ2(2, N = 134) = 9.70; p <.01), with the Cluster Derived Normal group comprising a greater percentage of women than men. The groups did not differ in self-reported depressive symptoms (F(2,119) = 2.29; p = .11). A multivariate analysis of covariance (MANCOVA) (corrected for age, education, and gender) compared the three clustered groups on the thirteen measures and a Bonferroni correction was used to correct for multiple comparisons (p <.004 considered significant). The MANCOVA revealed that the three groups differed on all measures (p <.001) except those of attention (Digit Span: p = .60; TMT Visual Scanning: p = .15). Figure 1 displays the mean Z-scores of the three groups on each neuropsychological measure.
Fig. 1.

Mean Z-scores for the three mild cognitive impairment (MCI) subtypes (Amnestic/Language, Mixed, Cluster Derived Normal) on neuropsychological measures included in cluster analysis.
MCI subtype classification using comprehensive criteria
A cluster analysis of the 80 participants diagnosed with MCI using the comprehensive criteria resulted in four distinct subgroups (see Table 2). An attempt to cluster the individuals into a three-cluster solution produced less evenly distributed groups (1: n = 13; 2: n = 48; 3: n = 19) than the four cluster solution. The first subgroup classified individuals with impairments on measures of executive function, verbal fluency, attention, and visuospatial abilities (Dysexecutive MCI; n = 13), but with intact memory function. The second subgroup (Amnestic MCI; n = 34) was mildly impaired on delayed recall and one recognition measure, but performed within normal limits on other measures. The third subgroup (Mixed MCI; n = 14) exhibited impaired scores on measures of memory (delayed recall and recognition), executive function, language, and visuospatial function. Intact skills for this subgroup included only Letter Fluency and both measures of attention. Finally, the fourth subgroup (n = 19) was approximately one standard deviation below normative means (Z-score = −1.0) on a single measure of visuospatial function (Block Design).
The four subgroups significantly differed on age (F(3,76) = 5.06; p <.01). Specifically, the Dysexecutive and Mixed subgroups were significantly older than the Amnestic and Visuospatial groups. The subgroups also differed in gender composition (χ2(3, N = 80) = 13.09; p <.01) with the Visuospatial group comprised of a greater percentage of women than men compared to other groups. The groups had similar years of education (F(3,76) = 2.04; p = .12) and did not differ in reported depressive symptoms (F(3,69) = 0.52; p = .67). A MANCOVA that included age and gender as covariates and used Bonferroni correction for multiple comparisons (p <.004) revealed that the subgroups differed (p ≤.002) on all measures except Digit Span (p = .03), TMT Visual Scanning (p = .05), Block Design (p = .13), and CWIT Inhibition/Switching (p = .03). Figure 2 displays the mean Z-scores of the four groups on each neuropsychological measure.
Fig. 2.

Mean Z-scores for the four mild cognitive impairment (MCI) subtypes (Dysexecutive, Amnestic, Mixed, Visuospatial) on neuro-psychological measures included in cluster analysis.
Discriminant Function Analyses
MCI subtype classification using conventional criteria
A direct discriminant function (DF) analysis was performed using the 13 cognitive variables as predictors of membership into the clustered groups (Amnestic/Language MCI, Mixed MCI, and Cluster Derived Normal). Two DFs were found with a combined χ2(26, N = 134) = 242.28, p <.001. The first DF accounted for 82.2% of the variability among the three groups and maximally separated the individuals clustered into Amnestic/Language (M = −0.6), Mixed (M = −2.6), and Cluster Derived Normal (M = 1.7) subgroups. The second DF accounted for 17.8% of the variance among the three clusters and also maximally separated the Amnestic/Language (M = −1.2), Mixed (M = 0.8), and Cluster Derived Normal (M = 0.3) subgroups. Additionally, inclusion of the 13 measures accurately classified 91.8% of the cases into the three groups. Figure 3A depicts each subject on the first and second DFs and illustrates three distinct clusters consistent with a unique neuropsychological pattern for each group.
Fig. 3.
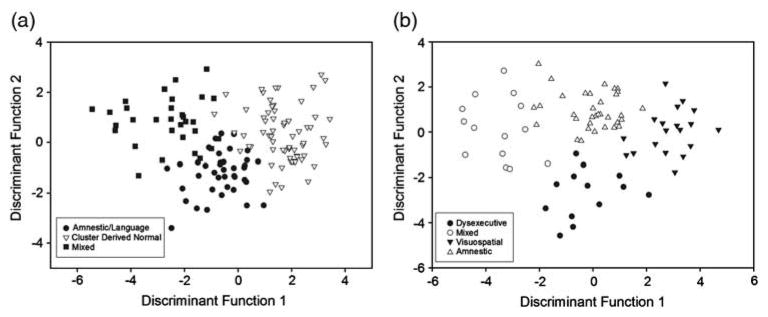
Individual scores on discriminant functions for mild cognitive impairment (MCI) participants classified according to (A) the conventional criteria and (B) the comprehensive criteria.
To further assess the stability of the clusters and better estimate the external validity of the neuropsychological measures to discriminate individuals with MCI into the three clustered subgroups, we submitted the data to a cross-validation procedure using leave-one-out classification (also known as the U-method) in SPSS. This method reduces potential bias that can occur if using the same individuals to develop the classification matrix as were used to compute the discriminant function. Classification for the originally derived cases was 91.8% and fell minimally to 85.8% for the cross-validation cases. As an additional step to confirm the stability of the clusters, we conducted a separate cluster analysis after removing two of the memory variables. This step ensured that cognitive domains were equally represented and reduced the presence of more highly correlated variables in the analysis. These analyses resulted in an essentially identical cluster structure to that produced by the inclusion of all 13 cognitive variables (for more details of this analysis see Supplemental Tables 1 and 2).
MCI subtype classification using comprehensive criteria
A direct DF analysis using the 13 cognitive variables as predictors of membership into the clustered MCI subgroups (Dysexecutive, Amnestic, Mixed, and Visuospatial) resulted in three DFs with a combined χ2(39, N = 80) = 228.83, p <.001. The first DF accounted for 63.9% of the between-group variability and maximally separated both the Dysexecutive (M = −0.3) and Amnestic (M = 0.0) from the Mixed (M = −3.53) and Visuospatial (M = 2.86) subgroups. The second DF accounted for 24.5% of the variance and maximally separated the Dysexecutive subgroup (M = −2.71) from the Amnestic (M = 1.0), Mixed (M = 0.2), and Visuospatial (M = 0.1) subgroups. Lastly, the third DF (11.7% variance) separated a combination of the Dysexecutive (M = 0.6) and Amnestic (M = 0.8) subgroups from both of the Mixed (M = −1.1) and Visuospatial (M = −1.0) subgroups. Additionally, inclusion of the 13 measures accurately classified 97.5% of the cases into the four clusters. Figure 3B depicts each participant on the first and second DFs illustrating four distinct clusters consistent with a unique cognitive pattern of results for each group. After submission of the data to a cross-validation procedure using leave-one-out classification, classification accuracy fell from 97.5% to 85% for the cross-validation cases, which remains well above the percentage expected by chance.
Association between empirically-derived clusters and traditional MCI diagnoses
To investigate how the empirically-derived subtypes compared to the typical diagnostic subtyping approach, we examined the frequency of traditional MCI subtype diagnoses (i.e., single- and multi-domain amnestic and non-amnestic) across each clustered subgroup (see Table 3 for details). Chi-square analyses revealed that the three clusters derived via the conventional Petersen/Winblad criteria significantly differed in frequency from the traditional MCI diagnoses (χ2(6, N = 134) = 35.08; p <.001). Closer inspection of the clusters formed based on comprehensive criteria revealed that the four subtypes also significantly differed in their frequency from the traditional MCI subtype diagnoses (χ2(9, N = 80) = 23.32; p = .006). Overall, the clusters derived via the comprehensive criteria were more consistent with traditional MCI subtype diagnoses (e.g., 49% had equivalent subtype diagnoses across empirical and traditional methods) than the clusters produced using the conventional criteria (21% had equivalent traditional and empirically-derived subtype diagnoses).
Table 3.
Number of participants in each empirically-derived cluster diagnosed with amnestic and non-amnestic mild cognitive impairment (MCI)
| Empirically-derived MCI subtypes | Traditional MCI diagnoses
|
Convergent n | Total n | |||
|---|---|---|---|---|---|---|
| Single-domain amnestic | Multi-domain amnestic | Single-domain non-amnestic | Multi-domain non-amnestic | |||
| Conventional criteria | ||||||
| Amnestic/Language | 7 | 8 | 19 | 5 | 8 | 39 |
| Mixed | 5 | 16 | 6 | 4 | 20 | 31 |
| Cluster Derived Normal | 4 | 5 | 49 | 6 | 0 | 64 |
| Total | 28 | 134 | ||||
| Comprehensive criteria | ||||||
| Dysexecutive | 0 | 5 | 5 | 3 | 8 | 13 |
| Amnestic | 9 | 10 | 12 | 3 | 9 | 34 |
| Mixed | 4 | 9 | 0 | 1 | 10 | 14 |
| Visuospatial | 1 | 3 | 12 | 3 | 12 | 19 |
| Total | 39 | 80 | ||||
Note. Convergent n = rnumber of participants with equivalent diagnoses across both the empirically-derived method and the traditional MCI diagnostic method
Post hoc Analyses of the “Cluster Derived Normal” subgroup
To further inspect the Cluster Derived Normal subgroup resulting from the cluster analysis using the conventional MCI criteria, we conducted post hoc t test analyses comparing the Cluster Derived Normal MCI subgroup and the normal control group (initially used to create the standardized scores) on demographic and neuropsychological raw scores. Results indicated that the normal control group (N = 57) did not differ significantly from the Cluster Derived Normal MCI subgroup (N = 64) on any of the neuropsychological variables included in the cluster analysis (all p’s >.14) or on age, education, or gender (all p’s >.12). As a comparison, we conducted separate t-tests between the normal control group and the Visuospatial subgroup that resulted from the cluster analysis based on the comprehensive MCI criteria. Results from this comparison indicated that the Visuospatial subgroup performed significantly worse than the normal control group on several measures including CVLT recognition (p = .01), block design (p = .03), and visual scanning (p = .03).
An additional DFA was conducted on the raw scores to examine how the neuropsychological measures discriminated between the three subgroups (Amnestic/Language, Mixed, Cluster Derived Normal) and the normal control group (see Figure 4). Results indicated that inclusion of the normal control group (N = 57) in the DFA produced two significant DFs that accounted for 80.5% and 18.6% of the between-group variability. The largest DF maximally separated the Mixed subgroup (M = −2.8) from the Amnestic subgroup (M = −0.9). However, it did not separate the normal control group (M = 0.9) from the Cluster Derived Normal MCI subgroup (M = 1.0). Additionally, the DFA correctly classified 92% and 87% of the Amnestic/Language and Mixed groups, respectively, whereas it correctly classified only 44% and 58% of the normal control and Cluster Derived Normal groups, respectively.
Fig. 4.

Individual scores on discriminant functions for normal control participants and MCI participants classified according to the conventional criteria (group centroids = filled shapes).
Finally, preliminary analyses of a subset of participants in the Cluster Derived Normal subgroup (n = 44) on whom we obtained MRI scans demonstrated that they did not differ from the normal control group (n = 36) on medial temporal or posteromedial cortical thickness or regional volumes (all p-values >.12), whereas the other two subgroups exhibited expected cortical thinning in temporal (Amnestic [n = 21]; p <.05) and posteromedial (Amnestic: p = .06; Mixed [n = 17]; p <.05) regions, as well as a trend toward decreased left hippocampal volume (Mixed subgroup only: p = .07) relative to the normal control group.
DISCUSSION
Many previous studies of MCI have focused on the amnestic subtype in an attempt to identify those at highest risk for AD. However, a dichotomous “amnestic” or “non-amnestic” scheme that summarily combines all individuals with non-memory deficits (e.g., language, visuospatial, attention, executive function) may obscure groups with important patterns of impairment and, therefore, not adequately capture the heterogeneity of MCI. Additionally, other studies have shown that amnestic and non-amnestic subtypes are differentially associated with non-cognitive factors such as gender, education, apolipoprotein E (APOE) genotype, and hypertension, suggesting these subtypes may represent different syndromes (Roberts et al., 2012).
The purpose of our study was to identify empirically-derived MCI subgroups based on patterns of neuropsychological deficits in language, memory (recall and recognition), executive function, attention, and visuospatial domains, and to determine if these subgroups varied depending on the classification scheme used to define MCI. Cluster analyses revealed that different subgroups were formed depending on the MCI definition used. Specifically, three subgroups emerged when using conventional Petersen/Winblad criteria (one measure at least 1.5 SDs below normative means). Two of the subgroups were identified as Amnestic/Language (mildly impaired performances on delayed recall, recognition, and verbal fluency measures) and Mixed (impaired scores on delayed recall and recognition, executive function, language, and visuospatial measures). Unexpectedly, the largest subgroup performed within normal limits on all measures included in the cluster analysis. As the cluster analysis is a descriptive approach, discriminant function analyses (DFAs) were conducted to quantitatively determine the ability of the neuropsychological measures to discriminate the clustered subgroups. These measures demonstrated a 92% ability to correctly classify individuals into the Amnestic/Language, Mixed, and Cluster Derived Normal subgroups.
It was somewhat surprising that, although every participant included in the conventional MCI sample was diagnosed with MCI based on exhibiting at least one low score (<1.5 SDs below normative means), the cluster analysis resulted in one subgroup of individuals who on average performed within normal limits. The presence of this subgroup suggests that many individuals initially diagnosed with MCI based on the conventional criteria did not cluster together based on a consistent pattern of deficits, but rather clustered together based on a consistent pattern of scores that were within normal limits. Comparison of the empirically-derived subgroups with the traditional “amnestic” versus “non-amnestic” subtype scheme revealed that over 75% of individuals in this normal subgroup were diagnosed with single-domain non-amnestic MCI. Single-domain subtypes have been shown to revert to normal diagnoses at higher rates than multi-domain subtypes (Summers & Saunders, 2012), and the single-domain non-amnestic subtype tends to demonstrate the poorest reliability and stability, with more than 50% likely to revert to normal cognitive status at follow-up (Ganguli et al., 2011). Additionally, post hoc results indicated that the normal control group and the Cluster Derived Normal subgroup were quite similar in terms of neuropsychological performances. Furthermore, preliminary analyses comparing cortical thickness maps between the Cluster Derived Normal subgroup and the normal control participants revealed no distinctions in critical brain structures, whereas expected cortical thinning was observed for the Amnestic and Mixed MCI subgroups. This constellation of follow-up t tests, DFAs, and preliminary neuroimaging analyses demonstrated that the Cluster Derived Normal subgroup was comparable to the normal control participants, and lends support to the notion that the conventional criteria may be susceptible to false positive diagnostic errors. As many neurologically normal individuals are likely to demonstrate isolated impairment related to normal variation in performance (Binder, Iverson, & Brooks, 2009; Palmer, Boone, Lesser, & Wohl, 1998; Schretlen, Testa, Winicki, Pearlson, & Gordon, 2008), requiring at least two impaired measures within a domain may assist in avoiding potential false positive diagnostic errors while improving specificity in identifying those at greater risk for cognitive decline.
In contrast, the cluster analysis based on comprehensive MCI criteria (two measures at least 1 SD below normative means) produced four neuropsychologically distinct clusters. Similar to previous analyses, one cluster was characterized as Amnestic due to impairments on measures of delayed recall and one measure of recognition, and another was characterized as Mixed given lower performances on measures of delayed recall and recognition, language, executive function, and visuospatial functioning. The Amnestic subgroup is consistent with the commonly used subtype of single-domain amnestic MCI. Interestingly, this subgroup was composed of individuals diagnosed with both amnestic and non-amnestic subtypes using traditional diagnostic schemes (see Table 3), suggesting that some individuals classified as non-amnestic MCI have mild memory deficits that are not captured via traditional diagnoses. The Mixed subgroup demonstrated neuropsychological deficits consistent with what is frequently evidenced in early AD (e.g., deficits in episodic memory, executive functioning, and semantic knowledge; Salmon and Bondi, 2009), suggesting that this group may capture individuals in more advanced stages of MCI. Another possibility is that the Mixed subgroup, which was older than the Amnestic and Visuospatial subgroups, may have more mixed pathologies, consistent with studies of the very old reporting greater vascular and AD pathologies than in the young old (Jellinger & Attems, 2010; Savva et al., 2009; Sinka et al., 2010).
Moreover, two unique subgroups emerged from the cluster analysis based on the comprehensive criteria: a Dysexecutive subgroup characterized by impaired attention, executive functioning (including verbal fluency), and visuospatial functions, but intact memory performance, as well as a Visuospatial subgroup characterized by lower performances on one measure of visuoconstruction (Block Design). This analysis did not result in a cluster-derived normal subgroup, and the DFA confirmed that the neuropsychological measures significantly discriminated the four subgroups and accurately classified 98% of the sample. As prior studies have reported that vascular risk factors and cerebrovascular changes on MRI are associated with deficits in executive, attentional, and visuospatial functions, but not memory (Geerlings et al., 2009; Lo, Jagust, & Alzheimer’s Disease Neuroimaging Initiative, 2012; Reijmer et al., 2012), the presence of a Dysexecutive subgroup demonstrating significant impairment in these cognitive domains may be consistent with a prodrome of VaD rather than AD—particularly given the absence of significant memory deficits combined with their older ages. This is an important MCI subtype to identify as mounting evidence suggests that preventive measures may be taken to treat vascular risk factors that exacerbate cognitive deficits (Gorelick et al., 2011).
The Visuospatial subgroup could potentially represent an emerging non-AD dementia prodrome that initially presents with visuoconstructional impairment, such as in DLB (Calderon et al., 2001; Collerton, Burn, McKeith, & O’Brien, 2003; McKeith et al., 2005). The formation of this subgroup (derived from the comprehensive criteria) suggests that there may be single-domain non-amnestic MCI patients with circumscribed but significant cognitive impairment that are clinically important to identify and distinguish from the large portion of individuals classified as single-domain non-amnestic MCI (derived from the conventional criteria) that ultimately are normal. However, there may be other causes for common impairment in an older adult sample solely on a Block Design measure, including slowed processing speed, difficulties with fine motor dexterity related to arthritis, or perceptual difficulties related to vision problems. Unlike the other subgroups, this group clustered together based on common impairment on only one measure and, therefore, may be less stable or predictive of further cognitive decline. Longitudinal exams that continue to follow this subgroup along with clinical correlation to other DLB-related phenomena such as mild extrapyramidal symptoms, fluctuating cognition, visual hallucinations, and disordered sleep behavior, will be helpful in determining its ultimate significance.
Prior studies of empirically-derived MCI subtypes have consistently reported three distinct clusters. For example, Delano-Wood et al. (2009) identified an Amnestic group with very mild memory deficits, a Dysexecutive group with deficits in executive functioning, processing speed, and visuospatial abilities, and a Mixed group with memory and language impairments. Similarly, Libon and colleagues (2010) conducted cluster analyses resulting in an Amnestic subgroup with significant impairment on memory measures, a Dysexecutive subgroup impaired on executive control and verbal fluency measures, and a Mixed subgroup with impairments on memory (recall and recognition) and verbal fluency tasks. Two subgroups that emerged in both of our cluster analyses (Amnestic and Mixed) exhibit similar neuropsychological profiles to these previous studies, and our Dysexecutive subgroup derived from the comprehensive criteria was also consistent with previous findings. Of interest, Delano-Wood and colleagues (2009) observed significantly greater levels of white matter burden on neuroimaging in their Dysexecutive subgroup, consistent with hypotheses of a cerebrovascular etiology underlying this pattern of deficits. Our slightly different pattern of subgroups compared to these previous studies (e.g., presence of a visuospatial group) may relate to the inclusion of a greater number of measures in our analysis. For example, some previous studies using cluster analytic methods did not include visuospatial and visual memory measures (Libon et al., 2010). Although we attempted to comprehensively examine several cognitive domains, a different pattern may have resulted had we sampled fewer or different domains since the cluster analysis is dependent on the breadth of domains sampled. Future studies that attempt to replicate our findings using different neuropsychological measures will be interesting and important to further validate these MCI subtypes.
Importantly, both previous studies used samples of MCI patients from memory clinic settings and our study has extended these findings to a community-based sample. The consistent findings of three subtypes across studies (e.g., memory impaired group, multi-domain amnestic group, dys-executive group) suggest that these may be particularly important characterizations of MCI that are more likely to generalize across settings. The community-based setting of our study may have contributed to the formation of a Cluster Derived Normal subgroup among those conventionally diagnosed with MCI. In our sample, approximately two-thirds of the individuals diagnosed with MCI reported subjective memory impairment. However, approximately half of those classified as cognitively normal also reported subjective memory impairment. Although subjective memory complaints are often present in a clinical context (e.g., prompts patients to seek an evaluation), recent evidence suggests that using subjective memory complaints as a criterion for the diagnosis of MCI does not necessarily improve the accuracy of the diagnosis and, instead, can contribute to higher numbers of false positive and false negative diagnoses (Lenehan, Klekociuk, and Summers, 2012). Furthermore, some evidence suggests that subjective cognitive complaints often relate more strongly to psychological factors, such as depression, than to objective cognitive impairment (Bartley et al., 2012; Chung & Man, 2009; Harwood, Barker, Ownby, Mullan, & Duara, 2004; Slavin et al., 2010). However, it is important to note that a clinical diagnosis of MCI requires information indicating decline from a previous level of functioning. Although identifying optimal measures and cut-points to determine severity of impairment and possible prognosis is important, these should be considered within the context of an individual’s likely baseline level of functioning.
Finally, several limitations should be considered. This was a cross-sectional study and, therefore, we were unable to distinguish specific prodromes or determine the number of individuals that progress to dementia diagnoses. However, many participants in the current study continue to receive longitudinal assessments and we plan to examine prognostic rates of the MCI subgroups in future work. Additionally, the current study examined cognitive profiles that exist within MCI based on a comprehensive neuropsychological battery, but did not include information regarding biomarkers (e.g., tau or Aβ) that would likely enhance our understanding of the potential etiologic distinctions underlying the cognitive subtypes. Future efforts will include both neuropsychological and neuroimaging data to validate the current findings and further elucidate underlying differences in neuropathology. Additionally, future studies that include both participants with MCI and cognitively normal older adults (beyond those used to generate Z-scores) in cluster analyses may be able to more specifically identify those individuals with MCI that are actual false positives (e.g., those individuals that cluster with cognitively normal adults). Finally, this sample was comprised primarily of Caucasian and relatively well-educated older adults from the San Diego community. Future studies that examine MCI subgroups in more demographically diverse populations are needed to expand the generalizabilty of our findings. Also, our strategy to recruit participants from the community for a study of normal aging and AD risk may have somewhat biased our sample toward individuals who are aware of, or concerned about, AD. Despite these limitations, we believe the current results add important information regarding MCI subtypes and the utility of using a comprehensive neuropsychological definition of MCI particularly in identifying specific non-amnestic MCI subgroups. We hope that improved characterization of these subtypes of mild cognitive impairment will assist clinicians and researchers in better distinguishing those at high risk for AD and non-AD dementias from those more likely to remain mildly impaired or revert to cognitively normal status over time.
Supplementary Material
Acknowledgments
This work was supported by Alzheimer’s Association grant IIRG 07-59343 (M.B.) and National Institute on Aging grants R01 AG012674 (M.B.) and K24 AG026431 (M.B.). No financial or other conflicts of interest exist pertaining to this manuscript. The authors gratefully acknowledge the assistance of Sarah Jurick and Elisa Lanni, as well as the staff, patients, and volunteers of the UCSD ADRC.
Footnotes
For supplementary material referred to in this article, please visit http://dx.doi.org/10.1017/S1355617713000313
References
- Bartley M, Bokde AL, Ewers M, Faluyi YO, Tobin WO, Snow A, O’Neill D. Subjective memory complaints in community dwelling health older people: The influence of brain and psychopathology. International Journal of Geriatric Psychiatry. 2012;27:836–843. doi: 10.1002/gps.2794. [DOI] [PubMed] [Google Scholar]
- Bickel H, Mosch E, Seigerschmidt E, Siemen M, Forstl H. Prevalence and persistence of mild cognitive impairment among elderly patients in general hospitals. Dementia and Geriatric Cognitive Disorders. 2006;21(4):242–250. doi: 10.1159/000091397. [DOI] [PubMed] [Google Scholar]
- Binder LM, Iverson GL, Brooks BL. To err is human: “Abnormal” neuropsychological scores and variability are common in healthy adults. Archives of Clinical Neuropsychology. 2009;24:31–46. doi: 10.1093/arclin/acn001. [DOI] [PubMed] [Google Scholar]
- Busse A, Hensel A, Guhne U, Angermeyer MC, Riedel-Heller SG. Mild cognitive impairment: Long-term course of four clinical subtypes. Neurology. 2006;67:2176–2185. doi: 10.1212/01.wnl.0000249117.23318.e1. [DOI] [PubMed] [Google Scholar]
- Calderon J, Perry RJ, Erzinclioglu SW, Berrios GE, Dening TR, Hodges JR. Perception, attention, and working memory are disproportionately impaired in dementia with Lewy bodies compared with Alzheimer’s disease. Journal of Neurology, Neurosurgery, and Psychiatry. 2001;70:157–164. doi: 10.1136/jnnp.70.2.157. [DOI] [PMC free article] [PubMed] [Google Scholar]
- Chung JC, Man DW. Self-appraised, informant-reported, and objective memory and cognitive function in mild cognitive impairment. Dementia and Geriatric Cognitive Disorders. 2009;27:187–193. doi: 10.1159/000200467. [DOI] [PubMed] [Google Scholar]
- Collerton D, Burn D, McKeith I, O’Brien J. Systematic review and meta-analysis show that dementia with Lewy bodies is a visual-perceptual and attentional-executive dementia. Dementia & Geriatric Cognitive Disorders. 2003;16:229–237. doi: 10.1159/000072807. [DOI] [PubMed] [Google Scholar]
- Delano-Wood L, Abeles N, Sacco JM, Wierenga CE, Horne NR, Bozoki A. Regional white matter pathology in mild cognitive impairment – Differential influence of lesion type on neuropsychological functioning. Stroke. 2008;39:794–799. doi: 10.1161/STROKEAHA.107.502534. [DOI] [PubMed] [Google Scholar]
- Delano-Wood L, Bondi MW, Sacco J, Abeles N, Jak AJ, Libon DJ, Bozoki A. Heterogeneity in mild cognitive impairment: Differences in neuropsychological profile and associated white matter lesion pathology. Journal of the International Neuropsychological Society. 2009;15:906–914. doi: 10.1017/S1355617709990257. [DOI] [PMC free article] [PubMed] [Google Scholar]
- Delis DC, Kramer JH, Kaplan E, Ober BA. The California Verbal Learning Test. San Antonio, TX: The Psychological Corporation; 1987. [Google Scholar]
- Delis DC, Kramer JH, Kaplan E, Ober BA. California Verbal Learning Test: Second Edition. San Antonio, TX: The Psychological Corporation; 2000. [Google Scholar]
- Delis DC, Kaplan E, Kramer JH. Delis-Kaplan Executive Function System. San Antonio, TX: The Psychological Corporation; 2001. [Google Scholar]
- Eppig J, Wambach DM, Nieves C, Price CC, Lamar M, Delano-Wood L, Libon DJ. Dysexecutive functioning in mild cognitive impairment: Derailment in temporal gradients. Journal of the International Neuropsychological Society. 2012;18:20–28. doi: 10.1017/S1355617711001238. [DOI] [PMC free article] [PubMed] [Google Scholar]
- Ganguli M, Snitz BE, Saxton JA, Chang CCH, Lee CW, Vander Bilt J, Petersen RC. Outcomes of mild cognitive impairment by definition: A population study. Archives of Neurology. 2011;68:761–767. doi: 10.1001/archneurol.2011.101. [DOI] [PMC free article] [PubMed] [Google Scholar]
- Geerlings MI, Appelman AP, Vincken KL, Mali WP, van der Graaf Y, SMART Study Group Association of white matter lesions and lacunar infarcts with executive functioning: The SMART-MR study. American Journal of Epidemiology. 2009;170(9):1147–1155. doi: 10.1093/aje/kwp256. [DOI] [PubMed] [Google Scholar]
- Gorelick PB, Scuteri A, Black SE, DeCarli C, Greenberg SM, Iadecola C, Seshadri S. Vascular contributions to cognitive impairment and dementia: A statement for healthcare professionals from the American Heart Association/American Stroke Association. Stroke. 2011;42:2672–2713. doi: 10.1161/STR.0b013e3182299496. [DOI] [PMC free article] [PubMed] [Google Scholar]
- Grundman M, Petersen RC, Ferris SH, Thomas RG, Aisen PS, Bennett DA, Thal LJ. Mild cognitive impairment can be distinguished from Alzheimer disease and normal aging for clinical trials. Archives of Neurology. 2004;61:59–66. doi: 10.1001/archneur.61.1.59. [DOI] [PubMed] [Google Scholar]
- Harwood DG, Barker WW, Ownby RL, Mullan M, Duara R. No association between subjective memory complaints and apolipoprotein E genotype in cognitively intact elderly. International Journal of Geriatric Psychiatry. 2004;19:1131–1139. doi: 10.1002/gps.1193. [DOI] [PubMed] [Google Scholar]
- Jak AJ, Bondi MW, Delano-Wood L, Wierenga C, Corey-Bloom J, Salmon DP, Delis DC. Quantification of five neuropsychological approaches to defining mild cognitive impairment. American Journal of Geriatric Psychiatry. 2009;17(5):368–375. doi: 10.1097/JGP.0b013e31819431d5. [DOI] [PMC free article] [PubMed] [Google Scholar]
- Jellinger KA, Attems J. Prevalence of dementia disorders in the oldest-old: An autopsy study. Acta Neuropathologica. 2010;119:421–433. doi: 10.1007/s00401-010-0654-5. [DOI] [PubMed] [Google Scholar]
- Kaplan EF, Goodglass H, Weintraub S. The Boston Naming Test. Philadelphia: Lea & Febiger; 1983. [Google Scholar]
- Lenehan ME, Klekociuk SZ, Summers MJ. Absence of a relationship between subjective memory complaint and objective memory impairment in mild cognitive impairment (MCI): Is it time to abandon subjective memory complaint as an MCI diagnostic criterion? International Psychogeriatrics. 2012;24:1505–1514. doi: 10.1017/S1041610212000695. [DOI] [PubMed] [Google Scholar]
- Libon DJ, Bondi MW, Price CC, Lamar M, Eppig J, Wambach DM, Penney DL. Verbal serial list learning in mild cognitive impairment: A profile analysis of interference, forgetting, and errors. Journal of the International Neuropsychological Society. 2011;17:905–914. doi: 10.1017/S1355617711000944. [DOI] [PMC free article] [PubMed] [Google Scholar]
- Libon DJ, Xie SX, Eppig J, Wicas G, Lamar M, Lippa C, Wambach DM. The heterogeneity of mild cognitive impairment: A neuropsychological analysis. Journal of the International Neuropsychological Society. 2010;16:84–93. doi: 10.1017/S1355617709990993. [DOI] [PubMed] [Google Scholar]
- Lo RY, Jagust WJ, Alzheimer’s Disease Neuroimaging Initiative Vascular burden and Alzheimer disease pathologic progression. Neurology. 2012;79(13):1349–1355. doi: 10.1212/WNL.0b013e31826c1b9d. [DOI] [PMC free article] [PubMed] [Google Scholar]
- Loeb PA. Independent living scales. San Antonio, TX: The Psychological Corporation; 1996. [Google Scholar]
- Loewenstein DA, Acevedo A, Small BJ, Agron J, Crocco E, Duara R. Stability of different subtypes of mild cognitive impairment among the elderly over a 2- to 3- year follow-up period. Dementia and Geriatric Cognitive Disorders. 2009;27:418–423. doi: 10.1159/000211803. [DOI] [PMC free article] [PubMed] [Google Scholar]
- Luck T, Luppa M, Briel S, Riedel-Heller SG. Incidence of mild cognitive impairment: A systematic review. Dementia & Geriatric Cognitive Disorders. 2010;29:164–175. doi: 10.1159/000272424. [DOI] [PubMed] [Google Scholar]
- Manly JJ, Tang MX, Schupf N, Stern Y, Vonsattel JP, Mayeux R. Frequency and course of mild cognitive impairment in a multiethnic community. Annals of Neurology. 2008;63:494–506. doi: 10.1002/ana.21326. [DOI] [PMC free article] [PubMed] [Google Scholar]
- McKeith IG, Dickson DW, Lowe J, Ernre M, O’Brien JT, Feldman H. Consortium on DLB. Diagnosis and management of dementia with Lewy bodies: Third report of the DLB Consortium. Neurology. 65:1863–1872. doi: 10.1212/01.wnl.0000187889.17253.b1. [DOI] [PubMed] [Google Scholar]
- Mitchell AJ, Shiri-Feshki M. Rate of progression of mild cognitive impairment to dementia – meta-analysis of 41 robust inception cohort studies. Acta Psychiatrica Scandinavica. 2009;119:252–265. doi: 10.1111/j.1600-0447.2008.01326.x. [DOI] [PubMed] [Google Scholar]
- Palmer BW, Boone KB, Lesser IM, Wohl MA. Base rates of “impaired” neuropsychological test performance among healthy older adults. Archives of Clinical Neuropsychology. 1998;13:503–511. [PubMed] [Google Scholar]
- Petersen RC. Mild cognitive impairment as a diagnostic entity. Journal of Internal Medicine. 2004;256:183–194. doi: 10.1111/j.1365-2796.2004.01388.x. [DOI] [PubMed] [Google Scholar]
- Petersen RC, Morris JC. Mild cognitive impairment as a clinical entity and treatment target. Archives of Neurology. 2005;62:1160–1163. doi: 10.1001/archneur.62.7.1160. [DOI] [PubMed] [Google Scholar]
- Reijmer YD, van den Berg E, Dekker JM, Niipels G, Stehouwer CD, Kappelle LJ, Biessels GJ. Development of vascular risk factors over 15 years in relation to cognition: The Hoorn Study. Journal of the American Geriatric Society. 2012;60(8):1426–1433. doi: 10.1111/j.1532-5415.2012.04081.x. [DOI] [PubMed] [Google Scholar]
- Reitan RM, Wolfson D. The Halstead-Reitan Neuropsychological Test Battery. Tucson, AZ: Neuropsychology Press; 1985. [Google Scholar]
- Roberts RO, Geda YE, Knopman DS, Cha RH, Pankratz VS, Boeve BF, Petersen RC. The incidence of MCI differs by subtype and is higher in men: The Mayo Clinic Study of Aging. Neurology. 2012;78:342–351. doi: 10.1212/WNL.0b013e3182452862. [DOI] [PMC free article] [PubMed] [Google Scholar]
- Rountree SD, Waring SC, Chan WC, Lupo PJ, Darby EJ, Doody RS. Importance of subtle amnestic and non-amnestic deficits in mild cognitive impairments: Prognosis and conversion to dementia. Dementia & Geriatric Cognitive Disorders. 2007;24:476–482. doi: 10.1159/000110800. [DOI] [PubMed] [Google Scholar]
- Salmon DP, Bondi MW. Neuropsychological assessment of dementia. Annual Review of Psychology. 2009;60:257–282. doi: 10.1146/annurev.psych.57.102904.190024. [DOI] [PMC free article] [PubMed] [Google Scholar]
- Salmon DP, Butters NM. Neuropsychologic assessment of dementia in the elderly. In: Katzman R, Rowe JW, editors. Principles of geriatric neurology. Philadelphia: F.A. Davis Company; 1992. pp. 144–163. [Google Scholar]
- Savva GM, Wharton SB, Ince PG, Forster G, Matthews FE, Brayne C. Age, neuropathology, and dementia. New England Journal of Medicine. 2009;360:2302–2309. doi: 10.1056/NEJMoa0806142. [DOI] [PubMed] [Google Scholar]
- Schneider JA, Arvanitakis Z, Leurgans SE, Bennett DA. The neuropathology of probable Alzheimer disease and mild cognitive impairment. Annals of Neurology. 2009;66:200–208. doi: 10.1002/ana.21706. [DOI] [PMC free article] [PubMed] [Google Scholar]
- Schretlen DJ, Testa SM, Winicki JM, Pearlson GD, Gordon B. Frequency and bases of abnormal performance by healthy adults on neuropsychological testing. Journal of the International Neuropsychological Society. 2008;14:436–445. doi: 10.1017/S1355617708080387. [DOI] [PubMed] [Google Scholar]
- Sinka L, Kovari E, Gold G, Hof PR, Herrmann FR, Bouras C, Giannakopoulos P. Small vascular and Alzheimer disease-related pathologic determinants of dementia in the oldest-old. Journal of Neuropathology and Experimental Neurology. 2010;69:1247–1255. doi: 10.1097/NEN.0b013e3181ffc3b9. [DOI] [PubMed] [Google Scholar]
- Slavin MJ, Brodaty H, Kochan NA, Crawford JD, Trollor JN, Draper B, Sachdev PS. Prevalence and predictors of “subjective cognitive complaints” in the Sydney Memory and Ageing Study. American Journal of Geriatric Psychiatry. 2010;18:701–710. doi: 10.1097/jgp.0b013e3181df49fb. [DOI] [PubMed] [Google Scholar]
- Summers MJ, Saunders NL. Neuropsychological measures predict decline to Alzheimer’s dementia from mild cognitive impairment. Neuropsychology. 2012;26:498–508. doi: 10.1037/a0028576. [DOI] [PubMed] [Google Scholar]
- Ward A, Arrighi HM, Michels S, Cedarbaum JM. Mild cognitive impairment: Disparity of incidence and prevalence estimates. Alzheimer’s & Dementia. 2012;8:14–21. doi: 10.1016/j.jalz.2011.01.002. [DOI] [PubMed] [Google Scholar]
- Wechsler D. Wechsler Intelligence Scale for Children-Revised. New York: The Psychological Corporation; 1974. [Google Scholar]
- Wechsler D. Wechsler Adult Intelligence Scale-Revised Manual. San Antonio, TX: The Psychological Corporation; 1981. [Google Scholar]
- Wechsler D. Wechsler Memory Scale-Revised. New York: The Psychological Corporation; 1987. [Google Scholar]
- Winblad B, Palmer K, Kivipelto M, Jelic V, Fratiglioni L, Wahlund LO, Petersen RC. Mild cognitive impairment – beyond controversies, towards a consensus: Report of the International Working Group on Mild Cognitive Impairment. Journal of Internal Medicine. 2004;256:240–246. doi: 10.1111/j.1365-2796.2004.01380.x. [DOI] [PubMed] [Google Scholar]
- Yesavage JA, Brink TL, Rose TL, Lum O, Huang V, Adey MB, Leirer VO. Development and validation of a geriatric depression screening scale: A preliminary report. Journal of Psychiatric Research. 1983;17:37–49. doi: 10.1016/0022-3956(82)90033-4. [DOI] [PubMed] [Google Scholar]
Associated Data
This section collects any data citations, data availability statements, or supplementary materials included in this article.