

Abstract
Enhancement of proton leaks in muscle tissue represents a potential target for obesity treatment. In this study, we examined the bioenergetic and physiological implications of increased proton leak in skeletal muscle. To induce muscle-specific increases in proton leak, we used mice that selectively express uncoupling protein-1 (UCP1) in skeletal muscle tissue. UCP1 expression in muscle mitochondria was ∼13% of levels in brown adipose tissue (BAT) mitochondria and caused increased GDP-sensitive proton leak. This was associated with an increase in whole body energy expenditure and a decrease in white adipose tissue content. Muscle UCP1 activity had divergent effects on mitochondrial ROS emission and glutathione levels compared with BAT. UCP1 in muscle increased total mitochondrial glutathione levels ∼7.6 fold. Intriguingly, unlike in BAT mitochondria, leak through UCP1 in muscle controlled mitochondrial ROS emission. Inhibition of UCP1 with GDP in muscle mitochondria increased ROS emission ∼2.8-fold relative to WT muscle mitochondria. GDP had no impact on ROS emission from BAT mitochondria from either genotype. Collectively, these findings indicate that selective induction of UCP1-mediated proton leak in muscle can increase whole body energy expenditure and decrease adiposity. Moreover, ectopic UCP1 expression in skeletal muscle can control mitochondrial ROS emission, while it apparently plays no such role in its endogenous tissue, brown fat.
Keywords: UCP1, reactive oxygen species, proton leak, glutathione, redox, obesity
the etiology of obesity involves the complex interplay between genetic and environmental factors, and currently is at the forefront of human health issues. In 2010, obesity surpassed smoking as the leading contributor to the overall disease burden in the United States and is now a major factor in deaths associated with preventable disease (22, 49). Concomitant metabolic disorders include type 2 diabetes mellitus (T2DM), metabolic syndrome, liver steatosis, and chronic inflammation (35). The most common treatments include a hypocaloric diet, increased physical activity, a very limited repertoire of medications, and bariatric surgery. The long-term success rate for current treatments is low, pointing to the need for the development of alternative treatment strategies (16, 50). In recent years, brown adipose tissue (BAT) has emerged as a promising target for novel therapeutics. The primary function of BAT is to convert energy stored in adipose triacylglycerols into heat for the purpose of thermoregulation. BAT thermogenesis can also be activated by excessive caloric intake, which has been referred to as diet-induced thermogenesis (43).
Recent studies have unequivocally identified BAT in adult humans, and its abundance is inversely correlated with BMI and age (10, 18, 46, 47, 51). BAT thermogenesis is dependent on uncoupling protein-1 (UCP1) (11, 40, 41). UCP1, found in the mitochondrial inner membrane, uncouples the oxidation of fuels, mainly fatty acids, from the production of ATP, and the energy associated with fuel oxidation is simply released as heat. Estimates indicate that the activation of thermogenesis in BAT in adult humans may contribute to 15–20% toward whole body energy expenditure (46a, 49). Hence, UCP1 activation could serve as a potential therapeutic approach for the treatment of obesity.
Other uncoupling proteins, namely UCP2 and UCP3, which share ∼58% homology with UCP1, have been identified and characterized in other tissues. UCP3 is expressed in skeletal muscle and BAT, whereas UCP2 is more ubiquitously expressed (e.g., stomach, spleen, pancreas, brain, and immune cells) (41). Both UCP2 and UCP3 are expressed at levels that are estimated to be at two orders of magnitude lower than that of UCP1 in BAT (1, 41). Unlike UCP1, UCP2 and UCP3 do not have thermogenic functions but use inducible leak mechanisms to control mitochondrial reactive oxygen species (ROS) emission and signaling. Small increases in membrane potential induce a rise in mitochondrial ROS emission, which in turn is thought to activate proton leak through UCP2 and UCP3 (2, 3, 26, 31, 38, 45). Previous studies have also shown that UCP1 can control mitochondrial ROS emission (24, 36). However, recent observations have found that activation of UCP1 by either cold exposure or long-chain fatty acids actually increases mitochondrial ROS emission (30, 44). These findings are consistent with divergent physiological functions of UCPs.
Transgenic induction of proton leak in muscle of mice due to an approximately twofold increase in UCP3 expression enhances fat oxidation in muscle and moderately mitigates obesity (6, 7). Moreover, increased muscle mitochondrial uncoupling and UCP3 mRNA correlate with rapid weight loss in human obesity (15, 19). Ectopic expression of UCP1 in skeletal muscle of mice decreases circulating insulin, glucose, and cholesterol and decreases adiposity. These changes are associated with increased energy expenditure (9, 28). In addition, UCP1 expression in muscle protects mice from high-fat diet-induced obesity and promotes a fast-to-slow fiber type switch (glycolytic to oxidative) (9). However, the role of UCP1 in regulating ROS production through redox changes at the mitochondrial level remains a subject of debate. Thus, the induction of slight increases in mitochondrial uncoupling in muscle has been hypothesized to serve as a potential means to treat obesity and regulate ROS production (4, 8).
Using a mouse model that selectively expresses UCP1 in muscle [driven by the muscle creatine kinase (MCK) promoter, hereafter referred to as transgenic (Tg)], we tested whether increased proton leak in muscle mitochondria could mitigate oxidative stress through ROS control while decreasing adiposity through increased energy expenditure. Here, we demonstrate that the expression of UCP1 in skeletal muscle mitochondria at levels ∼13% of that in BAT mitochondria increased mitochondrial proton leak. This was associated with an increase in whole body energy expenditure and a decrease in adiposity. Most important is the finding in Tg skeletal muscle that GDP-mediated inhibition of leak through UCP1 elevated ROS production. In contrast, GDP had no effect on ROS emission in BAT mitochondria of wild-type (WT) or Tg mice. The latter indicates the importance of metabolic context provided by unique, but as yet poorly understood, tissue-specific differences between BAT and skeletal muscle.
MATERIALS AND METHODS
Mice.
Tg mice were previously developed using cDNA coding RAT UCP1 under the control of a muscle-specific creatine kinase promoter, inserted into single cell embryos of B6D2F1 mouse strains, and have since been back-crossed into the C57Bl/6J mouse line at least eight times (9). Mice were ad libitum fed a standard chow diet (44.2% carbohydrate, 6.2% fat, and 18.6% crude protein; T.2018-Harlan). Some groups of mice were cold exposed (4°C) without housing materials but given free access to water and food. All experiments were approved by the Animal Care Committee at the University of Ottawa in accordance with the guidelines of the Canadian Council of Animal Care and were conducted on male mice aged 7–12 wk. All mice were genotyped prior to experimentation.
Whole body, tissue, and organ weights.
Whole body, tissue, and organ weights were collected from ad libitum-fed Tg and WT littermates. BAT, skeletal muscle, white adipose tissue (gonadal), liver, kidney, and heart were all extracted, blotted, and weighed. Mice were not fasted prior to measurements.
Food intake.
Daily food intake and body weight changes were determined over a 1-mo period with individually housed mice starting at 4 wk of age. Measurements were taken twice weekly. Mice were ad libitum-fed the standard chow diet (as above).
Indirect calorimetry.
Mice were individually housed in a four-chamber Oxymax open-circuit indirect calorimeter (Columbus Instruments, Columbus, OH). Mice were provided with water and their standard diet, and chambers were supplied with air at 0.5 l/min and maintained at room temperature (22–23°C) with the normal light-dark cycle (light 0600–1800, dark 1800–0600). Concentrations of O2 and CO2 were measured in each chamber for 60 s every 4 min with a sample line purge time of 2 min, as previously described (12). Data collection began after a 2-h acclimatization period. Following initial measurements of 24 h at room temperature the ambient temperature was decreased to 4°C, and measurements continued for another 24 h. Measurements began 1 h after the temperature decreased.
In vivo assessments of glucose metabolism using positron emission tomography.
Imaging was performed using an Inveon small animal scanner (Siemens, Knoxville, TN). Mice were weighed, and blood glucose concentration was determined using an ACCU-CHEK Advantage glucometer (Roche, Laval, QC, Canada) and a drop of saphenous vein blood. Briefly, glucose concentration was determined prior to in vivo glucose uptake measurements using fluoro-2-deoxy-[18F]glucose ([18F]FDG). Then mice were anesthetized with 1.5–2.5% isoflurane and injected intravenously with ∼ 1 mCi [18F]FDG in a 100-μl volume, and underwent an 80-min dynamic scan (constant rate of infusion 1.66 μl/min). An adrenergic stimulant, norepinephrine (NE) (1 mg/kg body wt) was administrated intraperitoneally 20 min after start of the 80-min scanning protocol, and the rate of [18F]FDG uptake was measured. Following conclusion of the 80-min scan, blood glucose concentration was again measured as described above. Data analysis was performed using the Inveon Research Workplace software to determine the standardized uptake values (SUVs), defined as tissue FDG activity concentration/injected activity × body weight (g/ml), based on regions of interest (ROI) drawn semiautomatically around the hindlimb muscles, interscapular BAT, and heart.
Immunoblotting.
Protein was diluted to in Laemmli buffer and electrophoresed on a one-dimensional denaturing 8% or 12% gel under reducing conditions. Electrophoresed proteins were transferred at 100 V for 1 h at room temperature. Membranes were then blocked with Tris-buffered saline containing 1% (vol/vol) Tween-20 (TBS-T) and 5% (wt/vol) nonfat powdered skim milk and then probed with primary anti-UCP1 antibody (1/5,000; Sigma, St. Louis, MO), or anti-MHC I and II antibodies (1/5,000 and 1/1,000, Abcam, Cambridge, MA). SDH (1/4,000, Santa Cruz Biotechnology, Santa Cruz, CA) and α-tubulin (1/5,000, Abcam) served as the loading control. Next, membranes were then washed and probed with secondary antibodies (horseradish peroxidase conjugated, 1/2,000) for 1 h at room temperature. Membranes were then exposed to an enhanced chemiluminescent substrate for visualization (ECL Kit; Thermo Scientific, Waltham, MA) (30, 37).
Mitochondrial isolation.
All steps were performed on ice or at 4°C. Mitochondria were isolated from interscapular BAT and skeletal muscle as described (14, 30). Briefly, hindlimb, and forelimb muscles were excised and immediately placed in ice-cold basic medium (BM) [140 mM KCl, 20 mM HEPES, 5 mM MgCl2, 1 mM EGTA, 10 mM pyruvate, and 2 mM malate (pH 7.0)]. Muscle was then cleaned of connective tissue and fat, blotted dry, weighed, and then minced on Teflon plates. The muscle was then placed in homogenization medium (BM + 1 mM ATP, 1 U subtilisin A, and 1% BSA, wt/vol) and homogenized using the Potter-Elvehjem method. Muscle homogenate was then spun at 800 g to pellet debris and connective tissues, followed by a 9,500-g spin at 4°C for 9 min. Subsequently, the pellet was resuspended in 1 ml of BM and allowed to sit on ice for 5 min to induce myofibril repolymerization. The volume was topped up to 30 ml with BM and the suspension was centrifuged at 800 g for 9 min at 4°C to remove myofibers. The supernatant was collected and centrifuged at 9,500 g for 9 min at 4°C to pellet mitochondria. Protein content was determined by a Bradford assay.
Following extraction, BAT was cleaned of white fat and connective tissue, minced on Teflon plates, and homogenized in a 250 mM sucrose buffer containing 0.2% (wt/vol) BSA using the Potter-Elvehjem method. The homogenate was spun at 8,500 g for 9 min at 4°C. The pellet was resuspended in ice-cold buffer (250 mM sucrose and 0.2% wt/vol BSA) and spun at 800 g for 9 min at 4°C to remove debris and nuclei. The supernatant was kept and centrifuged at 8,500 g for 9 min at 4°C to yield a mitochondrial pellet. The pellet was resuspended in ice-cold reaction buffer containing 125 mM sucrose, 20 mM Tris base, 2 mM MgCl2, 4 mM KH2PO4, and 1 mM EDTA (pH 7.2). Protein content was determined using a Bradford assay.
Bioenergetic determinations of isolated mitochondria.
The energetics of mitochondria isolated from BAT and skeletal muscle were tested using a Seahorse XF24 Analyzer (Seahorse Biosciences, North Billerica, MA) as previously described (34, 42). Mitochondria from BAT and skeletal muscle were diluted to 0.05 and 0.2 mg/ml and then plated in quintuplicates in a 24-well XF24 assay plate. Mitochondria were attached to the plate surface by centrifugation in a swing bucket rotor at 2000 g for 20 min at 4°C. No more than 50 μl of mitochondrial sample was loaded into the individual wells. Reaction medium [70 mM sucrose, 220 mM mannitol, 2 mM HEPES, 1 mM EGTA, 10 mM pyruvate, 2 mM malate, 0.2% BSA, 10 mM KH2PO4 (pH 7.2)] was then added to a final volume of 400 μl, and mitochondria were incubated for 10 min at 37°C prior to analysis.
To investigate UCP1-mediated uncoupling, mitochondria were sequentially treated with oligomycin, GDP, and antimycin A (Ant A). Following the measurement of state 4 respiration (10 mM pyruvate and 2 mM malate without added adenylates), oligomycin (final concentration of 2.5 μg/ml) was added to induce state 4o (nonphosphorylating, proton leak-dependent) respiration. GDP was then titrated to a final concentration of 0.2 mM or 1 mM to inhibit UCP1-dependent respiration following previous titrations to determine the optimal concentration for maximal inhibition. Finally, Ant A (final concentration of 4 μM) was added to assess any O2 consumption not associated with the respiratory chain. We also measured coupled respiration in isolated mitochondria. Following the measurement of state 4 O2 consumption, mitochondria were treated with ADP (final concentration of 0.1 mM was determined by previous titrations to be sufficient) to measure state 3 respiration. Mitochondria were then treated with oligomycin to induce state 4o, followed by carbonylcyanide-p-trifluoromethoxyphenylhydrazone (FCCP; final concentration of 8 μM) and then by Ant A (final concentration of 4 μM). All respiration values were corrected for background respiration using Seahorse XF24 software and O2 consumption not associated with aerobic respiration (O2 consumed after addition of maximal Ant A). Data were expressed as fold changes relative to state 4 respiration rates.
Mitochondrial ROS emission.
Mitochondria isolated from BAT and skeletal muscle were tested for ROS emission using the fluorometric probe 2,7-dichlorodihydrofluorescein-diacetate (H2-DCFDA; Invitrogen, Burlington, ON, Canada). Mitochondrial preparations were diluted to 0.5 mg/ml in reaction buffer (20 mM Tris base, 125 mM sucrose, 2 mM MgCl2, 4 mM KH2PO4, 1 mM EDTA) containing 20 μM H2-DCFDA and warmed to 37°C for ∼5 min, and then baseline ROS measurements were taken. The sequential treatment of mitochondria with substrate (5 mM pyruvate, 3 mM malate), oligomycin (1.3 μg/ml), and GDP (1 mM) was employed and ROS levels were measured. The rate of ROS genesis was measured by fluorescent changes in H2-DCFDA over a period of ∼5 min using the BioTEK Synergy MX microplate reader (BioTek, Winooski, VT) and Gen5 software (Biotek). Data were normalized to background fluorescence and mitochondrial protein. Results were expressed as fold change from the substrate only condition.
Total glutathione measurements.
Total mitochondrial glutathione (GSH + GSSG) was measured using high-performance liquid chromatography (Agilent, Mississauga, ON, Canada) (32). Briefly, isolated mitochondria from BAT or skeletal muscle were diluted to 0.5 mg/ml in 0.1% perchloric acid solution and incubated on ice for 10 min. Precipitate was then removed by centrifugation, and the supernatant was collected and injected into the HPLC. GSH and GSSG were separated in an Agilent Binary Pump 1100 series HPLC system equipped with a Pursuit C18 column (150 × 4.6 mm, 5 μm; Agilent Technologies, Santa Clara, CA) and operating at a flow rate of 1 ml/min. The mobile phase consisted of 0.1% (vol/vol) trifluoroacetic acid diluted in ddH2O: HPLC-grade methanol (90:10). GSH and GSSG were detected at 215 nm. Retention times of GSH and GSSG were determined by injecting known standards. Samples were quantified using Agilent ChemStation software.
Measurement of protein carbonyls.
To determine whether muscle-specific expression of UCP1 induced oxidative damage, we measured the total amount of protein carbonyl adducts in gastrocnemius muscle using the Oxyblot assay kit (Millipore, Billerica, MA). Muscle was placed in ice-cold homogenization (HM) buffer containing 20 mM Tris·HCl (pH 7.4), 1% Triton X-100, 50 mM NaCl, 250 mM sucrose, 50 mM NaF, 5 mM sodium pyrophosphate, 2% β-mercaptoethanol, 4 mg/l leupeptin, 50 mg/l trypsin inhibitor, and 0.1 mM benzamidine. The muscle was homogenized on ice for a minimum of 20 passes using the Tissue Tearor (BioSpec, Bartlesville, OK). The sample was then centrifuged at 14,000 g for 20 min at 4°C. The supernatant was kept and the pellet discarded. A Bradford assay was conducted using standards that included 2 μl of HM buffer to correct for background reactions. Protein carbonyls were measured according to the kit manufacturer's instructions.
Statistics.
Statistical analyses involved Student's t-tests or two-way ANOVAs with Fischer post hoc tests using Excel software (Microsoft, Redmond, WA) and Statsview 5.0 software (SAS Institute, Cary, NC), respectively. Data are presented as means ± SE.
RESULTS
Ectopic expression of UCP1 in skeletal muscle decreases adiposity and increases metabolic rate.
Immunoblot analysis for UCP1 in mitochondrial preparations confirmed the presence of UCP1 in muscle of Tg mice (Fig. 1A). Quantification of band densities revealed that levels of UCP1 were ∼13% of those in BAT mitochondria. Expression of UCP1 in muscle decreased body weight by ∼29% (Fig. 1B). Analysis of tissue weights showed ∼51% and 62% decreases in gonadal white adipose tissue (gWAT) and skeletal muscle (hindlimbs and forelimbs), respectively, of Tg compared with WT mice (Fig. 1, C and D). Despite the decrease in skeletal muscle weight, no differences in fiber type were detected (Fig. 1E). Tg mice also showed an ∼46% decrease in BAT weight (Fig. 1F). Linear body size was decreased in Tg vs. WT mice (Fig. 1G). Thus, expression of UCP1 in muscle, even at levels much lower than that found in BAT, had effects on body size and composition.
Fig. 1.

UCP1 expression in muscle and effects on body composition. A: mRNA and protein measurement of UCP1. B: body weight. C: gonadal white adipose tissue (gWAT) weight. D: skeletal muscle (pooled limbs) weight. E: assessment of gastrocnemius muscle fiber type composition. MHC I and II band intensities were quantified using Image J software and normalized to α-tubulin loading control; n = 4, means ± SE, Student's t-test. F: interscapular brown adipose tissue (BAT) weight. G: body length (cm). WT, wild-type; Tg, transgenic muscle creatine kinase (MCK)-UCP1; n = 9, means ± SE, Student's t-test. n.s., not significant.
Next, we examined the impact of muscle-specific UCP1 expression on whole body energetics. Tg mice showed an ∼24% increase in food intake compared with WT mice (Fig. 2A). Whole body energy expenditure was also increased. O2 consumption rates were 30 and 26% higher in Tg mice in the light and dark cycles, respectively, compared with WT mice, even after values were normalized to lean muscle mass (Fig. 2B). We also tested O2 consumption in WT and Tg mice exposed to cold (4°C) for 24 h, since UCP1 overexpression was associated with decreased amounts of interscapular BAT (IBAT). As expected, cold exposure elevated whole body O2 consumption in both WT and Tg mice (Fig. 2C). However, O2 consumption remained significantly higher in the Tg mice than in WT mice. Thus, ectopic UCP1 expression in muscle does not compromise cold-induced thermogenesis. We also calculated the respiratory exchange ratio (RER) to determine if there were any alterations in the oxidation of fat vs. carbohydrates during the light and dark phases. RER values were similar between WT and Tg mice in the light phase (Fig. 3A). However, during the dark phase, Tg mice displayed a higher RER, indicating increased relative use of carbohydrates (vs. fats) when mice are typically awake and feeding. These differences in RER were abolished in mice exposed to cold (Fig. 3B). Thus, our results indicate that UCP1 expression in skeletal muscle 1) increases whole body energy expenditure, 2) does not compromise cold-induced BAT thermogenesis, and 3) increases carbohydrate oxidation (vs. fats) in the nocturnal phase of the day.
Fig. 2.

Ectopic UCP1 expression increases energy expenditure without compromising acute adaptation to cold. A: daily food intake (g·day−1·g body wt−1) over a period of 4 wk; n = 4, means ± SE, Student's t-test. B: measurement of whole body energetics in WT and Tg mice housed at room temperature (22–23°C). V̇o2 (ml·kg−1·h−1) was measured by indirect calorimetry. V̇o2 was calculated for both light and dark cycles and was normalized to lean muscle mass. C: V̇o2 (ml·kg−1·h−1) of WT and Tg mice exposed to cold (4°C) for 24 h. Experiment and data analysis were conducted as described in B; n = 9, means ± SE, Student's t-test.
Fig. 3.

UCP1 expression in muscle increases oxidation of carbohydrates vs. fat in Tg mice in the dark phase. Respiratory exchange ratio (RER) results were determined for WT and Tg mice housed at room temperature (22–23°C; A) or exposed to cold (4°C; B) for 24 h. RER values were calculated for both light and dark phases; n = 9, means ± SE, Student's t-test.
Ectopic UCP1 expression in muscle increases glucose metabolism.
Given our indirect calorimetry findings, we next measured in vivo muscle glucose uptake to determine whether uncoupling of oxidative phosphorylation by UCP1 in muscle led to an increased reliance on glucose in this tissue. Glucose clearance from the blood was measured in real-time using [18F]FDG radiotracer and microPET imaging. Basal glucose uptake rate was measured dynamically for 20 min followed by an injection with the adrenergic agonist norepinephine (NE). Prior to the injection, glucose uptake rates in skeletal muscle, heart, and IBAT were assessed. There were no significant differences in the rates of glucose uptake between IBAT and heart tissues prior to NE treatment (Fig. 4A). However, muscle in Tg mice displayed a significantly higher rate of glucose uptake pre-NE treatment. We also calculated the rate of glucose uptake in muscle, heart, and IBAT after injection of NE. Following NE injection, the rate of uptake into all tissues, skeletal muscle, IBAT, and heart were slightly decreased for both WT and Tg mice (Fig. 4B). This effect could simply have been due to the saturation of GLUT4 transport activity in response to increased glycogenolysis. However, Tg muscle cleared more glucose than WT muscle after NE treatment (Fig. 4B). As in the baseline results of Fig. 4A, it is important to point out that there was no change in blood glucose levels between WT and Tg mice before and after NE treatment (Fig. 4C). As expected, though, NE elevated circulating glucose levels in both WT and Tg mice. Representative images of both WT and Tg mice are shown (Fig. 4D).
Fig. 4.

UCP1 expression in muscle increases the rate of glucose uptake. WT and Tg mice were anesthetized and injected with [18F]FDG tracer at a constant rate of infusion (1.66 μl·MBq−1·min−1) and imaged using PET for 80 min. At 20 min following injection of [18F]FDG, mice were injected with norepinephine (NE) at a dose of 1 mg/kg body wt. Pre-NE, values before NE treatment; post-NE, values after NE treatment. Mean standardized uptake values (SUV) = [18F]FDG uptake/injected activity × body weight (g/ml) as determined from regions of interest in hindlimb and forelimb muscle of Tg and WT mice. Rate of glucose uptake was measured post-NE injection. Rate of glucose uptake was determined pre-NE (A) and post-NE (B) in muscle, IBAT, and heart. C: blood glucose levels were measured pre- and postinjection of NE. Statistical analysis was done using two-way ANOVA with Fischer post hoc test; n = 5. D: coronal [18F]FDG PET images collected from WT and Tg mice; n = 5, means ± SE, Student's t-test.
Mitochondrial bioenergetics.
We then tested the energetics of mitochondria from muscle and BAT and focused on UCP1-mediated proton leak. Mitochondria from muscle and BAT of WT and Tg mice were analyzed simultaneously in quintuplicate per biological replicate. As shown in Fig. 5A, proton leak in skeletal muscle mitochondria from Tg mice displayed high sensitivity toward GDP inhibition compared with mitochondria from WT mice. Indeed, a significant decrease in proton leak was observed following an acute incubation (3 min) in 0.1 mM GDP. No further decreases in proton leak were observed following addition of more GDP (bringing the total concentration up to 0.2 mM). Importantly, exposure to 0.1 mM GDP lowered leak by up to ∼80%, suggesting that UCP1 accounts for a large proportion of proton leak when ectopically expressed in muscle (Fig. 5A). We also tested proton leaks through UCP1 in BAT mitochondria and found that preparations from WT and Tg mice displayed similar sensitivities to GDP inhibition (progressive decrease in leak from 0.5 to 1 mM GDP addition) (Fig. 5A). Thus, UCP1 expression in muscle does not compromise BAT mitochondrial uncoupling. We also tested the responsiveness of skeletal muscle mitochondria from WT and Tg mice to ADP stimulation. Expression of UCP1 in muscle mitochondria did not affect the response of muscle mitochondria to ADP, indicating that UCP1 expression does not compromise coupled respiration in this tissue (Fig. 5B).
Fig. 5.

UCP1 induces proton leak in muscle mitochondria without compromising ADP-stimulated oxidative phosphorylation. Bioenergetics of isolated mitochondria from skeletal muscle and BAT of WT and Tg mice were tested using the Seahorse XF24 Analyzer, as described in materials and methods. A: measurement of GDP-sensitive proton leak in muscle and BAT mitochondrial preparations from WT and Tg mice. Following measurement of state 2 respiration (10 mM pyruvate and 2 mM malate only), mitochondria were treated with oligomycin followed by GDP titration (0.1–0.2 mM for muscle and 0.5–1 mM for BAT mitochondria). B: assessment of oxidative phosphorylation. Following measurement of state 2 respiration, mitochondria were treated sequentially with ADP (0.1 mM; state 3), oligomycin (2.5 μg/ml; state 4 O), FCCP (8 μM), and antimycin A (4 μM); n = 3, means ± SE. V̇o2 rates were normalized to fold change relative to state 2 respiration rates. Two-way ANOVA with Fischer post-hoc test: *P ≤ 0.05, **P ≤ 0.01 for treatments vs. state 2; #P ≤ 0.01 for between genotypes.
Impact of ectopic UCP1 expression on mitochondrial redox state.
Recently, we showed that, relative to muscle mitochondria, BAT mitochondria have a far more oxidizing redox environment, and these differences were associated with UCP1 activation in BAT (30). Hence, we next determined whether expression of UCP1 in muscle alters mitochondrial ROS emission and redox. Treatment of muscle mitochondrial preparations from Tg mice with GDP led to a significant increase in the rate of ROS emission (Fig. 6A). This effect was absent in muscle mitochondrial preparations from WT mice. On the other hand, GDP treatment did not elevate the rate of ROS production from BAT mitochondria (Fig. 6A). Ectopic expression of UCP1 in muscle also affected mitochondrial total glutathione levels. Indeed, expression of UCP1 induced a dramatic ∼7.6-fold increase in total glutathione levels (Fig. 6B). No changes in total mitochondrial glutathione levels were observed in BAT between WT and Tg mice, indicating again that UCP1 expression in muscle does not perturb BAT physiology. Given the robust change in total mitochondrial glutathione levels in Tg muscle, we decided to test whether the ectopic UCP1 expression was associated with oxidative damage. Specifically, we measured total protein carbonyl adducts, which are generated by lipid peroxidation. No change in total protein carbonyls was observed between WT and Tg gastrocnemius muscles (Fig. 6C). Thus, our observations indicate that UCP1 lowers mitochondrial ROS production in a GDP-sensitive manner but only when it is expressed in muscle tissue.
Fig. 6.
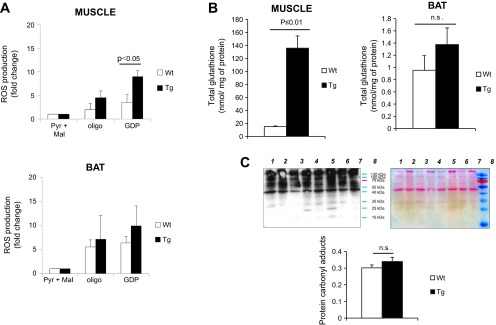
UCP1 lowers mitochondrial ROS emission from muscle but not BAT mitochondria. A: ROS emission measurements from mitochondria isolated from skeletal muscle and BAT of WT and Tg mice. Assays were initiated by addition of 5 mM pyruvate and 3 mM malate (Pyr+Mal) followed by sequential addition of oligomycin (1.3 μg/ml) and saturating amounts of GDP (1 mM). ROS production was measured for ∼10 min after each treatment using H2-DCFDA. B: total glutathione content in skeletal muscle and BAT mitochondria isolated from WT and Tg mice. Measurement of glutathione was conducted as described in materials and methods; n = 3, means ± SE, Student's t-test. C: detection of total protein carbonyl adducts in gastrocnemius muscle extracted from WT and Tg mice. Lanes 1, 3, 5, and 7 correspond to WT; lanes 2, 4, 6, and 8 correspond to Tg. Protein carbonyls were detected using the Oxyblot assay kit. Ponceau S staining of membranes served as loading control. Lane intensities were quantified using Image J software; n = 4, means ± SE, Student's t-test.
DISCUSSION
Skeletal muscle makes up ∼40% of total adult body weight in humans, is responsible for ∼20% of resting metabolic rate, is a major site for both carbohydrate and fatty acid oxidation, and as such has been posited as a target for obesity treatment (20). Proton leaks in muscle can account for up to ∼50% of resting muscle respiration and ∼10% of the whole body resting metabolic rate (20, 21). Thus, by slight activation of proton leak in muscle, whole body energy expenditure could be significantly increased. In the present study, we found that UCP1 expression in muscle decreased mouse body weight, adiposity, and the weight of a number of tissues including skeletal muscle. Although a trend for increased type I fiber content in gastrocnemius muscle was observed, it did not reach statistical significance. In a previous report, ectopic UCP1 expression in muscle was found to induce fiber type switching in gastrocnemius muscle; specifically, there was an increased proportion of oxidative (type I) vs. glycolytic (type II) fibers. However, in the latter study, mice were much older (ages 10–30 wk) than ours (ages 7–12 wk). (9). In addition, UCP1 levels in the latter study were much higher than in the present study: levels in muscle were roughly equal to those in BAT (9). The fact that Tg mice had an ∼51% decrease in white adipose mass that coincided with increased energy expenditure and food intake reveals clearly a hypermetabolic state in these mice. These results are in agreement with previously published work showing that mice expressing UCP1 in muscle are hyperphagic (9). However, unlike the previous study, our mice were much younger (7–12 wk), as opposed to ∼20 wk, and our Tg mice had a significant decrease in adipose tissue compared with WT mice. Moreover, there are differences in genetic background (C57BL/6J vs. B6D2F1). Finally, our study was limited to males. Kattarle et al. (23) recently established that UCP1 expression in muscle protects against weight gain when mice are fed a low-carbohydrate/high-fat diet, but these differences are abolished with a high-carbohydrate-high-fat diet. They postulated that under a low-carbohydrate-high-fat diet skeletal muscle uncoupling through UCP1 promotes a healthier phenotype through selective macronutrient handling. This is consistent with our finding that Tg mice had increased muscle glucose uptake in vivo (as assessed by PET) and preferential glucose vs. fat utilization at the whole body level at night when mice are active and feeding. Our findings are also in line with previous reports showing that UCP1 expression in muscle increases insulin sensitivity and enhances glucose clearance and GLUT4 activity (17, 28). However, previous studies had limited mitochondrial bioenergetics analyses to support the whole body alterations.
Indeed, our findings show that the ectopic expression of UCP1 in muscle increases whole body O2 consumption in both light and dark phases of the day. RER was found to be higher in Tg mice in the dark phase, indicating preferential use of carbohydrates to support energy metabolism. These data are consistent with the decrease in adiposity and the increase in muscle glucose uptake. Furthermore, these observations support previously published results showing that UCP1 expression in muscle increases whole body energy expenditure (9, 25, 28). In postprandial states, skeletal muscle typically metabolizes glucose, storing it as glycogen or using it to produce ATP. By contrast, caloric restriction, exercise, or starvation induces a metabolic switch toward increased use of fatty acids to support energy metabolism. It is interesting to note that, during dark phases (wake cycles), compared with WT mice, Tg mice rely more on glucose to satisfy energy demands, whereas no differences in fatty acid use in sleep cycles (light phases) are observed. These data indicate that more glucose is oxidized in the Tg mice, consistent with their increased consumption of the high-carbohydrate chow and increased O2 consumption rates. The latter increases are associated with increased proton leak in muscle of Tg mice. It is also interesting to note that Tg mice exposed to cold temperatures (4°C) were able to further increase their O2 consumption rates. This result suggests that increasing UCP1-specific leak in muscle does not compromise cold-induced thermogenesis.
In this study, we also measured the energetics of mitochondria isolated from muscle of WT and Tg mice. These determinations were performed in parallel with determinations in BAT mitochondria. To assess the amount of proton leak associated with UCP1 in muscle or BAT mitochondria, we measured the rate of O2 consumption under state 4 conditions followed by titration of GDP, a well-characterized UCP1 inhibitor (13, 39). Notably, we found that 0.1 mM was sufficient to inhibit UCP1 in muscle, whereas up to 1 mM was required for BAT mitochondria, reflecting differences in the amount of UCP1 expressed in these tissues (i.e., UCP1 ectopically expressed in muscle is ∼87% lower than in BAT). Our measurements revealed that UCP1 accounts for ∼80% of the proton leak in Tg muscle mitochondria. This is in contrast to BAT mitochondria where incubation in 1 mM GDP decreased leak by only ∼40%. However, UCP1 is not expected to be fully activated, since BAT mitochondria were isolated and studied in the absence of added fatty acids. As well, the expression of UCP1 in muscle did not compromise oxidative phosphorylation in this tissue. Indeed, ADP stimulated respiration in muscle mitochondrial preparations from WT and Tg mice. In contrast, ADP did not stimulate respiration in BAT mitochondria. This observation is not surprising, since BAT does not contain high amounts of ATP synthase and relies largely on glycolysis to meet ATP demands (27). Thus, despite the presence of UCP1, muscle mitochondria can still actively generate ATP.
Our group recently investigated redox environment differences in muscle and BAT mitochondria (30). We found that, in contrast to muscle, mitochondria from BAT had a more oxidized 2GSH/GSSG, which was associated with higher ROS production (∼250% higher compared with muscle mitochondria). Interestingly these differences were attributed to UCP1 (30). BAT mitochondria from mice housed at room temperature produced high amounts of ROS, which were increased by the addition of the UCP1 activator oleate (30, 44). Moreover, cold acclimation of mice further increased BAT ROS production, and this was associated with oxidation of the glutathione pool (30). Given these previous observations, we decided to test the effect of UCP1 expression in muscle on mitochondrial redox. Surprisingly, ectopic expression of UCP1 in muscle mitochondria did not alter the rate of ROS production before or after the addition of oligomycin. However, the rate of ROS emission increased substantially following the addition of GDP. This result is in stark contrast to what we and others have observed in BAT mitochondria (e.g., GDP addition does not significantly enhance mitochondrial ROS production) (30, 44, 48). This would indicate that the expression of UCP1 in muscle alters the physiological function of the protein. It is interesting to note that the alteration in UCP1 function is not limited to skeletal muscle. Clarke et al. (5) showed that UCP1 expression in thymus suppressed ROS production when mitochondria isolated from thymus were incubated with specific electron transport chain substrates. Moreover, Keipert et al. (24) also measured superoxide production fluorometrically using Amplex Red in Tg mice overexpressing UCP1 in skeletal muscle; they showed that superoxide production was significantly diminished. However, superoxide production was not assessed under state 4o conditions (nonphosphorylating respiration), and muscle ROS production was not compared with that in BAT mitochondria. Whether or not UCP1 is involved in quenching mitochondrial ROS production in BAT mitochondria has been enthusiastically debated for a number of years. Indeed, our group and others have shown that UCP1 activation in BAT increases mitochondrial ROS production (30, 44), whereas others have concluded the opposite (36). It is important to point out that, unlike UCP3, UCP1 does not seem to be regulated by glutathionylation in BAT mitochondria (33). This could be attributed to low amounts of glutaredoxin-2 (Grx2) in BAT mitochondria; Grx2 is, however, expressed in high amounts in muscle (29, 30). Due to tissue-specific differences and to UCP1 and UCP3 sequence similarities, it is possible that UCP1 in muscle is regulated in a fashion similar to UCP3. Nonetheless, the differential function of UCP1 ROS control in BAT vs. other tissues is an interesting topic that warrants further study. It is also interesting to note that expressing UCP1 in muscle substantially increased the total amount of glutathione in muscle mitochondria. This observation clearly illustrates the fundamental link between uncoupling, ROS, and glutathione in skeletal muscle. Thus, our findings illustrate that 1) proton leak in muscle is required to control mitochondrial ROS emission, and 2) UCP1 can lower mitochondrial ROS emission when it is expressed in skeletal muscle.
In conclusion, muscle is a metabolically dynamic tissue in which energy demands and fuel types can change rapidly and drastically. The activation of proton leaks in this tissue has been proposed as a potential means for treating obesity, type 2 diabetes, and other metabolic diseases (20). In this study, we elucidated the metabolic consequences of artificially stimulating proton leaks by the ectopic expression of UCP1 in muscle. Clearly, excessive proton leaks could have adverse functional consequences in muscle, such as mitochondrial membrane potential collapse and metabolic dysfunction (impaired ATP production). Here, we demonstrate that artificially expressing UCP1 to just over a tenth of the levels normally found in BAT resulted in increased mitochondrial proton leak and whole body energy expenditure as well as decreased adiposity. Importantly, this did not compromise the capacity for ADP-induced coupled respiration in muscle mitochondria or adaptive thermogenesis at the level of the whole body. Ectopic UCP1 induced a striking increase in mitochondrial glutathione levels. Intriguingly, we also found that when UCP1 is expressed in muscle it plays a role in regulating mitochondrial ROS emission, whereas in BAT mitochondria it does not. This observation leads to the question of whether or not the unique metabolic/proteomic signatures of different tissues are key determinants for the function of uncoupling proteins. Further studies to address this question are clearly warranted.
GRANTS
This research was funded by a grant from the Natural Sciences and Engineering Research Council (NSERC) of Canada (M.-E. Harper), by an Ontario Graduate Scholarship (to C. N.-K. Adjeitey), and a postdoctoral fellowship from the Canadian Institutes of Health Research (to R. J. Mailloux).
DISCLOSURES
No conflicts of interest, financial or otherwise, are declared by the author(s).
AUTHOR CONTRIBUTIONS
Author contributions: C.N.-K.A. and R.J.M. performed experiments; C.N.-K.A. and R.J.M. analyzed data; C.N.-K.A., R.J.M., R.A.d., and M.-E.H. interpreted results of experiments; C.N.-K.A. and R.J.M. prepared figures; C.N.-K.A. drafted manuscript; C.N.-K.A., R.J.M., R.A.d., and M.-E.H. edited and revised manuscript; C.N.-K.A., R.J.M., R.A.d., and M.-E.H. approved final version of manuscript; R.J.M., R.A.d., and M.-E.H. conception and design of research.
ACKNOWLEDGMENTS
Excellent technical assistance was provided by Jian Xuan. Mice overexpressing UCP1 in skeletal muscle were provided kindly by Dr. Frédéric Bouillaud via the laboratory of Dr. Daniel Kelly. We also thank Dr. Céline Aguer for help and advice with regard to the Oxyblot assay. Finally, we thank Myra Kordos and Christine Archer for technical support in for the microPET imaging, data collection, and analysis.
REFERENCES
- 1. Affourtit C, Crichton PG, Parker N, Brand MD. Novel uncoupling proteins. Novartis Foundation Symp 287: 70–80; discussion 80–91, 2007 [PubMed] [Google Scholar]
- 2. Azzu V, Brand MD. The on-off switches of the mitochondrial uncoupling proteins. Trends Biochem Sci 35: 298–307, 2010 [DOI] [PMC free article] [PubMed] [Google Scholar]
- 3. Cannon B, Shabalina IG, Kramarova TV, Petrovic N, Nedergaard J. Uncoupling proteins: a role in protection against reactive oxygen species—or not? Biochim Biophys Acta 1757: 449–458, 2006 [DOI] [PubMed] [Google Scholar]
- 4. Clapham JC, Arch JR, Chapman H, Haynes A, Lister C, Moore GB, Piercy V, Carter SA, Lehner I, Smith SA, Beeley LJ, Godden RJ, Herrity N, Skehel M, Changani KK, Hockings PD, Reid DG, Squires SM, Hatcher J, Trail B, Latcham J, Rastan S, Harper AJ, Cadenas S, Buckingham JA, Brand MD, Abuin A. Mice overexpressing human uncoupling protein-3 in skeletal muscle are hyperphagic and lean. Nature 406: 415–418, 2000 [DOI] [PubMed] [Google Scholar]
- 5. Clarke KJ, Porter RK. Uncoupling protein 1 dependent reactive oxygen species production by thymus mitochondria. Int J Biochem Cell Biol 45: 81–89, 2013 [DOI] [PubMed] [Google Scholar]
- 6. Costford SR, Chaudhry SN, Crawford SA, Salkhordeh M, Harper ME. Long-term high-fat feeding induces greater fat storage in mice lacking UCP3. Am J Physiol Endocrinol Metab 295: E1018–E1024, 2008 [DOI] [PubMed] [Google Scholar]
- 7. Costford SR, Chaudhry SN, Salkhordeh M, Harper ME. Effects of the presence, absence, and overexpression of uncoupling protein-3 on adiposity and fuel metabolism in congenic mice. Am J Physiol Endocrinol Metab 290: E1304–E1312, 2006 [DOI] [PubMed] [Google Scholar]
- 8. Costford SR, Seifert EL, Bezaire VMFG, Bevilacqua L, Gowing A, Harper ME. The energetic implications of uncoupling protein-3 in skeletal muscle. Appl Physiol Nutr Metab 32: 884–894, 2007 [DOI] [PubMed] [Google Scholar]
- 9. Couplan E, Gelly C, Goubern M, Fleury C, Quesson B, Silberberg M, Thiaudiere E, Mateo P, Lonchampt M, Levens N, De Montrion C, Ortmann S, Klaus S, Gonzalez-Barroso MD, Cassard-Doulcier AM, Ricquier D, Bigard AX, Diolez P, Bouillaud F. High level of uncoupling protein 1 expression in muscle of transgenic mice selectively affects muscles at rest and decreases their IIb fiber content. J Biol Chem 277: 43079–43088, 2002 [DOI] [PubMed] [Google Scholar]
- 10. Cypess AM, Lehman S, Williams G, Tal I, Rodman D, Goldfine AB, Kuo FC, Palmer EL, Tseng YH, Doria A, Kolodny GM, Kahn CR. Identification and importance of brown adipose tissue in adult humans. N Engl J Med 360: 1509–1517, 2009 [DOI] [PMC free article] [PubMed] [Google Scholar]
- 11. Enerback S, Jacobsson A, Simpson EM, Guerra C, Yamashita H, Harper ME, Kozak LP. Mice lacking mitochondrial uncoupling protein are cold-sensitive but not obese. Nature 387: 90–94, 1997 [DOI] [PubMed] [Google Scholar]
- 12. Estey C, Seifert EL, Aguer C, Moffat C, Harper ME. Calorie restriction in mice overexpressing UCP3: evidence that prior mitochondrial uncoupling alters response. Exp Gerontol 47: 361–371, 2012 [DOI] [PMC free article] [PubMed] [Google Scholar]
- 13. Fedorenko A, Lishko PV, Kirichok Y. Mechanism of fatty-acid-dependent UCP1 uncoupling in brown fat mitochondria. Cell 151: 400–413, 2012 [DOI] [PMC free article] [PubMed] [Google Scholar]
- 14. Fernandez-Vizarra E, Lopez-Perez MJ, Enriquez JA. Isolation of biogenetically competent mitochondria from mammalian tissues and cultured cells. Methods 26: 292–297, 2002 [DOI] [PubMed] [Google Scholar]
- 15. Gerrits MF, Ghosh S, Kavaslar N, Hill B, Tour A, Seifert EL, Beauchamp B, Gorman S, Stuart J, Dent R, McPherson R, Harper ME. Distinct skeletal muscle fiber characteristics and gene expression in diet-sensitive versus diet-resistant obesity. J Lipid Res 51: 2394–2404, 2010 [DOI] [PMC free article] [PubMed] [Google Scholar]
- 16. Goldstein DJ, Rampey AH, Jr, Roback PJ, Wilson MG, Hamilton SH, Sayler ME, Tollefson GD. Efficacy and safety of long-term fluoxetine treatment of obesity–maximizing success. Obes Res 3, Suppl 4: 481S–490S, 1995 [DOI] [PubMed] [Google Scholar]
- 17. Han DH, Nolte LA, Ju JS, Coleman T, Holloszy JO, Semenkovich CF. UCP-mediated energy depletion in skeletal muscle increases glucose transport despite lipid accumulation and mitochondrial dysfunction. Am J Physiol Endocrinol Metab 286: E347–E353, 2004 [DOI] [PubMed] [Google Scholar]
- 18. Hany TF, Gharehpapagh E, Kamel EM, Buck A, Himms-Hagen J, von Schulthess GK. Brown adipose tissue: a factor to consider in symmetrical tracer uptake in the neck and upper chest region. Eur J Nucl Med 29: 1393–1398, 2002 [DOI] [PubMed] [Google Scholar]
- 19. Harper ME, Dent R, Monemdjou S, Bezaire V, Van Wyck L, Wells G, Kavaslar GN, Gauthier A, Tesson F, McPherson R. Decreased mitochondrial proton leak and reduced expression of uncoupling protein 3 in skeletal muscle of obese diet-resistant women. Diabetes 51: 2459–2466, 2002 [DOI] [PubMed] [Google Scholar]
- 20. Harper ME, Green K, Brand MD. The efficiency of cellular energy transduction and its implications for obesity. Annu Rev Nutr 28: 13–33, 2008 [DOI] [PubMed] [Google Scholar]
- 21. Jastroch M, Divakaruni AS, Mookerjee S, Treberg JR, Brand MD. Mitochondrial proton and electron leaks. Essays Biochem 47: 53–67, 2010 [DOI] [PMC free article] [PubMed] [Google Scholar]
- 22. Jia H, Lubetkin EI. Obesity-related quality-adjusted life years lost in the U. S. from 1993 to 2008. Am J Prev Med 39: 220–227, 2010 [DOI] [PubMed] [Google Scholar]
- 23. Katterle Y, Keipert S, Hof J, Klaus S. Dissociation of obesity and insulin resistance in transgenic mice with skeletal muscle expression of uncoupling protein 1. Physiol Genomics 32: 352–359, 2008 [DOI] [PubMed] [Google Scholar]
- 24. Keipert S, Klaus S, Heldmaier G, Jastroch M. UCP1 ectopically expressed in murine muscle displays native function and mitigates mitochondrial superoxide production. Biochim Biophys Acta 1797: 324–330, 2010 [DOI] [PubMed] [Google Scholar]
- 25. Klaus S, Rudolph B, Dohrmann C, Wehr R. Expression of uncoupling protein 1 in skeletal muscle decreases muscle energy efficiency and affects thermoregulation and substrate oxidation. Physiol Genomics 21: 193–200, 2005 [DOI] [PubMed] [Google Scholar]
- 26. Korshunov SS, Skulachev VP, Starkov AA. High protonic potential actuates a mechanism of production of reactive oxygen species in mitochondria. FEBS Lett 416: 15–18, 1997 [DOI] [PubMed] [Google Scholar]
- 27. Kramarova TV, Shabalina IG, Andersson U, Westerberg R, Carlberg I, Houstek J, Nedergaard J, Cannon B. Mitochondrial ATP synthase levels in brown adipose tissue are governed by the c-Fo subunit P1 isoform. FASEB J 22: 55–63, 2008 [DOI] [PubMed] [Google Scholar]
- 28. Li B, Nolte LA, Ju JS, Han DH, Coleman T, Holloszy JO, Semenkovich CF. Skeletal muscle respiratory uncoupling prevents diet-induced obesity and insulin resistance in mice. Nat Med 6: 1115–1120, 2000 [DOI] [PubMed] [Google Scholar]
- 29. Lundberg M, Johansson C, Chandra J, Enoksson M, Jacobsson G, Ljung J, Johansson M, Holmgren A. Cloning and expression of a novel human glutaredoxin (Grx2) with mitochondrial and nuclear isoforms. J Biol Chem 276: 26269–26275, 2001 [DOI] [PubMed] [Google Scholar]
- 30. Mailloux RJ, Adjeitey CN, Xuan JY, Harper ME. Crucial yet divergent roles of mitochondrial redox state in skeletal muscle vs. brown adipose tissue energetics. FASEB J 26: 363–375, 2012 [DOI] [PubMed] [Google Scholar]
- 31. Mailloux RJ, Dumouchel T, Aguer C, deKemp R, Beanlands R, Harper ME. Hexokinase II acts through UCP3 to suppress mitochondrial reactive oxygen species production and maintain aerobic respiration. Biochem J 437: 301–311, 2011 [DOI] [PubMed] [Google Scholar]
- 32. Mailloux RJ, Fu A, Robson-Doucette C, Allister E, Wheeler MB, Screaton R, Harper ME. Glutathionylation state of uncoupling protein-2 and the control of glucose-stimulated insulin secretion. J Biol Chem 287: 39673–39685, 2012 [DOI] [PMC free article] [PubMed] [Google Scholar]
- 33. Mailloux RJ, Seifert EL, Bouillaud F, Aguer C, Collins S, Harper ME. Glutathionylation acts as a control switch for uncoupling proteins UCP2 and UCP3. J Biol Chem 286: 21865–21875, 2011 [DOI] [PMC free article] [PubMed] [Google Scholar]
- 34. Mailloux RJ, Xuan JY, Beauchamp B, Jui L, Lou M, Harper ME. Glutaredoxin-2 is required to control proton leak through uncoupling protein-3. J Biol Chem 288: 8365–8379, 2013 [DOI] [PMC free article] [PubMed] [Google Scholar]
- 35. Marceau P, Biron S, Hould FS, Marceau S, Simard S, Thung SN, Kral JG. Liver pathology and the metabolic syndrome X in severe obesity. J Clin Endocrinol Metab 84: 1513–1517, 1999 [DOI] [PubMed] [Google Scholar]
- 36. Oelkrug R, Kutschke M, Meyer CW, Heldmaier G, Jastroch M. Uncoupling protein 1 decreases superoxide production in brown adipose tissue mitochondria. J Biol Chem 285: 21961–21968, 2010 [DOI] [PMC free article] [PubMed] [Google Scholar]
- 37. Ortega-Molina A, Efeyan A, Lopez-Guadamillas E, Munoz-Martin M, Gomez-Lopez G, Canamero M, Mulero F, Pastor J, Martinez S, Romanos E, Mar Gonzalez-Barroso M, Rial E, Valverde AM, Bischoff JR, Serrano M. Pten positively regulates brown adipose function, energy expenditure, and longevity. Cell Metab 15: 382–394, 2012 [DOI] [PubMed] [Google Scholar]
- 38. Papa S, Skulachev VP. Reactive oxygen species, mitochondria, apoptosis and aging. Mol Cell Biochem 174: 305–319, 1997 [PubMed] [Google Scholar]
- 39. Parker N, Crichton PG, Vidal-Puig AJ, Brand MD. Uncoupling protein-1 (UCP1) contributes to the basal proton conductance of brown adipose tissue mitochondria. J Bioenerg Biomembr 41: 335–342, 2009 [DOI] [PubMed] [Google Scholar]
- 40. Ricquier D, Bouillaud F. The mitochondrial uncoupling protein: structural and genetic studies. Prog Nucleic Acid Res Mol Biol 56: 83–108, 1997 [DOI] [PubMed] [Google Scholar]
- 41. Ricquier D, Bouillaud F. The uncoupling protein homologues: UCP1, UCP2, UCP3, StUCP and AtUCP. Biochem J 2: 161–179, 2000 [PMC free article] [PubMed] [Google Scholar]
- 42. Rogers GW, Brand MD, Petrosyan S, Ashok D, Elorza AA, Ferrick DA, Murphy AN. High throughput microplate respiratory measurements using minimal quantities of isolated mitochondria. PLos One 6: e21746, 2011 [DOI] [PMC free article] [PubMed] [Google Scholar]
- 43. Rothwell NJ, Stock MJ. Influence of noradrenaline on blood flow to brown adipose tissue in rats exhibiting diet-induced thermogenesis. Pflügers Arch 389: 237–242, 1981 [DOI] [PubMed] [Google Scholar]
- 44. Schonfeld P, Wojtczak L. Brown adipose tissue mitochondria oxidizing fatty acids generate high levels of reactive oxygen species irrespective of the uncoupling protein-1 activity state. Biochim Biophys Acta 1817: 410–418, 2012 [DOI] [PubMed] [Google Scholar]
- 45. Starkov AA. “Mild” uncoupling of mitochondria. Biosci Rep 17: 273–279, 1997 [DOI] [PubMed] [Google Scholar]
- 46. van Marken Lichtenbelt WD, Vanhommerig JW, Smulders NM, Drossaerts JM, Kemerink GJ, Bouvy ND, Schrauwen P, Teule GJ. Cold-activated brown adipose tissue in healthy men. N Engl J Med 360: 1500–1508, 2009 [DOI] [PubMed] [Google Scholar]
- 46a. van Marken Lichtenbelt WD, Schrauwen P. Implications of nonshivering thermogenesis for energy balance regulation in humans. Am J Physiol Regul Integr Comp Physiol 301: R285–R296, 2011 [DOI] [PubMed] [Google Scholar]
- 47. Virtanen KA, Lidell ME, Orava J, Heglind M, Westergren R, Niemi T, Taittonen M, Laine J, Savisto NJ, Enerback S, Nuutila P. Functional brown adipose tissue in healthy adults. N Engl J Med 360: 1518–1525, 2009 [DOI] [PubMed] [Google Scholar]
- 48. Westerberg R, Mansson JE, Golozoubova V, Shabalina IG, Backlund EC, Tvrdik P, Retterstol K, Capecchi MR, Jacobsson A. ELOVL3 is an important component for early onset of lipid recruitment in brown adipose tissue. J Biol Chem 281: 4958–4968, 2006 [DOI] [PubMed] [Google Scholar]
- 49. Whittle AJ, Lopez M, Vidal-Puig A. Using brown adipose tissue to treat obesity - the central issue. Trends Mol Med 17: 405–411, 2011 [DOI] [PubMed] [Google Scholar]
- 50. Wing RR. Physical activity in the treatment of the adulthood overweight and obesity: current evidence and research issues. Med Sci Sport Exerc 31: S547–552, 1999 [DOI] [PubMed] [Google Scholar]
- 51. Yoneshiro T, Aita S, Matsushita M, Okamatsu-Ogura Y, Kameya T, Kawai Y, Miyagawa M, Tsujisaki M, Saito M. Age-related decrease in cold-activated brown adipose tissue and accumulation of body fat in healthy humans. Obesity (Silver Spring) 19: 1755–1760, 2011 [DOI] [PubMed] [Google Scholar]