Abstract
Mitochondria are both a source and target of the actions of reactive oxygen species and possess a complex system of inter-related antioxidants that control redox signaling and protect against oxidative stress. Interestingly, the antioxidant enzyme heme oxygenase-1 (HO-1) is not present in the mitochondria despite the fact that the organelle is the site of heme synthesis and contains multiple heme proteins. Detoxification of heme is an important protective mechanism since the reaction of heme with hydrogen peroxide generates pro-oxidant ferryl species capable of propagating oxidative stress and ultimately cell death. We therefore hypothesized that a mitochondrially localized HO-1 would be cytoprotective. To test this, we generated a mitochondria-targeted HO-1 cell line by transfecting HEK293 cells with a plasmid construct containing the manganese superoxide dismutase mitochondria leader sequence fused to HO-1 cDNA (Mito-HO-1). Nontargeted HO-1-overexpressing cells were generated by transfecting HO-1 cDNA (HO-1) or empty vector (Vector). Mitochondrial localization of HO-1 with increased HO activity in the mitochondrial fraction of Mito-HO-1 cells was observed, but a significant decrease in the expression of heme-containing proteins occurred in these cells. Both cytosolic HO-1- and Mito-HO-1-expressing cells were protected against hypoxia-dependent cell death and loss of mitochondrial membrane potential, but these effects were more pronounced with Mito-HO-1. Furthermore, decrement in production of tricarboxylic acid cycle intermediates following hypoxia was significantly mitigated in Mito-HO-1 cells. These data suggest that specific mitochondrially targeted HO-1 under acute pathological conditions may have beneficial effects, but the selective advantage of long-term expression is constrained by a negative impact on the synthesis of heme-containing mitochondrial proteins.
Keywords: heme, hypoxia
cellular oxidative injury is one of the major determinants of the pathogenicity of a number of clinical disorders, including ischemia-reperfusion, inflammatory diseases, and drug-induced toxicity (1, 24, 28, 35). Mitochondria are an important source of superoxide and hydrogen peroxide production, which under physiological conditions plays a role in cell signaling but can also be deleterious following damage to the respiratory chain (4). Because the mitochondria are both a source and target of the biological effects of hydrogen peroxide, the endogenous mitochondrial antioxidant pathways are critical in the regulation of retrograde signaling and mitigating toxicity. The dismutation of superoxide to hydrogen peroxide is controlled by the mitochondrial-specific enzyme manganese superoxide dismutase (MnSOD) in the matrix, which is essential for cell signaling (3, 4). Mitochondrial thiols are also linked through an antioxidant network with the presence of a mitochondrial-specific glutathione peroxidase and peroxiredoxin isoforms contributing to the regulation of the steady-state levels of hydrogen and lipid peroxides (19). The toxicity of both hydrogen and lipid peroxides is greatly enhanced by reaction with heme or heme proteins that generate strongly pro-oxidant ferryl forms of heme (16, 36). Therefore, heme synthesis and degradation are tightly regulated in cells. While regulation of heme biosynthesis in the mitochondria is accomplished through the modulation of δ-aminolevulinic acid synthase activity, the enzymatic detoxification of heme is controlled by the heme oxygenase (HO) isoenzymes.
HO primarily exists as two isoforms. Heme oxygenase-1 (HO-1) is the highly inducible, antioxidant, and anti-apoptotic enzyme that can be induced in most cells, whereas HO-2, the constitutive isoform, is expressed at low levels in certain tissues such as the testes and endothelium (2, 19). HO catalyzes the degradation of heme to equimolar quantities of iron, carbon monoxide, and biliverdin. Biliverdin is subsequently converted to bilirubin by biliverdin reductase, which also possesses antioxidant properties (20). Mitochondrion is the site of heme synthesis and also contains multiple heme-containing proteins in the electron transport chain but paradoxically does not contain the HO-1 enzyme. Recently, it has been reported that HO-1 may translocate to the mitochondrion under conditions of oxidative stress and that carbon monoxide may play a role in mitochondrial biogenesis, suggesting an intimate link between HO and mitochondrial function (6, 23, 31).
Given the relevance of reactive oxygen species (ROS) and heme in mitochondria dysfunction, we targeted HO-1 to the mitochondria and investigated the significance of such targeted expression in modulating mitochondrial function and integrity during oxidative injury. We demonstrate that HO-1 was targeted to the mitochondria and processed to a mature mitochondrial form following cleavage of the leader sequence. Mito-HO-1 was catalytically competent and capable of protecting against hemin-induced toxicity. Analysis of key mitochondrial heme-containing proteins showed that Mito-HO-1 decreased the levels of cytochrome c, cytochrome c oxidase subunits I and II with minimal effect on the non-heme-containing proteins citrate synthase and voltage-dependent anion channel (VDAC).
MATERIALS AND METHODS
Plasmids and generation of site-targeted HO-1 overexpression.
pCDNA3.1 vector (Invitrogen) was used to generate site-targeted HO-1-overexpressing renal epithelial cells. The entire protein-coding region of the human HO-1 gene was cloned into the XbaI site of the pcDNA3.1 vector to generate the 3.1/HO-1 (nontargeted HO-1-overexpressing) vector. The mitochondrial leader sequence of manganese superoxide dismutase gene was cloned upstream of the HO-1 cDNA sequence to generate the Mito-HO-1 (mitochondria-targeted HO-1-overexpressing) vector. pcDNA3.1 vector was used as a control (3.1/empty) vector.
HEK293 cells were transfected with these vectors using lipofectamine 2000 (Invitrogen), and stable clones were selected with the addition of zeocin (400 μg/ml; Invitrogen). Individual clones were isolated and maintained with 100 μg/ml zeocin. Stable cells were maintained in Dulbecco's Minimum Essential Medium supplemented with fetal bovine serum (10%), glutamine, and antibiotic-antimycotic (1×) at 37°C in 95% air-5% carbon dioxide.
Injury models.
Heme injury was induced by treating cells with heme (100 μM) for 8 h. 15d-PGJ2-mediated oxidative stress was induced by treating cells with 10 μM 15d-PGJ2 for 30 min. Hypoxic injury was induced by incubating cells in a chamber containing 1% O2-5% CO2-94% nitrogen for 24 h at 37°C. An O2 analyzer was used to determine oxygen levels in the chamber. Once the chamber was stabilized, no oscillations were measured in the O2 concentration.
Cell fractionation.
To fractionate mitochondria from cells for the determination of HO activity, cells were harvested in isolation buffer containing 20 mM Tris·HCl, pH 7.35, 300 mM sucrose, and 2 mM EGTA containing protease inhibitor cocktail and 1 mM phenylmethylsulfonyl fluoride (PMSF). Cell suspensions were homogenized using a Potter-Elvehjem homogenizer powered by a drill press (8). Nuclei and cellular debris were removed by centrifugation at 1,000 g for 10 min. The mitochondria fraction was obtained after centrifugation of the sample at 15,000 g for 10 min at 4°C. The mitochondrial pellet was washed with isolation buffer and centrifuged again at 15,000 g for 10 min at 4°C. The final mitochondrial pellet was used for analysis. For Western blot analysis, mitochondria were isolated using digitonin and nagarse as described previously (11). Briefly, cells were washed and harvested in mitochondria isolation buffer containing 50 mM HEPES, 0.1 M sucrose, 0.1 M potassium chloride, and 1 mM EGTA. Digitonin (100 mg/106 cells) was added, and the tubes were mixed by inversion before centrifugation at 500 g for 1 min. The supernatants were discarded, and the pellet was resuspended in isolation media containing nagarse (10 mg/106 cells). After 1 min, nagarse was quenched by adding BSA (4 mg) in isolation media containing protease inhibitors and 1 mM PMSF. Samples were then centrifuged for 5 min at 10,000 g, and the pellet was washed once more with BSA buffer and a final wash in isolation buffer without the addition of BSA. The mitochondrial suspension was filtered through a Bio-Rad microspin column before centrifugation. The final mitochondrial pellet was reconstituted in RIPA buffer containing 1 mM PMSF and protease inhibitor cocktail.
Western blot analysis.
Lysates were electrophoresed in a 10% or 12% SDS-polyacrylamide gel and transferred onto a Hybond C Extra membrane (Amersham Biosciences). Membranes were incubated with anti-HO-1 (1:5,000 dilution; Stressgen), anti-cytochrome c (1:1,000 dilution; Oncogene and Pharmingen), anti-complex V a subunit (1:10,000 dilution; Invitrogen), anti-complex II (70-kDa subunit; 1:5,000 dilution; Invitrogen), anti-complex I subunit (30-kDa subunit; 1:5,000 dilution; Invitrogen), anti-complex IV subunit I (1:1,000 dilution; Invitrogen), or anti-complex IV subunit II (1:1,000 dilution; Invitrogen) antibodies, followed by a peroxidase-conjugated goat anti-rabbit (anti-mouse or anti-chicken) IgG antibody (1:10,000 dilution; Jackson ImmunoResearch Laboratories). Horseradish peroxidase was detected using enhanced chemiluminescence. The membrane was stripped and probed with anti-actin antibody (1:5,000 dilution; Sigma-Aldrich) or anti-VDAC (1:1,000; MitoSciences) to confirm loading, transfer, and indicate the purity of the mitochondrial preparation.
Immunocytochemistry.
For double labeling of cytochrome c oxidase and HO-1, cells were grown on collagen-coated cover glass placed in the bottoms of 24-well cell culture dishes. Cells were washed and fixed in ice-cold methanol and blocked with 10% normal serum/1% BSA/1× PBS/1% Triton X-100 for 1 h at room temperature. Rabbit anti-HO-1 (1:500; Enzo Life Sciences) and mouse anti-cytochrome c oxidase (1:500; Invitrogen) were added to the cells for overnight incubation at 4°C. The following day, cells were washed with PBS containing 0.1% Tween 20. The normal serum block was repeated for 30 min, and cells were incubated with Texas Red-conjugated goat anti-mouse (1:5,000) and FITC-conjugated goat anti-rabbit (1:1,000) secondary antibodies for 1 h at room temperature. Following several washes, the cover glass was inverted and mounted on slides for confocal imaging. For Mitotracker Red staining, cells were incubated with 0.5 μM Mitotracker Red for 20 min before fixation.
HO enzyme activity measurement.
HO activity was measured by bilirubin generation as described previously (27). Briefly, cell lysates were centrifuged at 1,000 g for 10 min to remove intact cells and cellular debris. The supernatant was further centrifuged at 10,000 g for 20 min, and supernatant (cytosol) and pellet (mitochondria) were incubated with rat liver cytosol (3 mg), a source of biliverdin reductase, hemin (20 μM), glucose 6-phosphate (2 mM), glucose-6-phosphate dehydrogenase (0.2 units), and NADPH (0.8 mM) for 1 h at 37°C in the dark. The bilirubin formed was extracted with chloroform; Δoptical density 464 to 530 nm was measured, and enzyme activity was calculated as picomole of bilirubin formed per 60 min per milligram protein. Fold change in HO activity was determined by comparing the activity of HO-1-overexpressing cells with Vector cells in the cytosol and mitochondria.
Cytotoxicity assay.
Cells were plated in six-well plates and incubated with hemin (100 μM) for 8 h. Cells were lysed in PBS containing 0.1% Triton X-100. The cell lysates and media were collected and centrifuged for 5 min, and supernatant was used to measure lactate dehydrogenase (LDH) activity. Cytotoxicity was expressed as percent LDH release. Following hypoxia, cell viability was measured using the 3-[4,5-dimethylthiazol-2-yl]-2,5-diphenyltetrazolium bromide (MTT) assay. Two hundred microliters of MTT reagent (0.5 mg/ml; Sigma) were added to each well and incubated for 1 h. The reagent was removed, the resulting formazan was dissolved in DMSO, and absorbance was measured at 570 nm. Cell viability was extrapolated from a standard curve, and results were expressed as percent viability.
Measurement of ROS.
ROS generation was measured as described previously (2). Briefly, stable cells were plated on collagen-coated chamber slides and treated with 10 μM 15d-PGJ2 for 30 min. Cells were loaded with 2.5 μM 2′,7′-dichlorodihydrofluorescein diacetate [H2DCF-DA (Invitrogen, Carlsbad, CA)] for 30 min before imaging. Cells were imaged with a laser-scanning confocal scan-head (Olympus FV300) mounted on an inverted fluorescence microscope (Olympus IX71) equipped with oil immersion objectives (Olympus 60X 1.2NA). DCF fluorescence was excited with an Ar laser (488 nm) and its emission filtered at 510 ± 20 nm. In addition, 0.5 μM Mitotracker Deep Red (Molecular Probes) was added to cells for 30 min to confirm similar cell numbers among sample groups. Mitotracker fluorescence was excited with a He-Ne red laser (633 nm) and its emission filtered at 660 ± 20 nm; sequential imaging of double-labeled cells was achieved using a 570-nm dichroic mirror. Single images were scanned at 512 × 512 pixel resolution (1.96 s/frame) avoiding photomultiplier (PMT) saturation (400–500 V PMT voltage, 1× gain, 0 offset), saved as TIFF files, and analyzed using ImageJ (National Institute of Health). The average pixel intensity within a single region of interest (ROI) defined around individual cells in DCF dye fluorescence images was used for quantitative estimation of ROS levels. Fluorescence intensity was measured in 8 fields and at least 40 different ROIs per field and averaged. Results are expressed as DCF fluorescence (arbitrary units) in 15d-PGJ2-treated cells compared with untreated controls.
Measurement of mitochondrial membrane potential.
The mitochondrial inner membrane electrochemical potential was assessed using 5,5′,6,6′-tetrachloro-1,1′,3,3′-tetraethylbenzimidazolylcarbocyanine iodide (JC-1)(Invitrogen) as described previously (27). Briefly, cells were grown in 24-well culture plates, and JC-1 (7.4 μM) was added directly to the cells in culture medium and incubated for 30 min. Cells were washed with PBS, and red/green fluorescence was measured using a fluorescence plate reader. The results are expressed as the ratio of red to green fluorescence.
Bioenergetic measurements.
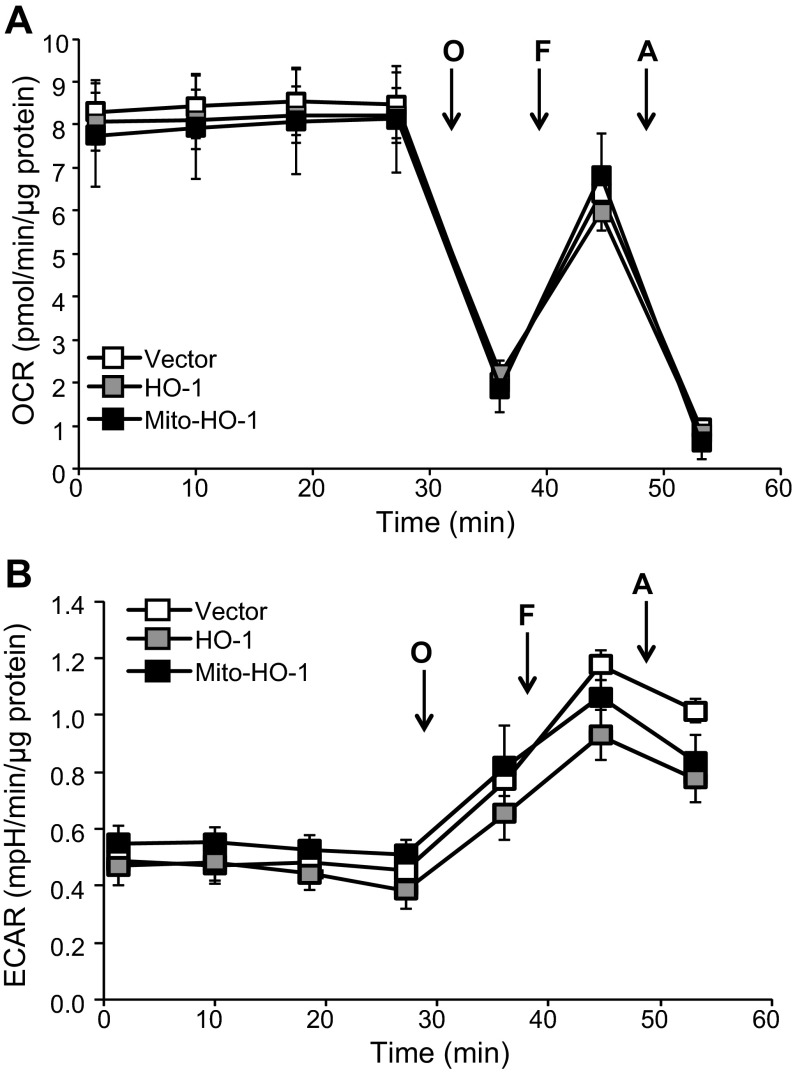
Mitochondrial function and glycolytic flux were simultaneously determined in intact cells over time by the XF24 Analyzer (Seahorse Biosciences) as described previously (9). Briefly, HEK293 from vector, HO-1, and Mito-HO-1 were seeded at 20,000 cells/well into a specialized seahorse microplate (V7) 24 h before the XF24 assay. Media was changed to XF-DMEM (Dulbecco's modified Eagle's medium supplemented with 5 mM glucose, 0.1 mM sodium pyruvate, 4 mM l-glutamine, and 0.2 mM carnitine at pH 7.4) unbuffered 1 h before assay. Basal measurements of oxygen consumption rate (OCR) and extracellular acidification rate (ECAR) were established, and inhibitors of mitochondrial respiration were injected sequentially as indicated to determine mitochondria function and glycolysis.
Tricarboxylic acid cycle metabolite analysis.
Cells were rinsed with ice-cold isotonic PBS, harvested with methanol (cooled to −45°C), and centrifuged at 10,000 g for 20 min to remove precipitated protein. The supernatant was dried under a steam of nitrogen and reconstituted in 5% acetic acid. Samples and standards of the glycolytic and tricarboxylic acid (TCA) cycle intermediates were then derivatized using Amplifex Reagent (AB Sciex, Concorde, Ontario, Canada) and again evaporated to dryness under nitrogen. The derivatized samples and standards were analyzed by quantitative liquid chromatography-multiple reaction ion monitoring mass spectrometry analysis (LC-MRM-MS) on an AB Sciex API-4000 Q-Trap using a Shimadzu Prominence LC. Separation was carried out on a 150 mm × 2 mm ID Phenomenex Synergi Polar-RP 80A 4 micron column. The eluent from the LC column was passed into the turboionspray interface with the Ionspray voltage set at 5,500 V for operation in the positive mode and −4,500 V in the negative mode. Precursor ion-product ion transitions for TCA cycle intermediates that reacted with the Ampliflex reagent (α-ketoglutarate, oxaloacetate, and pyruvate) were recorded in the positive mode. These were mass-to-charge ratio (m/z) 261/118 (α-ketoglutarate), 247/118 (oxaloacetate), and 204/144 (pyruvate). The intermediates that did not undergo reaction with the Ampliflex reagent were recorded in the negative mode: citrate (m/z 191/87), isocitrate (m/z 191/73), fumarate (m/z 115/71), and malate (m/z 133/115). Data were collected for each transition for 30 ms. The data are expressed as microgram metabolite per milligram protein.
Statistical analysis.
Data are presented as means ± SE. The Student's t-test was used for comparisons between two groups. For the comparisons that involved more than two groups, ANOVA and the Newman-Keuls test were used for analysis, with statistical significance considered at P < 0.05.
RESULTS
Generation of targeted HO-1-overexpressing stable cells.
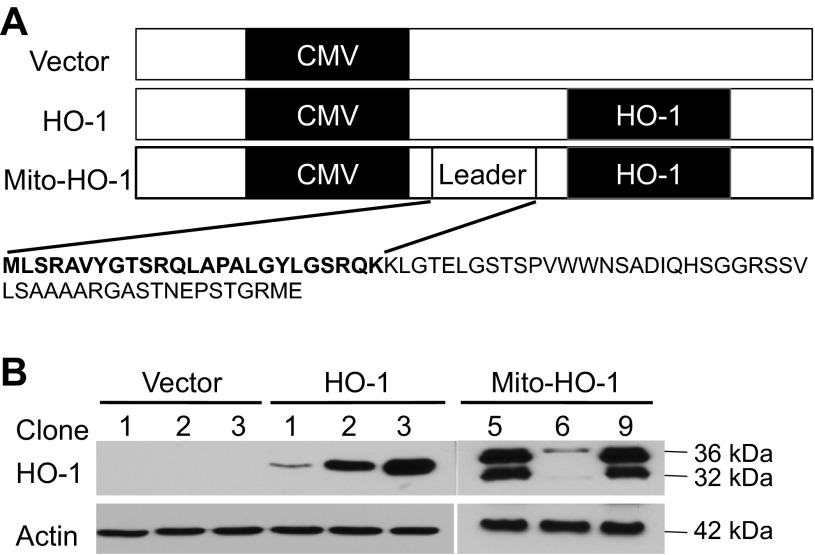
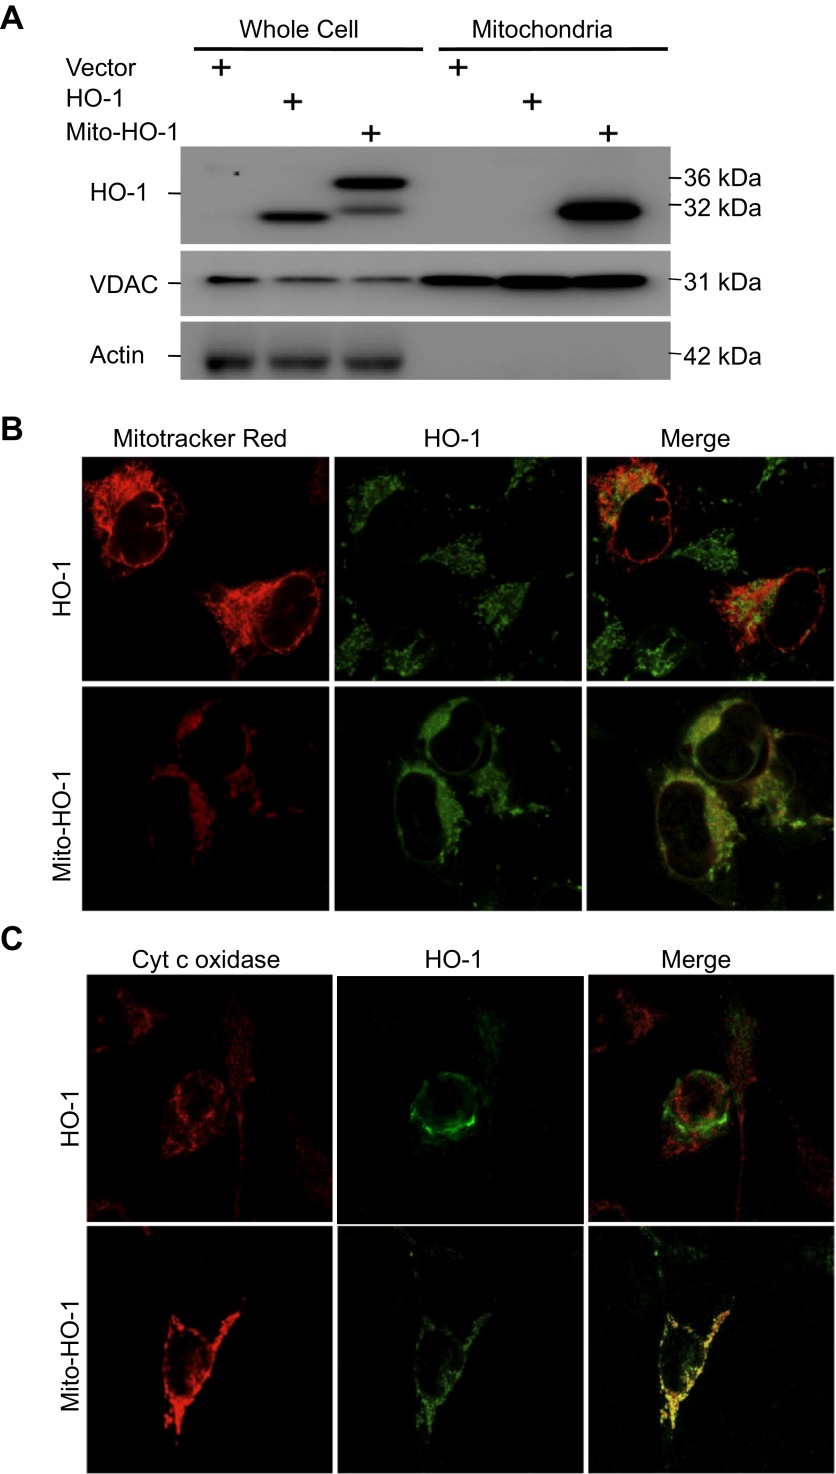
To evaluate the beneficial effects of mitochondria-targeted HO-1, we generated renal epithelial cells that stably overexpress HO-1 specifically in the mitochondria using a fusion protein containing the entire coding sequence of human HO-1 cDNA downstream of the MnSOD mitochondrial leader sequence (Mito-HO-1; Fig. 1A). We also generated non-mitochondria-targeted HO-1-overexpressing cells by transfecting human HO-1 cDNA and empty pCDNA3.1 vector cells (Vector). Clonal cell populations of empty vector alone (Vector), non-targeted HO-1 vector (HO-1), and Mito-HO-1 were selected and confirmed by Western blot analysis (Fig. 1B). Vector clone 1, HO-1 clone 3, and Mito-HO-1 clone 5 were used for all subsequent experiments. As shown in Fig. 2A, both Mito-HO-1 and HO-1 cells showed a significant increase in HO-1 expression by Western blot analysis. Mito-HO-1 cells also overexpressed a slower-migrating HO-1 protein (∼36 kDa), which represents the mitochondria leader fused with the HO-1 protein (Fig. 2A). Furthermore, Mito-HO-1 cells showed an increase in mitochondrial HO-1 expression compared with HO-1 cells.
Fig. 1.
Plasmid construction for targeted heme oxygenase-1 (HO-1) overexpression. A: HO-1 cDNA was cloned into XbaI of pcDNA3.1 plasmid (vector) to generate HO-1 vector. The mitochondria leader sequence of the manganese superoxide dismutase gene was cloned 5′ to the HO-1 cDNA (HindIII and XbaI) to generate a plasmid construct containing the manganese superoxide dismutase mitochondria leader sequence fused to HO-1 cDNA (Mito-HO-1) vector. The leader sequence is indicated in bold. B: HEK293 cells were transfected with the indicated vectors, and stable transfectants were selected using specific antibiotics. Whole cell lysates from three different clones per vector were analyzed for HO-1 expression by Western blot analysis. Unprocessed HO-1 protein (leader sequence attached to the HO-1 protein) is represented as the 36 kDa.
Fig. 2.
Cellular localization of HO-1 expression. A: whole cell lysates and mitochondria were analyzed for HO-1 expression by Western blot analysis. HO-1 is overexpressed in the HO-1 and Mito-HO-1 cell lysates. A higher-molecular-weight protein in the Mito-HO-1 cell lysates represents the unprocessed HO-1. HO-1 is expressed in the mitochondria of only Mito-HO-1 cells. Voltage-dependent anion channel (VDAC, mitochondrial marker) and actin (cytosol marker) serve as loading controls. The absence of actin in the mitochondrial fraction indicates the purity of the mitochondria prep. B and C: mitochondria were labeled with Mitotracker Red (B) or cytochrome c oxidase (C), and cells were immunostained with anti-HO-1 antibody. HO-1 colocalized with mitochondria only in Mito-HO-1 cells.
Characterization of vector, HO-1, and Mito-HO-1 cells.
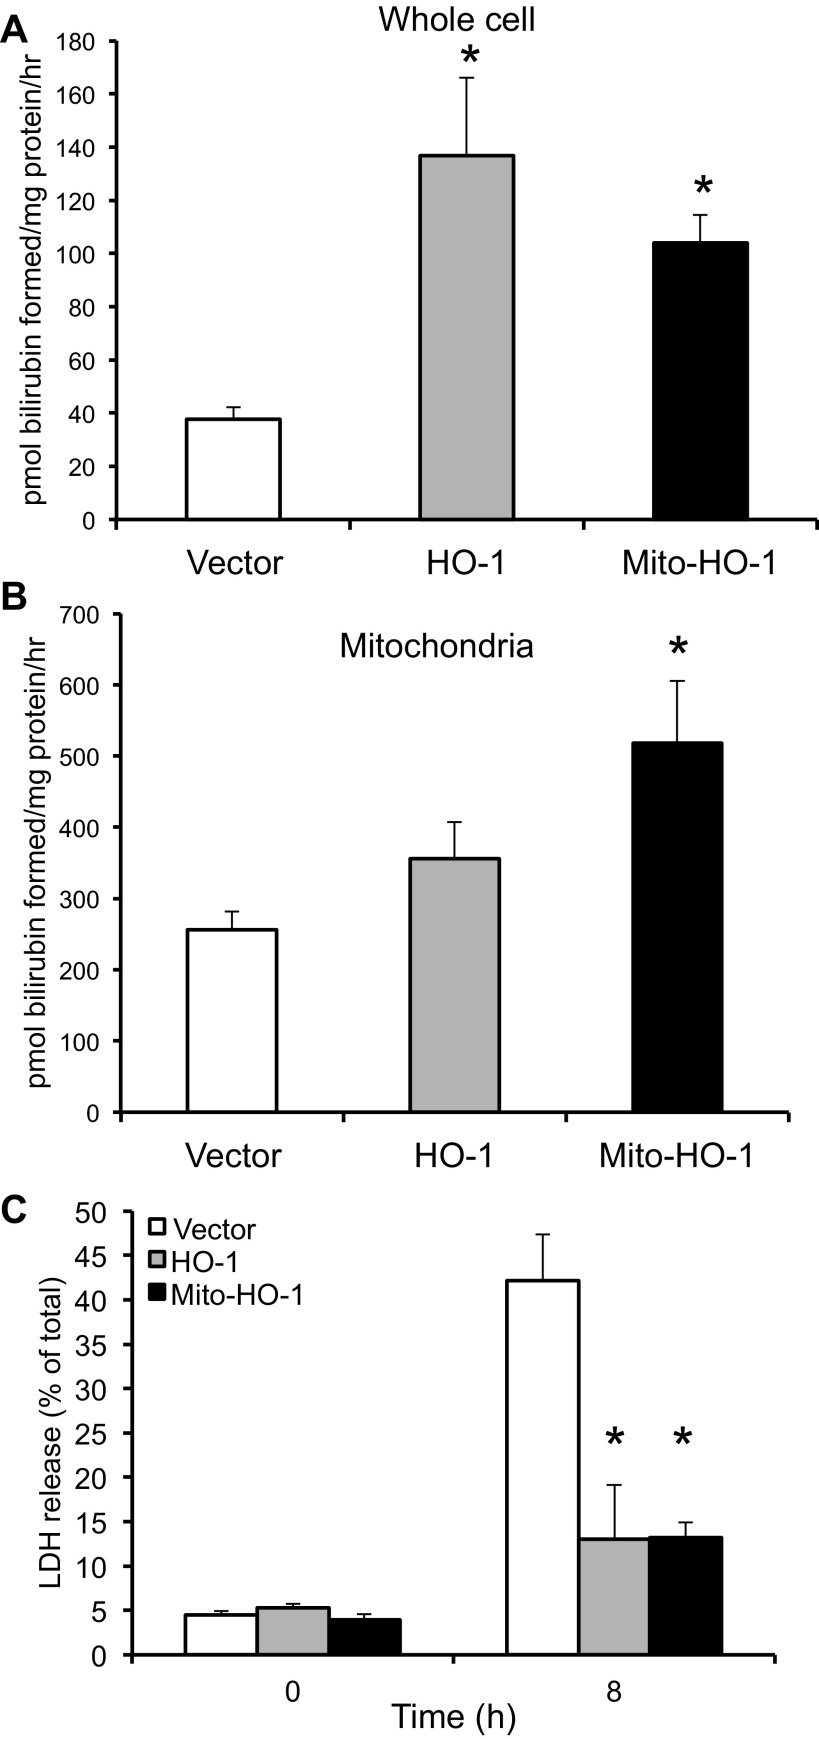
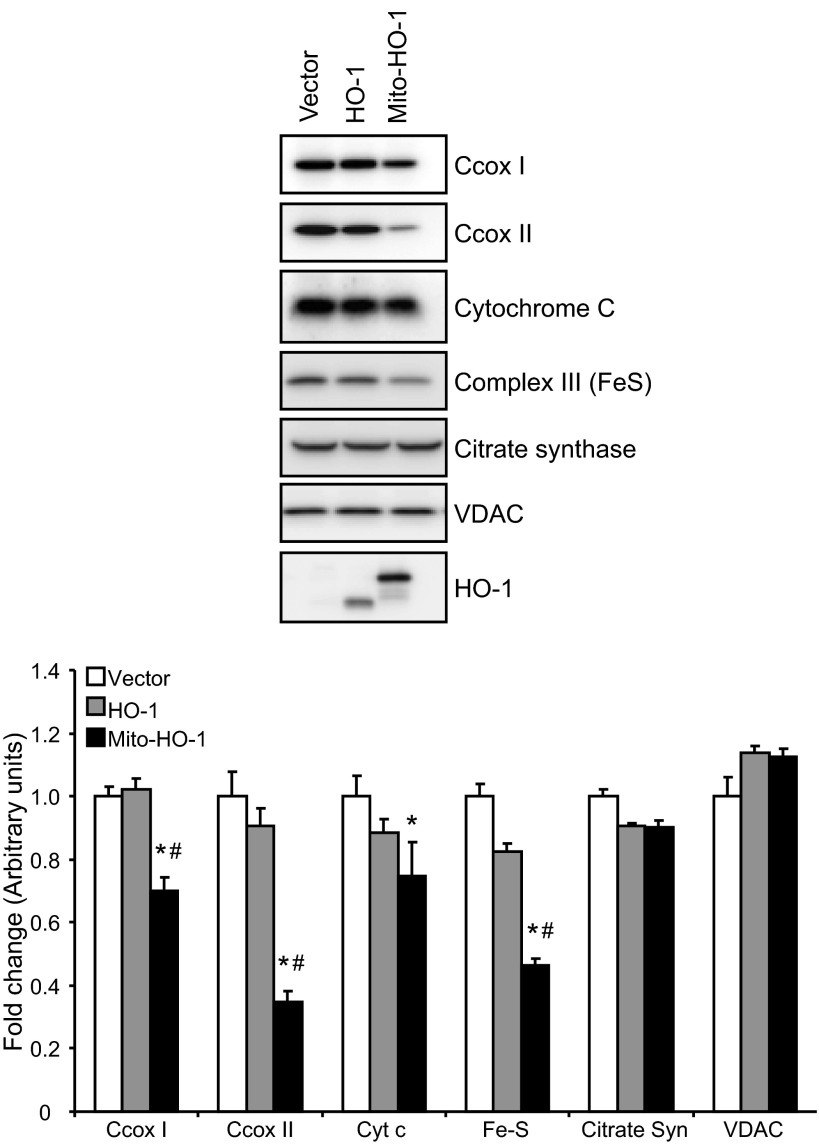
Localization of HO-1 in the mitochondria of Mito-HO-1 cells was confirmed by immunocytochemistry using Mitotracker Red and cytochrome c (Fig. 2, B and C). In contrast, no colocalization of HO-1 and mitochondria markers was found in nontargeted HO-1-overexpressing cells. As shown in Fig. 3A, a significant increase in HO enzyme activity from whole cell lysates of both HO-1 and Mito-HO-1 cells was observed. However, only Mito-HO-1 cells had a significant increase in HO activity in the mitochondrial fraction compared with Vector and HO-1 cells (Fig. 3B). Additionally, expression of heme proteins (cytochrome c, cytochrome c oxidase subunit I and II, complex III) in the mitochondria of Mito-HO-1 cells was significantly lower compared with HO-1 and vector cells (Fig. 4). However, as shown in Fig. 5, the basal OCR was not significantly different for vector, HO-1, and Mito-HO-1 cells, and the addition of inhibitors of the mitochondrial function did not alter any of the key bioenergetic parameters (Fig. 5A). These data indicate that targeting HO-1 to the mitochondria in these cells did not significantly alter the basal bioenergetic function compared with control cells. These data are consistent with the conclusion that the decrease in heme-containing proteins was not limiting for mitochondrial function (oxidative phosphorylation) in these cells, and this was confirmed by the fact that there was no change in glycolysis as measured by the ECAR with or without oligomycin (Fig. 5B).
Fig. 3.
Functional assessment of targeted HO-1 expression. A and B: HO activity was determined by measuring the amount of bilirubin formed per mg protein in whole cell lysates and mitochondria and expressed as pmol bilirubin formed per mg protein. *P < 0.05 compared with vector cells. C: cells were treated with 100 μM heme for 8 h, and %cytotoxicity was evaluated by measuring lactate dehydrogenase (LDH) release. *P < 0.01 compared with vector cells treated with hemin.
Fig. 4.
Expression of mitochondrial heme-containing proteins in the stable cells. Western blot analysis of Vector, HO-1, and Mito-HO-1 cell lysates for the expression of cytochrome c, cytochrome c oxidase subunit I and II (C cox), complex III, citrate synthase, and voltage-dependent anion channel. Densitometry was performed on two independent cell lysates and expressed as fold difference compared with vector cells. *P ≤ 0.05 vs. vector control; #P ≤ 0.05 vs. HO-1.
Fig. 5.
Bioenergetic function is not changed by targeting HO-1 to the mitochondrion. HEK293 from vector, HO-1, and Mito-HO-1 were seeded at 20,000 cells/well into specialized seahorse plates to determine oxygen consumption rate (OCR) and extracellular acidification rate (ECAR) simultaneously under normoxic conditions. Basal OCR was established, and then subsequent injections of oligomycin (O; 1 μg/ml), carbonyl cyanide 4-(trifluoromethoxy)phenylhydrazone (F; 1 μM), and antimycin-A (A; 10 μM) were made to determine the mitochondrial function (A) and ECAR profile (B) under the same conditions. Data were normalized to protein and represented as means ± SE, n = 6–7 experiments/group.
Functional assessment of site-targeted HO-1 expression.
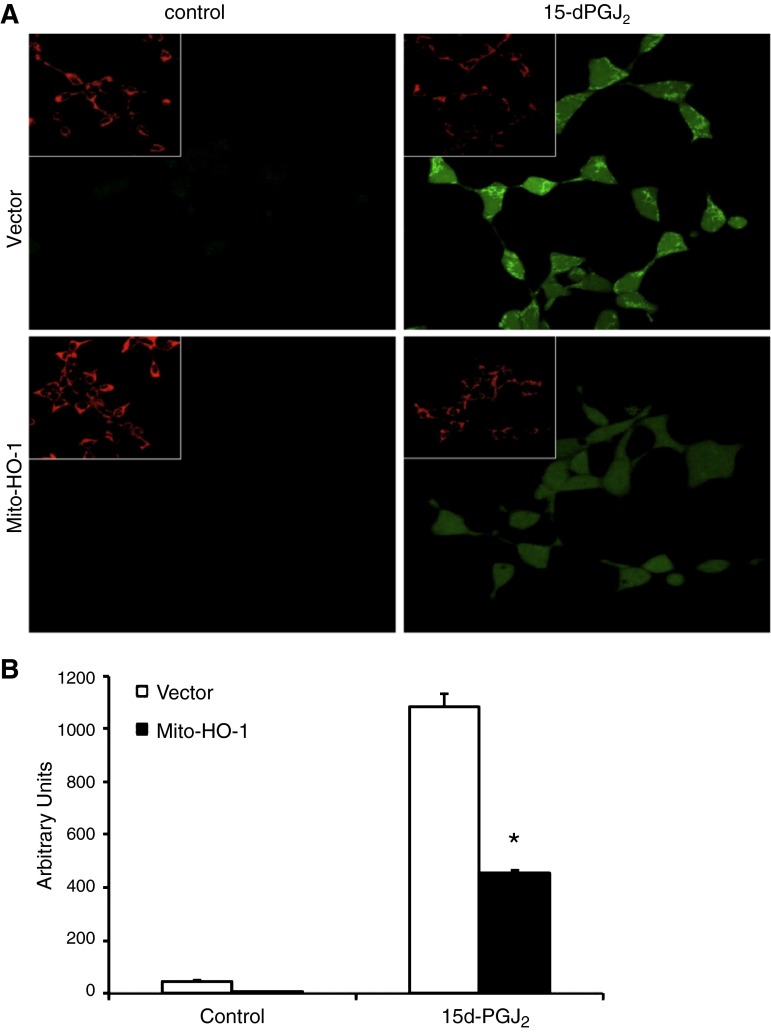
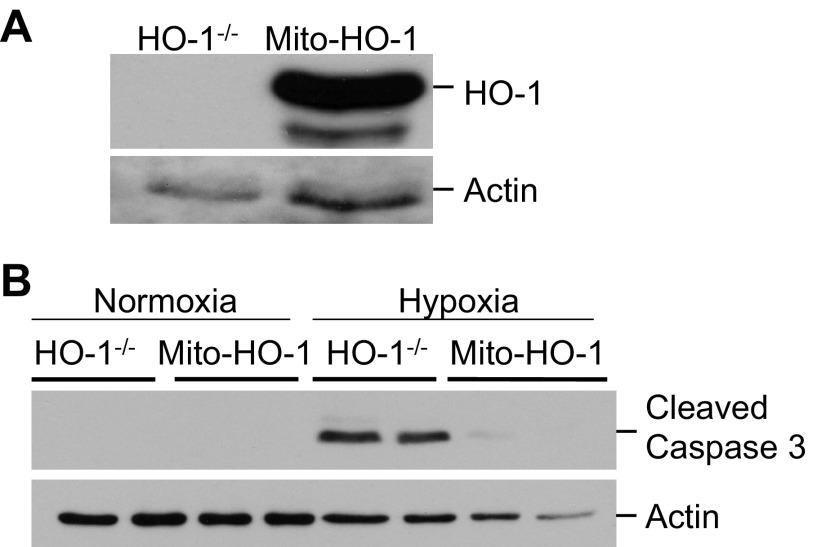
To further assess the function of the targeted HO-1 expression, cells were exposed to cytotoxic amounts of heme (100 μM), and cell viability was assessed using the LDH release assay. Both nontargeted and mitochondria-targeted HO-1-overexpressing cells were significantly protected against hemin cytotoxicity compared with Vector cells (Fig. 3C). Stable cells were treated with the pro-oxidant 15d-PGJ2, and ROS generation was measured by the DCF assay. Mito-HO-1 cells had a significant inhibition of ROS generation compared with Vector cells (Fig. 6). To preclude the effects of endogenous HO-1 in the stably transfected Mito-HO-1 cells, the Mito-HO-1 construct was transfected into renal proximal tubular cells generated from HO-1−/− mice (Fig. 7A). These cells were protected against hypoxia-mediated apoptosis compared with HO-1−/− cells, as evident by cleaved caspase 3 expression (Fig. 7B), confirming that the generated Mito-HO-1 protein was functional and provided protection in the absence of endogenous HO-1.
Fig. 6.
Mitochondria-targeted HO-1 overexpression inhibits ROS generation. Vector and Mito-HO-1 cells were treated with 15d-PGJ2 (10 μM) for 30 min, and mitochondria were labeled with Mitotracker Red. The fluorescent probe 2′,7′-dichlorodihydrofluorescein diacetate (H2DCF-DA) was added 1 h before imaging. Images were taken (A), blinded and quantitated for ROS generation (B). Mito-HO-1 cells had a significant decrease in ROS generation compared with vector cells. *P < 0.05 vs. 15d-PGJ2-treated vector cells.
Fig. 7.
Mitochondria-targeted HO-1 prevents apoptosis in HO-1-deficient cells. HO-1-deficient proximal tubular epithelial cells were transiently transfected with Mito-HO-1 plasmid. A: Western blot analysis to confirm the expression of targeted HO-1. B: Western blot analysis of cleaved caspase 3 expression in control and transfected HO-1-deficient cells following hypoxia.
Mito-HO-1 mitigates hypoxia-mediated mitochondrial injury and cell death.
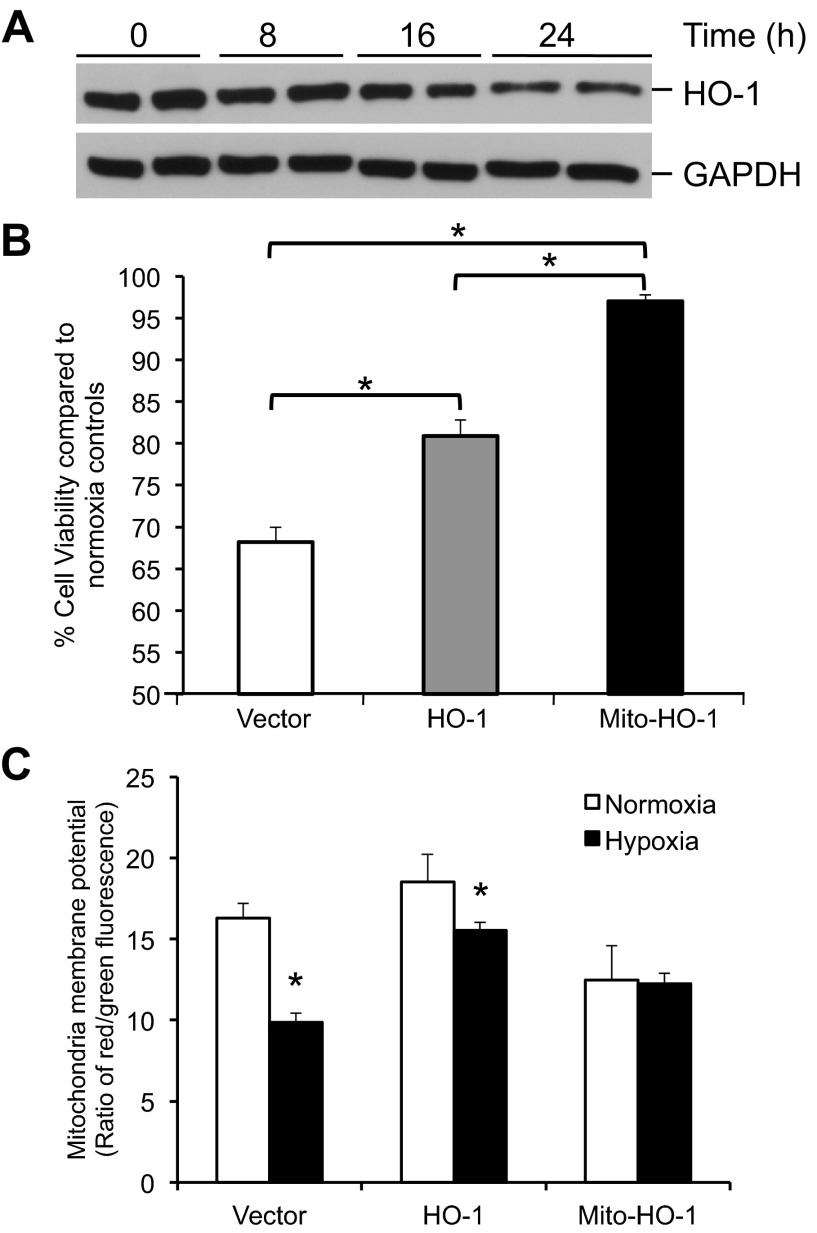
Hypoxia is a known stimulus for HO-1 expression in rodent cells. However, in human cells, hypoxia represses HO-1 expression and was confirmed in the human renal epithelial cells used in these studies (Fig. 8A) (30). Under hypoxic conditions, the Vector control showed a 30% decrease in viability that was partially attenuated by the cytosolic HO-1 (P < 0.05 vs. Vector) and essentially abrogated by the Mito-HO-1-expressing cells (P < 0.05 vs. Vector and HO-1) (Fig. 8B). Furthermore, hypoxia resulted in a significant decrease in the mitochondrial membrane potential that was substantially reversed by cytosolic and significantly reversed by Mito-HO-1 (P < 0.05 vs. normoxia) (Fig. 8C). Following hypoxia, pH of culture media from Vector cells decreased from 7.64 ± 0.08 to 7.3 ± 0.01 while pH of Mito-HO-1 culture media did not change (7.64 ± 0.09 to 7.58 ± 0.04).
Fig. 8.
Mitochondria-targeted HO-1 expression protects against hypoxic injury and cell death. Stable cells were incubated in normoxia or 1% oxygen (hypoxia). A: Western blot analysis of HO-1 expression in Vector cells exposed to hypoxia for indicated times. B: cell viability was measured using 3-[4,5-dimethylthiazol-2-yl]-2,5-diphenyltetrazolium bromide (MTT) assay and expressed as viability under hypoxic conditions compared with normoxia controls. *P < 0.05. C: mitochondrial membrane potential was measured following incubation in normoxia or hypoxia using 5,5′,6,6′-tetrachloro-1,1′,3,3′-tetraethylbenzimidazolylcarbocyanine iodide and is expressed as the ratio of red to green fluorescence. *P < 0.05 vs. normoxia controls.
Evaluation of aerobic and anaerobic pathways following hypoxia.
To evaluate the effects of Mito-HO-1 on intermediates of the TCA cycle (Fig. 9A), components of this pathway were measured by mass spectrometry. Both Vector and Mito-HO-1 cells demonstrated an increase in pyruvate following hypoxia (Fig. 9B), only Vector cells demonstrated a significant decrease in TCA cycle metabolites (citrate, isocitrate, fumarate, malate, α-ketoglutarate) (Fig. 9C). In contrast, Mito-HO-1 cells showed a preservation of the TCA cycle metabolites under hypoxic conditions.
Fig. 9.
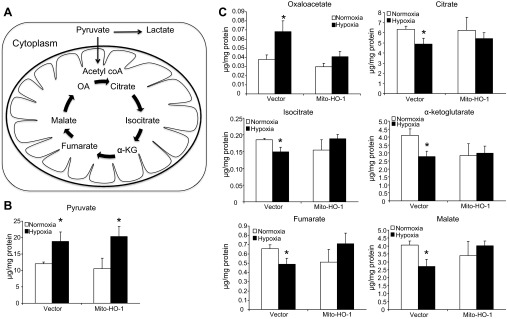
Analysis of aerobic and anaerobic metabolic pathways. A: schematic representation of glycolysis and tricarboxylic acid (TCA) cycle. Vector and Mito-HO-1 cells were incubated in normoxic or hypoxic conditions, and metabolites were analyzed. B and C: pyruvate (B) and TCA cycle metabolites (C). The results were normalized to protein content and expressed as μg/mg protein. OA, oxaloacetate; α-KG, α-ketoglutarate. *P ≤ 0.05 vs. normoxia.
DISCUSSION
Mitochondrial dysfunction is associated with several pathophysiological processes, including ischemia-reperfusion and nephrotoxic insults (1, 5, 18, 24, 28). During an oxidative insult, mitochondria generate significantly higher levels of ROS and thereby amplify oxidative stress (18, 28, 32). Given the relevance of ROS generation, mitochondrial dysfunction, and oxidative stress and the beneficial effects of HO-1 induction, we hypothesized that targeting HO-1 to the mitochondria will confer protection against oxidative injury. The present study assesses for the first time the effects of subcellular site-targeted HO-1 expression during hypoxic and oxidative stress.
Site-specific HO-1 overexpression in the mitochondria was achieved using the mitochondria targeting leader sequence from the MnSOD gene and human HO-1 cDNA (Mito-HO-1). In corroboration with previous findings, nontargeted HO-1 overexpression protected against heme cytotoxicity (2, 21). Interestingly, Mito-HO-1 cells also demonstrated significant resistance to heme-mediated cell death. These results not only provide functional evidence for this targeted protein but also highlight the involvement of mitochondria in heme-mediated cytotoxicity in kidney epithelial cells and the beneficial influence of HO-1 in this compartment. Although HO-1 was completely associated with the mitochondria in Mito-HO-1 cells (Fig. 2, B and C), not all of the targeted protein was processed and localized to the mitochondrial matrix (Fig. 2A), as indicated by the higher molecular weight (MW) band representing Mito-HO-1 with intact mitochondrial leader sequence. However, in isolated mitochondria, the unprocessed Mito-HO-1 was absent, indicating that it was not strongly associated with the mitochondrion. To distinguish the effects that are mediated by mitochondrially localized HO-1, we also overexpressed cytosolic HO-1 and attribute effects that are unique to Mito-HO-1 to the impact of mitochondrial localization of the enzyme. In addition, we noted that the processed Mito-HO1 migrated at slightly higher MW than native HO-1 (Fig. 2). We do not know the reason for this effect, but it could be because of the effects of the intramitochondrial processing of the protein or posttranslational modification.
Free heme is a potent pro-oxidant capable of damaging multiple cellular components such as membrane lipids, proteins, and DNA (16, 20, 21, 36). In addition, oxidative stress and mitochondrial dysfunction contribute to increased heme in the cell during injury (33). Previous studies have demonstrated the protective effects of HO-1 expression that translocates to the mitochondria during hemin and cigarette smoke extract injury (6, 31). Converso et al. demonstrated that HO-1 expression in liver mitochondria resulted in a significant decrease in nitric oxide-mediated hydrogen peroxide production which could be attributed to reduced expression and activity of heme-dependent proteins, cytochrome oxidase and nitric oxide synthase (6). In corroboration with these studies, we demonstrated that Mito-HO-1 cells had significantly decreased levels of mitochondrial heme-containing proteins, including cytochrome c oxidase subunit I and II and complex III. Interestingly, recent studies have shown that complex III is responsible for controlled superoxide generation and contributes to retrograde signaling, particularly under conditions of hypoxic stress (37, 38). In this context, it is important to note that the absence of an endogenous mitochondrially located HO in biology may be related to these potentially negative effects on mitochondrial heme proteins and ROS-dependent mitochondrial retrograde signaling. In the HEK cells used in this study, the decrease in the expression of mitochondrial heme proteins did not adversely affect mitochondrial function or glycolysis flux. Compared with many other cell types with higher energetic demand, such as hepatocytes or cardiomyocytes, the HEK cells do not appear to possess a robust oxidative phosphorylation system and are more glycolytic. It is therefore possible that mitochondrial-localized HO-1 in a highly energetic cell could compromise bioenergetic function because of the potential for heme depletion.
In conjunction with heme-mediated oxidative stress, dysregulated ROS generation by mitochondria is also implicated in a variety of diseases, including acute kidney injury, atherosclerosis, cancer, and neurodegenerative disorders, such as Parkinson's disease (1, 7, 20, 28, 35). The mitochondrion senses and coordinates retrograded signaling by oxidized lipids, and our findings indicating that mitochondria-targeted HO-1 expression significantly inhibits ROS generation in the presence of the electrophilic lipid signaling molecule 15d-PGJ2 compared with control cells suggests heme-dependent processes may be involved in these signaling pathways (8, 10, 27). Moreover, during hypoxia-mediated injury, mitochondrial membrane potential is reduced, leading to leakage of ROS and pro-apoptotic factors such as cytochrome c and apoptosis-inducing factor-1 (13). Therefore, it is imperative to maintain the mitochondrial membrane potential to prevent cellular dysfunction, activation of mitophagy, and apoptosis (12). We hereby demonstrate that Mito-HO-1 significantly blunted the loss of membrane potential and decreased cell death following hypoxia, compared with control vector cells. Interestingly, although not significant, overexpression of cytosolic HO-1 was also associated with a less-pronounced effect on mitochondrial membrane potential and viability than Mito-HO-1. More importantly, proximal tubular cells from HO-1-deficient mice were cultured and transfected with the mitochondria-targeted HO-1 construct. Following hypoxia, these cells had decreased levels of cleaved caspase 3 expression compared with HO-1-deficient cells, validating the functionality of the mitochondria-targeted HO-1 protein and its role in protection against hypoxia-mediated apoptosis. Taken together, these data suggest that hypoxia-induced apoptotic cascade is predominantly dependent on mitochondria and may involve free heme-associated processes.
In addition to protecting cells from oxidative stress and apoptosis, we present evidence to suggest that HO-1 preserves mitochondrial function and metabolism during acute stress. This is evident from the mitigation of loss of membrane potential and apoptosis in these cells, accompanied by modulation of the levels of the TCA cycle intermediates. Appropriate functioning of the TCA cycle under conditions of bioenergetic stress is important since many of the metabolic intermediates, such as the α-keto acids (e.g., α-ketoglutarate), can have both important signaling functions and may also contribute to antioxidant defenses (15, 17, 29, 38). A more detailed flux analysis is required to define precisely which enzymes in the TCA cycle are modulated by the targeting of HO-1 to the mitochondrion.
It is now established that adaptation to hypoxia is a dynamic process, requiring stabilization of hypoxia-inducible factor 1 (HIF-1) and activation of genes encoding glucose transport and glycolytic enzymes while inhibiting the TCA cycle through conversion of pyruvate to lactate (14). HIF-1 stabilization and regulation depends on the decreased levels of oxygen, iron, and α-ketoglutarate and increased ROS generation (25). It is therefore plausible that increased HO-1 expression in the mitochondria may decrease HIF-1 levels through decreased production of ROS or increased iron through breakdown of heme. We also demonstrate that α-ketoglutarate levels did not reduce following hypoxia, hence preserving its signaling and antioxidant potential. In addition, it has been previously demonstrated that ROS can inhibit TCA cycle enzymes; therefore, HO-1 may prevent such modifications through its antioxidant activity (34). Taken together, these data extend our understanding of the emerging interaction between mitochondrial function and HO-1 that has previously been reported to involve regulation of mitochondrial biogenesis and the endogenous antioxidant Keap1/Nrf2 pathway (22, 27). Our study suggests that HO-1 targeted to the mitochondria protects against acute stress through several mechanisms. First, HO-1 prevents excessive heme accumulation and ROS generation during the oxidative insult. Second, HO-1 preserves the mitochondrial membrane potential and TCA cycle intermediates. Third, HO-1 prevents the release of apoptotic factors and downstream activation of the apoptotic cascade. These results underscore the beneficial potential of mitochondria-targeted HO-1 expression in renal epithelial cells during acute stress. However, as mentioned above, the effects on heme-containing enzymes in the respiratory chain would likely be deleterious in the long term. Interestingly, a viable biological strategy could be transient targeting of HO-1 to the mitochondria under conditions of stress, and this has indeed been reported (6). In summary, transient targeting of HO-1 to the mitochondria could enhance the effectiveness of future therapeutics in disease processes where excessive ROS generation and mitochondria dysfunction play a central role in the progression of the disease.
GRANTS
This work was supported by National Institutes of Health Grants R01-DK-59600 (to A. Agarwal) and HL-096638 (to A. Landar), P30-DK-079337 O'Brien Core Center for acute kidney injury research (to A. Agarwal), Department of Veterans Affairs Grant 1 IP1 BX001595 (to A. Agarwal), UCDC DRC BARB Core P60-DK-079626, and American Heart Association postdoctoral fellowship award 11POST7600074 (to S. Bolisetty).
DISCLOSURES
No conflicts of interest, financial or otherwise, are declared by the authors.
AUTHOR CONTRIBUTIONS
Author contributions: S. Bolisetty, A.L., V.M.D.-U., and A.A. conception and design of research; S. Bolisetty, A.M.T., A.Z., M.S.J., G.A.B., K.R., R.B., and R.D.M. performed experiments; S. Bolisetty, A.M.T., G.A.B., K.R., R.B., R.D.M., A.L., S. Barnes, V.M.D.-U., and A.A. analyzed data; S. Bolisetty, A.M.T., A.Z., M.S.J., G.A.B., K.R., S. Barnes, V.M.D.-U., and A.A. interpreted results of experiments; S. Bolisetty prepared figures; S. Bolisetty and A.M.T. drafted manuscript; S. Bolisetty, A.Z., A.L., V.M.D.-U., and A.A. edited and revised manuscript; S. Bolisetty, A.M.T., A.Z., M.S.J., G.A.B., K.R., R.B., R.D.M., A.L., S. Barnes, V.M.D.-U., and A.A. approved final version of manuscript.
ACKNOWLEDGMENTS
The custom-built drill press was designed and built by Carlos L. Krumdieck and Douglas R. Moellering following a modification of the method of Rasmussen et al. (26).
REFERENCES
- 1. Baliga R, Ueda N, Walker PD, Shah SV. Oxidant mechanisms in toxic acute renal failure. Drug Metab Rev 31: 971–997, 1999 [DOI] [PubMed] [Google Scholar]
- 2. Bolisetty S, Traylor AM, Kim J, Joseph R, Ricart K, Landar A, Agarwal A. Heme oxygenase-1 inhibits renal tubular macroautophagy in acute kidney injury. J Am Soc Nephrol 21: 1702–1712, 2010 [DOI] [PMC free article] [PubMed] [Google Scholar]
- 3. Brookes P, Darley-Usmar VM. Hypothesis: the mitochondrial NO(*) signaling pathway, and the transduction of nitrosative to oxidative cell signals: an alternative function for cytochrome C oxidase. Free Radic Biol Med 32: 370–374, 2002 [DOI] [PubMed] [Google Scholar]
- 4. Brookes PS, Levonen AL, Shiva S, Sarti P, Darley-Usmar VM. Mitochondria: regulators of signal transduction by reactive oxygen and nitrogen species. Free Radic Biol Med 33: 755–764, 2002 [DOI] [PubMed] [Google Scholar]
- 5. Brooks C, Wei Q, Cho SG, Dong Z. Regulation of mitochondrial dynamics in acute kidney injury in cell culture and rodent models. J Clin Invest 119: 1275–1285, 2009 [DOI] [PMC free article] [PubMed] [Google Scholar]
- 6. Converso DP, Taille C, Carreras MC, Jaitovich A, Poderoso JJ, Boczkowski J. HO-1 is located in liver mitochondria and modulates mitochondrial heme content and metabolism. FASEB J 20: 1236–1238, 2006 [DOI] [PubMed] [Google Scholar]
- 7. de Moura MB, dos Santos LS, Van Houten B. Mitochondrial dysfunction in neurodegenerative diseases and cancer. Environ Mol Mutagen 51: 391–405, 2010 [DOI] [PubMed] [Google Scholar]
- 8. Diers AR, Higdon AN, Ricart KC, Johnson MS, Agarwal A, Kalyanaraman B, Landar A, Darley-Usmar VM. Mitochondrial targeting of the electrophilic lipid 15-deoxy-Delta12,14-prostaglandin J2 increases apoptotic efficacy via redox cell signalling mechanisms. Biochem J 426: 31–41, 2010 [DOI] [PMC free article] [PubMed] [Google Scholar]
- 9. Dranka BP, Benavides GA, Diers AR, Giordano S, Zelickson BR, Reily C, Zou L, Chatham JC, Hill BG, Zhang J, Landar A, Darley-Usmar VM. Assessing bioenergetic function in response to oxidative stress by metabolic profiling. Free Radic Biol Med 51: 1621–1635, 2011 [DOI] [PMC free article] [PubMed] [Google Scholar]
- 10. Higdon A, Diers AR, Oh JY, Landar A, Darley-Usmar VM. Cell signalling by reactive lipid species: new concepts and molecular mechanisms. Biochem J 442: 453–464, 2012 [DOI] [PMC free article] [PubMed] [Google Scholar]
- 11. Higdon AN, Benavides GA, Chacko BK, Ouyang X, Johnson MS, Landar A, Zhang J, Darley-Usmar VM. Hemin causes mitochondrial dysfunction in endothelial cells through promoting lipid peroxidation: the protective role of autophagy. Am J Physiol Heart Circ Physiol 302: H1394–H1409, 2012 [DOI] [PMC free article] [PubMed] [Google Scholar]
- 12. Hill BG, Benavides GA, Lancaster JR, Ballinger S, Dell'italia L, Zhang J, Darley-Usmar VM. Integration of cellular bioenergetics with mitochondrial quality control and autophagy. Biol Chem 393: 1485–1512, 2012 [DOI] [PMC free article] [PubMed] [Google Scholar]
- 13. Kaushal GP, Basnakian AG, Shah SV. Apoptotic pathways in ischemic acute renal failure. Kidney Int 66: 500–506, 2004 [DOI] [PubMed] [Google Scholar]
- 14. Kim JW, Tchernyshyov I, Semenza GL, Dang CV. HIF-1-mediated expression of pyruvate dehydrogenase kinase: a metabolic switch required for cellular adaptation to hypoxia. Cell Metab 3: 177–185, 2006 [DOI] [PubMed] [Google Scholar]
- 15. Knerr I, Weinhold N, Vockley J, Gibson KM. Advances and challenges in the treatment of branched-chain amino/keto acid metabolic defects. J Inherit Metab Dis 35: 29–40, 2012 [DOI] [PMC free article] [PubMed] [Google Scholar]
- 16. Kumar S, Bandyopadhyay U. Free heme toxicity and its detoxification systems in human. Toxicol Lett 157: 175–188, 2005 [DOI] [PubMed] [Google Scholar]
- 17. Mailloux RJ, Beriault R, Lemire J, Singh R, Chenier DR, Hamel RD, Appanna VD. The tricarboxylic acid cycle, an ancient metabolic network with a novel twist. PLoS One 2: e690, 2007 [DOI] [PMC free article] [PubMed] [Google Scholar]
- 18. Mukhopadhyay P, Horvath B, Zsengeller Z, Zielonka J, Tanchian G, Holovac E, Kechrid M, Patel V, Stillman IE, Parikh SM, Joseph J, Kalyanaraman B, Pacher P. Mitochondrial-targeted antioxidants represent a promising approach for prevention of cisplatin-induced nephropathy. Free Radic Biol Med 52: 497–506, 2012 [DOI] [PMC free article] [PubMed] [Google Scholar]
- 19. Murphy MP. Mitochondrial thiols in antioxidant protection and redox signaling: distinct roles for glutathionylation and other thiol modifications. Antioxid Redox Signal 16: 476–495, 2012 [DOI] [PubMed] [Google Scholar]
- 20. Nath KA. Heme oxygenase-1: a provenance for cytoprotective pathways in the kidney and other tissues. Kidney Int 70: 432–443, 2006 [DOI] [PubMed] [Google Scholar]
- 21. Nath KA, Haggard JJ, Croatt AJ, Grande JP, Poss KD, Alam J. The indispensability of heme oxygenase-1 in protecting against acute heme protein-induced toxicity in vivo. Am J Pathol 156: 1527–1535, 2000 [DOI] [PMC free article] [PubMed] [Google Scholar]
- 22. Piantadosi CA, Carraway MS, Babiker A, Suliman HB. Heme oxygenase-1 regulates cardiac mitochondrial biogenesis via Nrf2-mediated transcriptional control of nuclear respiratory factor-1. Circ Res 103: 1232–1240, 2008 [DOI] [PMC free article] [PubMed] [Google Scholar]
- 23. Piantadosi CA, Suliman HB. Redox regulation of mitochondrial biogenesis. Free Radic Biol Med 53: 2043–2053, 2012 [DOI] [PMC free article] [PubMed] [Google Scholar]
- 24. Plotnikov EY, Kazachenko AV, Vyssokikh MY, Vasileva AK, Tcvirkun DV, Isaev NK, Kirpatovsky VI, Zorov DB. The role of mitochondria in oxidative and nitrosative stress during ischemia/reperfusion in the rat kidney. Kidney Int 72: 1493–1502, 2007 [DOI] [PubMed] [Google Scholar]
- 25. Raimundo N, Baysal BE, Shadel GS. Revisiting the TCA cycle: signaling to tumor formation. Trends Mol Med 17: 641–649, 2011 [DOI] [PMC free article] [PubMed] [Google Scholar]
- 26. Rasmussen HN, Andersen AJ, Rasmussen UF. Optimization of preparation of mitochondria from 25–100 mg skeletal muscle. Anal Biochem 252: 153–159, 1997 [DOI] [PubMed] [Google Scholar]
- 27. Ricart KC, Bolisetty S, Johnson MS, Perez J, Agarwal A, Murphy MP, Landar A. The permissive role of mitochondria in the induction of haem oxygenase-1 in endothelial cells. Biochem J 419: 427–436, 2009 [DOI] [PMC free article] [PubMed] [Google Scholar]
- 28. Santos NA, Catao CS, Martins NM, Curti C, Bianchi ML, Santos AC. Cisplatin-induced nephrotoxicity is associated with oxidative stress, redox state unbalance, impairment of energetic metabolism and apoptosis in rat kidney mitochondria. Arch Toxicol 81: 495–504, 2007 [DOI] [PubMed] [Google Scholar]
- 29. Schumacker PT. Lung cell hypoxia: role of mitochondrial reactive oxygen species signaling in triggering responses. Proc Am Thorac Soc 8: 477–484, 2011 [DOI] [PMC free article] [PubMed] [Google Scholar]
- 30. Shibahara S, Han F, Li B, Takeda K. Hypoxia and heme oxygenases: oxygen sensing and regulation of expression. Antioxid Redox Signal 9: 2209–2225, 2007 [DOI] [PubMed] [Google Scholar]
- 31. Slebos DJ, Ryter SW, van der Toorn M, Liu F, Guo F, Baty CJ, Karlsson JM, Watkins SC, Kim HP, Wang X, Lee JS, Postma DS, Kauffman HF, Choi AM. Mitochondrial localization and function of heme oxygenase-1 in cigarette smoke-induced cell death. Am J Respir Cell Mol Biol 36: 409–417, 2007 [DOI] [PMC free article] [PubMed] [Google Scholar] [Retracted]
- 32. Szeto HH, Liu S, Soong Y, Wu D, Darrah SF, Cheng FY, Zhao Z, Ganger M, Tow CY, Seshan SV. Mitochondria-targeted peptide accelerates ATP recovery and reduces ischemic kidney injury. J Am Soc Nephrol 22: 1041–1052, 2011 [DOI] [PMC free article] [PubMed] [Google Scholar]
- 33. Tracz MJ, Alam J, Nath KA. Physiology and pathophysiology of heme: implications for kidney disease. J Am Soc Nephrol 18: 414–420, 2007 [DOI] [PubMed] [Google Scholar]
- 34. Tretter L, Adam-Vizi V. Inhibition of Krebs cycle enzymes by hydrogen peroxide: a key role of [alpha]-ketoglutarate dehydrogenase in limiting NADH production under oxidative stress. J Neurosci 20: 8972–8979, 2000 [DOI] [PMC free article] [PubMed] [Google Scholar]
- 35. Victor VM, Apostolova N, Herance R, Hernandez-Mijares A, Rocha M. Oxidative stress and mitochondrial dysfunction in atherosclerosis: mitochondria-targeted antioxidants as potential therapy. Curr Med Chem 16: 4654–4667, 2009 [DOI] [PubMed] [Google Scholar]
- 36. Vincent SH. Oxidative effects of heme and porphyrins on proteins and lipids. Semin Hematol 26: 105–113, 1989 [PubMed] [Google Scholar]
- 37. Viola HM, Hool LC. Qo site of mitochondrial complex III is the source of increased superoxide after transient exposure to hydrogen peroxide. J Mol Cell Cardiol 49: 875–885, 2010 [DOI] [PubMed] [Google Scholar]
- 38. Wheaton WW, Chandel NS. Hypoxia. II. Hypoxia regulates cellular metabolism. Am J Physiol Cell Physiol 300: C385–C393, 2011 [DOI] [PMC free article] [PubMed] [Google Scholar]


