

Abstract
In a screen for genes expressed specifically in gastric mucous neck cells, we identified GKN3, the recently discovered third member of the gastrokine family. We present confirmatory mouse data and novel porcine data showing that mouse GKN3 expression is confined to mucous cells of the corpus neck and antrum base and is prominently expressed in metaplastic lesions. GKN3 was proposed originally to be expressed in some human populations and a pseudogene in others. To investigate that hypothesis, we studied human GKN3 evolution in the context of its paralogous genomic neighbors, GKN1 and GKN2. Haplotype analysis revealed that GKN3 mimics GKN2 in patterns of exonic SNP allocation, whereas GKN1 appeared to be more stringently selected. GKN3 showed signatures of both directional selection and population based selective sweeps in humans. One such selective sweep includes SNP rs10187256, originally identified as an ancestral tryptophan to premature STOP codon mutation. The derived (nonancestral) allele went to fixation in Asia. We show that another SNP, rs75578132, identified 5 bp downstream of rs10187256, exhibits a second selective sweep in almost all Europeans, some Latinos, and some Africans, possibly resulting from a reintroduction of European genes during African colonization. Finally, we identify a mutation that would destroy the splice donor site in the putative exon3-intron3 boundary, which occurs in all human genomes examined to date. Our results highlight a stomach-specific human genetic locus, which has undergone various selective sweeps across European, Asian, and African populations and thus reflects geographic and ethnic patterns in genome evolution.
Keywords: 1000 Genomes data, population genetics, BRICHOS domain, selective sweeps
gene families are clusters of paralogous genes, thought to arise through gene duplication events. Gene duplication events can rapidly induce variation and are thus considered a driving force in evolution. Tandem gene duplications result in clusters of paralogous genes that, upon mutation, can lead to differences in function among the resulting paralogs. One such gene cluster arose with expression specific to the gastric mucosa.
The gastrokine (GKN) genes are part of the BRICHOS superfamily of genes; so named for the ∼100 bp domain shared by a handful of genes in the mammalian genome, three of which are associated with disease in humans: BRI2 (dementia), chondromodulin (aka, LECT-1, chondrosarcoma), and prosurfactant protein C (respiratory and lung disease) (BRICHOS) (40, 54). Despite some degree of variance in sequence, protein patterning and secondary structure are thought to be conserved among BRICHOS family members. One possible function of the domain is to bind to proteins that form beta-sheets and disrupt their potential for forming insoluble amyloid (54).
Gastrokine 1 (GKN1), aka CA11 and AMP-18, is a ∼18 kDa protein that is largely stomach specific and secreted by the mucous pit cells along the surface of both corporal and antral gastric units (23, 30, 57). GKN1 was originally discovered in a screen for genes downregulated in gastric cancer. GKN1 is expressed in normal mucosa, as well as in lesions such as gastritis and metaplasia. It is largely not expressed in gastric carcinoma, and it is not expressed in the lesion intestinal metaplasia (30), wherein gastric mucosa aberrantly assumes an intestinal differentiation pattern. Overexpression of GKN1 in vitro induces MET (mesenchymal to epithelial transition), senescence, and apoptosis (22, 30, 37, 56). Gastrokine 2 (GKN2), also known as GDDR, TFIZI, and Blotten, is also downregulated in gastric cancer (9, 26, 52). GKN2 differs from GKN1 in part by its ability to covalently bind TFF1 via a cysteine bond residue C38 and thus inhibit the growth of cancer cells (7, 19, 52). GKN2 has been reported to noncovalently interact with TFF2 in mouse stomach tissue, but this does not appear to occur in human antral tissue (19, 32, 33). Like GKN1 and TFF1, GKN2 is expressed in surface pit cells in both the corpus and antrum and thought to be secreted (19, 32, 52). In contrast, TFF2 is expressed in the mucous neck region of corporal units and in the base of antral units, suggesting any interactions with GKN2 would occur in the gastric lumen (19, 29).
The most recently discovered GKN is gastrokine 3 (GKN3) (25). GKN3 has a stomach-specific expression pattern and is expressed at relatively higher levels in cells during the gastric atrophy that occurs, for example, during infection with Helicobacter pylori. Interestingly, a nonsense mutation in GKN3 exon 3 was found to have a high frequency in non-African populations, hinting at population-specific patterns of positive selection favoring nonfunctionality (25). However, this gene's evolution, patterns of expression, and function in humans, if any, have not been examined. Here, we independently verify previous findings and further characterize this gene and its paralogs by a range of molecular and computational methods. Specifically, a deeper investigation of its evolutionary history was performed, via an extensive search for homologous genes from multiple species' genomes and concomitant phylogenetic analysis of the resulting hits. To complement this interspecific analysis, a more thorough population genetic analysis was performed to test hypotheses of nonneutral evolution, across loci and human populations. We combine these results with updated interrogations of its gene expression using multiple approaches including RNA-Seq.
METHODS
Human and animal samples.
Tissue was isolated from 22 deidentified paraffin blocks of both gastric biopsies and resections obtained from the Lauren V. Ackerman Laboratory of Surgical Pathology at Barnes-Jewish Hospital (Washington University Medical Center, St. Louis, MO). Isolated DNA and RNA samples from both malignant and normal tissue from 10 deidentified patients were obtained from the Alvin J. Siteman Cancer Center Tissue Procurement Core (Washington University Medical Center, St. Louis, MO). Fresh gastric tissue from two resections was obtained in St. Louis for frozen or paraffin blocks and in Nicaragua for RNA-Seq. All protocols involving human tissue were approved by the institutional review board at Washington University School of Medicine, the Comité de Bioetica of Nicaragua for Universidad Nacional Autonoma De Nicaragua — Facultad De Ceincias Medicas Managua, and the Research Ethics Board Manager for Health Sciences at the University of Toronto.
All experiments with animals were performed according to protocols approved by the Washington University Animal Studies Committee. Fresh pig gastric tissue was from two Landrace cross pigs of 2–5 mo of age (Oak Hill Genetics). The gastric tissue from rhesus macaques was obtained, post mortem, from the Snyder and Perlmutter labs, Washington University.
Mice were housed in a pathogen-free barrier facility under a 12 h light cycle, fed a standard commercial mouse diet (Purina), and allowed full access to food and water. Stomach tissue samples were collected from C57BL/6 mice (The Jackson Laboratory, Bar Harbor, ME). To induce metaplasia, mice were injected (intraperitoneally) with tamoxifen (5 mg/20 g mouse body wt) for 3 consecutive days and killed on the 4th day (15).
Laser capture microscopy and microarray screen.
Laser capture microscopy (LCM), RNA isolation, GeneChip hybridization, and bioinformatic analysis for the neck cell GeneChips were all preformed as described in Ramsey et al. (36). The heat maps were constructed first by determining those genes with highest fold difference between mucous neck cells and other gastric cell lineage gene expression profiles using dChip software (21). Second, the expression profiles for this list of highly neck cell-specific genes were analyzed for stomach specificity vs. MOE430v2.0 GeneChips of diverse organs, a gift from Kenneth Murphy (Washington University School of Medicine; GEO accession, GDS3052).
Human genotyping.
Human genotyping for single nucleotide polymorphism (SNP) rs10187256 was conducted via restriction digest of PCR products. Human DNA was isolated from archived paraffin blocks following protocols from the DNeasy Blood and Tissue Kit (Qiagen). Standard PCR was performed using Red taq (Sigma) and the following primers: forward, GCATGGGCAAAGTAGGAACTCTGAAC; reverse, GTGCATGCCCATCAAGGACCTAAAC.
The resulting 324 bp region was then cut using BsmF1: 2 μl of enzyme solution [NEB #4 stock solution (1× New England BioLabs restriction buffer #4, 1× BSA, in dH2O) + 14% BsmF1] per 10 μl dirty PCR product, at 65°C for ∼1 h. The resulting band was excised from a 2% agarose gel, and genotyping accuracy confirmed via Sanger Sequencing using ABI Big Dye V3.1 (Applied Biosystems, Protein and Nucleic Acid Chemistry Laboratory, Washington University in St. Louis).
RNA isolation and cDNA synthesis.
RNA was isolated from frozen human tissue slices via NucleoSpin RNA II (Macherey-Nagel) from frozen sections that had been immediately placed in buffer RA1 and then frozen. cDNA was synthesized using Superscript III (Invitrogen) with random primers. RT-PCR reactions were done to detect GKN3 as well as the following controls: TFF2, GKN1, Gastrin, and 18S (data not shown).
Antibody generation.
To localize GKN3, we generated three separate polyclonal antibodies. The first GKN3-94 was raised against a murine GKN3 peptide (NTSDSYPLDGSVGTQ) from the third exon where similarity to paralogous gastrokines is minimal coupled to KLH (Keyhole Limpet Hemocyanin) in New Zealand White Rabbits (Sigma Genosys). The second two were raised against a Hys-tagged RFP::GKN3 fusion protein, with full-length murine GKN3. GKN3–236 was raised in chicken egg IgY (Genetel Laboratories), and GKN3-85 was raised in New Zealand White Rabbits (Pacific Immunology).
Immunofluorescence staining.
Tissue for immunofluorescence staining was prepared and stained by modified methods described in Ramsey et al. (36). Tissues were immediately fixed in either methacarn (60% MeOH, 30% chloroform, 10% acetic acid) or 10% formalin (37% formalin diluted to 4% in PBS) and embedded in either paraffin or frozen in OCT embedding compound (Sakura Finetek). Primary antibodies used were GKN3-94 (1:200), GKN3-236 (1:10,000), GKN3-85 (1:1,500), goat anti-GIF (1:2,000) (gift from Dr. David Alpers, Washington University), sheep anti-PepsinogenC (1:10,000 from Abcam). Secondary antibodies included AlexaFluor (488, 594, and 647) conjugated donkey anti-goat, anti-rabbit, anti-chicken, anti-sheep (Jackson or Molecular Probes); Alexafluor 594 conjugated Griffonia simplificolia (GS-II) lectin was used to detect neck cells (36).
Phylogenetic tree construction.
The cladogram in Fig. 2 was arranged according to taxonomy at NCBI (National Center for Biotechnology Information, U.S. National Library of Medicine; http://www.ncbi.nlm.nih.gov/), (http://www.ncbi.nlm.nih.gov/taxonomy/). GKN locus clustering for the different species was compiled from data from NCBI, UCSC (University of Santa Cruz Genome Bioinformatics group, http://genome.ucsc.edu/), Ensembl and Pre-Ensembl (European Bioinformatics Institute and Sanger Welcome Trust; http://www.ensembl.org/index.html, http://pre.ensembl.org/index.html), and UniProt (Universal Protein Resource, European Bioinformatics Institute, the SIB Swiss Institute of Bioinformatics, and the Protein Information Resource; http://www.uniprot.org/).
Fig. 2.

Gkn3 is within the gastrokine gene cluster, whose location and orientation are evolutionarily conserved. The gastrokine locus occurs as a cluster of conserved, paralogs, located between Antxr1 and Bmp10 as represented in the mouse (A). Gkn1 is closest to Antxr1, ∼38.5 kb away. Then ∼28 kb downstream is Gkn2, encoded on the opposite strand, followed by Gkn3, ∼18 kb downstream, in the same orientation as Gkn1. Gkn3 is ∼49.5 kb away from Bmp10, which is in the same orientation as Gkn2. This locus of multiple gastrokine paralogs is conserved from mammals to coelacanths, suggesting its origin in a fish common ancestor (B). The number (3) and location of the gastrokines, as well as their orientation, are largely conserved in all mammals. Nonmammalian species are highlighted in magenta. Arrow colors indicate which of the mouse gastrokine genes the target most closely resembles based on National Center for Biotechnology Information (NCBI) blasttp results, and the direction of the arrows corresponds to genomic orientation.
For the supplemental phylogenetic tree, amino acid sequences for GKN1, GKN2, and GKN3 genes were also obtained from UCSC, NCBI, and Ensembl. For data obtained from the UCSC genome browser, MAF DNA alignments of GKN amino acid sequences, aligned to both mouse and human, were downloaded with the UCSC Table Browser tool (http://genome.ucsc.edu/cgi-bin/hgTables) (18), using the Multiz Align (multiz46way) table from the Conservation track. For data obtained from Ensembl, all protein sequences were obtained from members of the ENSGT00530000063697 Gene Tree (http://www.ensembl.org/Multi/GeneTree?gt=ENSGT00530000063697) and from performing BLAST searches (http://pre.ensembl.org/Multi/blastview) of mouse GKN protein sequences against certain individual genomes within the Pre-Ensembl database (http://pre.ensembl.org/index.html; Felis catus, Pelodiscus siensis, Anas platyrhynchos, Chrysemys picta, and Ovis aries). From NCBI, amino acid sequences were obtained from GKN gene searches as well as BLAST searches (http://blast.ncbi.nlm.nih.gov/) against individual genomes using the mouse protein sequences as queries. We used the latest available genome releases as of June 2012 to obtain all available species sequences.
Fasta formats of the available amino acid sequences were downloaded and complied. The resulting set of amino acid sequences were then aligned with MUSCLE (10), and finally a maximum likelihood phylogenetic tree was generated with MEGA (43), utilizing the built-in JTT substitution model and NNI heuristic. The resulting tree was visualized with FigTree (http://tree.bio.ed.ac.uk/software/figtree/).
NetGene2, CrypSkip, and SIFT analyses.
The nucleotide sequence of the third exon of GKN3, including 100 bp of the surrounding introns, was submitted into both the NetGene2 [http://www.cbs.dtu.dk/services/NetGene2/ (5, 13)] and CrypSkip [http://cryp-skip.img.cas.cz (51)] cryptic splice site prediction programs.
SIFT software was used to predict deleterious amino acid substitutions as previously described by Ng and Henikoff (28). Human amino acid sequences for GKN1 and GKN2 and the predicted amino acid sequence for GKN3, along with the coordinates for all amino acid substitutions, were entered into the SIFT software (http://sift.jcvi.org/www/SIFT_seq_submit2.html). The software searches related sequences and predicts tolerated and nontolerated amino acid changes for each amino acid in the protein.
1000 Genomes data collection.
Genotype and haplotypic phase data for the 80 kb (ch2:69.13–69.21) region of human chromosome 2 was downloaded from the March 2012 release of the 1000 Genomes Project (47), using the Data Slicer web tool (http://www.1000genomes.org/data-slicer). This region comprises 2,123 polymorphic loci across a 80 kb region, spanning the three gastrokine genes GKN1, GKN2, and GKN3. The data were collected from 1,092 unrelated individuals from 14 different populations, with ancestry from four different continental regions (Table 1).
Table 1.
1000 Genomes phase 1
| Region/Population | Individuals Sampled | |
|---|---|---|
| European | (379) | |
| CEU | Utah residents with Northern and Western European ancestry | 85 |
| TSI | Tuscan in Italy | 98 |
| GBR | British from England and Scotland | 89 |
| FIN | Finnish from Finland | 93 |
| IBS | Iberian populations in Spain | 14 |
| East Asian | (286) | |
| CHB | Han Chinese in Beijing, China | 97 |
| JPT | Japanese in Tokyo, Japan | 89 |
| CHS | Han Chinese South | 100 |
| African | (246) | |
| YRI | Yoruba in Ibadan, Nigeria | 88 |
| LWK | Luhya in Webuye, Kenya | 97 |
| ASW | African ancestry in Southwest US | 61 |
| Latin American | (181) | |
| MXL | Mexican ancestry in Los Angeles, CA | 66 |
| PUR | Puerto Rican in Puerto Rico | 55 |
| CLM | Colombian in Medellin, Colombia | 60 |
This table identifies the breakdown by populations of the 1000 Genomes Phase One data. The numbers in parentheses indicate total number of individuals for each continental region. The categorization of the 14 populations into 4 continental regions as shown here differs from the categorization used by the 1000 Genomes Project in that we group ASW with the West African populations rather than those from the Americas. This is because the patterns of haplotype diversity for GKN3 in that population were observed to be unambiguously more similar to those observed in the West African populations YRI and ASW, compared with any other region (Fig. 7).
Haplotype counts and haplotype network construction.
For each of the three GKN genes, unique coding haplotypes were assembled and counted from the 1000 Genomes Project data (47) and broken down by each of the 14 represented populations. Coding haplotypes are defined here as the haplotypes assembled solely from the SNP loci within the coding region (exons) of a gene. Similarly, unique coding haplotypes based only on SNPs that defined either synonymous or nonsynonymous mutations were also assembled and counted for each of the three genes. These counts were represented as bar plots demonstrating the degree of haplotypic diversity within each population that resulted from synonymous, nonsynonymous, or all coding mutations.
Because the coding sequence within the GKN3 gene contains only a limited number of polymorphic sites reported in the 1000 Genomes Project data (47), an unrooted guide haplotype network was first constructed based on the full open reading frame, including introns (chr2:69,148,380–69,153,966). A sequence set was constructed comprising 123 unique haplotypes as defined by the 95 polymorphic loci within this region, and a statistically parsimonious haplotype network was constructed (not shown) using Pegas (34). A second network was assembled based only on the 16 polymorphic loci within the GKN3 coding sequence and then manually edited to reflect the topology of the guide network. It is this network that is referred to in subsequent analyses.
EHHS analysis.
The GKN3 haplotype network divides clearly into five distinct sets of haplotypes, each set comprising a single, high-frequency haplotype and one or more derived haplotypes differing by a single mutation. The extended haplotype homozygosity (EHH) profile of a single nucleotide polymorphism (EHHS) was calculated for each set, as described by Tang et al. (44), with each haplotype set subdivided into four continental regions as shown in Table 1.
To apply statistical rigor in comparing the EHHS profiles of the five different haplotype sets, samples from all four regions within each set were pooled, and the total EHHS profile for each pooled set was calculated (44). Each profile was then converted into a probability distribution, with the SNP loci comprising the sample space, and their respective probabilities proportional to their EHHS score. (Loci with an EHHS score <0.1 are excluded from the sample space). The corresponding cumulative distribution function was calculated for each distribution. Two samples are then compared by a standard two-sample Kolmogorov-Smirnov test (53), using sample sizes equal to the number of sampled chromosomes comprising each respective haplotype set.
Fst outlier analysis.
Genotype data for the chr2:69.13–69.21 Mb region from the 1000 Genomes Project (47) were assembled and converted to the GENEPOP format (39). This was analyzed to identify loci with outlier Fst values, by the fdist2 method (3, 27) as implemented in the LOSITAN software (2). Significant regions were identified with 1,000,000 simulations, with a confidence interval of 0.995, a false discovery rate of 0.01, and an infinite alleles mutation model as input parameters. A stepwise mutation model was used as well, with similar results (not shown). Significant regions with He values <0.01 were omitted due to the level of noise at this interval.
RNA-Seq.
Nicaraguan patient gastric resections for RNA extraction were stored in RNAlater at −70°C immediately after acquisition through endoscopy. Tissue was homogenized with the TissueLyser platform (Qiagen, Hilden Germany) and RNA extracted with the RNeasy mini kit (Qiagen). Total RNA samples were treated with RiboZero Magnetic (Human/Mouse/Rat) Kit from Epicentre Biotechnologies, Madison, WI to deplete rRNA, and cDNA libraries were prepared using ScriptSeq v2 RNA-Seq Library Preparation Kit (Epicentre). Sequencing was performed on the Illumina HiScan platform, 2*100 bp reads. The sequencing reads were subjected to quality control and were trimmed and filtered with a quality score cut-off of Q28, shortest allowed remaining read length 25 bp. The reads were then aligned to the human Ensembl GRCh37 genome using the OSA aligner, version v1.8.1 (14). The genomic coordinates of the GKN3 transcript were added to the .gff file, and we used OSA to calculate fragments per kilobase of exon per million fragments mapped values.
RESULTS
Identification of Gkn3 as a stomach-specific neck cell marker.
We originally sought to identify genes specific to gastric mucous neck cells in the stomach, as only a few genes are known to be expressed by this transient progenitor population. We used LCM to capture RNA from all cells within the neck region of gastric units in the corpus of adult mice (36). The purified RNA was then linearly amplified and hybridized to Affymetrix 430v2.0 GeneChips. We used dChip (1, 21) to analyze neck cell expression vis-a-vis other cell types within the gastric unit (Fig. 1A) (36). As the neck region is composed of both parietal cells and neck cells, it was particularly important to exclude genes expressed preferentially in parietal cells to determine those specific to neck cells. Furthermore, because chief cells are thought to derive from neck cells, chief cell-enriched genes also needed to be excluded. Thus, we determined genes whose expression was specifically increased in mucous neck cells vs. 1) parietal cells individually captured from above and below the neck zone, as well as 2) surface pit cells, and 3) chief cells from two independent isolations.
Fig. 1.

Microarray screen identifies gastrokine (Gkn)3 as mucous neck cell and stomach specific. RNA from different gastric cell lineages (A) was isolated by laser capture microscopy (LCM) followed by hybridization to Affymetrix Gene Chips. “Parietal Cell High/Low” indicates parietal cells from above (high) and below (low) the neck cell zone. We included 2 independent chief cell capture experiments to stringently select for genes expressed specifically in mucous neck cells before they differentiate into chief cells. A list of the most highly neck cell specific genes (B), in comparison with the expression profiles of other cell lineages, was then obtained. The pit cell-specific genes GKN1 and GKN2 are included as a reference to show differential cell lineage expression pattern. Expression of neck cell-enriched transcripts was next examined relative to expression in a panel of other organs (C). Like GKN1 and GKN2, GKN3 is also highly stomach specific.
The genes listed in Fig. 1B, had the highest increase in mucous neck cell relative mean expression vs. the other predominant gastric epithelial cell types. Next, we were interested in determining which genes had expression that was specific to the stomach by comparison to a panel of expression profiles generated from diverse murine organs (Fig. 1C). For reference, Gkn1 and Gkn2 are shown, as they are known to be both highly expressed and stomach specific but expressed in the surface pit region rather than in neck cells (Fig. 1, B and C). From this analysis, RIKEN cDNA 1190003M12Rik [later independently identified as GKN3 by Menheniott et al. (25)] was the only gene to have both a prominent neck cell-enriched and stomach-specific expression pattern (Fig. 1, B and C).
Conservation of the gastrokine locus and GKN3.
GKN3 shares both paralogy and locality with the two other gastrokine family members, GKN1 and GKN2. Within the murine gastrokine locus, Gkn2 is between and antisense to Gkn1 and Gkn3. All three of these genes share conserved exon/intron boundaries (Fig. 2A).Therefore, we propose that two gene duplications and, based on genomic orientation, an inversion occurred sometime during evolution. The configuration of the gastrokine locus is largely conserved throughout the mammalian clade (Fig. 2B).
Comparative genomic evidence indicates that the gastrokines appear to have arisen around the origin of tetrapods, with the earliest GKN orthologs, two copies of an open reading frame with closest homology to two Xenopus GKN paralogs, found in lobe-finned fish coelacanths (Figs. 2B and 3), which share a common ancestor with the tetrapod clade (NCBI, taxonomy, http://www.ncbi.nlm.nih.gov/guide/taxonomy/). Given there is an apparent duplication even in the coelacanths, it is likely that an ancestral GKN gene arose earlier. Our analyses likely missed even more ancestral versions of the gene, because of limited genomic sampling and annotation of species within and ancestral to the fish lineage. Many fish lack stomachs, but among those that have them (e.g., cod and tilapia) (11, 41, 42), no GKN orthologs are apparent. In all species wherein the region containing gastrokine genes is fully annotated, the gastrokines are between ANTRX1 and Bmp10 followed by Arhgap25 (Fig. 2A). Fish have conserved localization of Arhgap25 near Bmp10 (though most fish have another BMP10 paralog or ortholog located elsewhere in the genome) but clearly lack all gastrokine genes and ANTRX1 at this remote locus. In several of the fish genomes available, the region on the opposite side of Bmp10 from Arhgap25 is often less well annotated, so we cannot exclude the possibility of undetected gastrokine precursors (data not shown).
Fig. 3.

Phylogeny of putative gastrokine proteins shows conservation of each of 3 GKN branches in mammals with separate coelacanth and Xenopus branches. This phylogeny is based on a MUSCLE assembly of the putative protein sequences of all of the gastrokine targets from all of the accessible genomes from the NCBI, Ensembl, and UCSC genome browsers at the time of writing. Sequences that were not previously identified as gastrokines where designated as such based on blasttp results and their spatial relationship to ANTXR1 and BMP10 homologs. There are three major branches from the root: one contains the two coelacanth gastrokine genes and two of the Xenopus gastrokine genes (yellow), the second contains the GKN1 phylogeny (blue) and the GKN3 phylogeny (green), the third contains the GKN2 phylogeny (red). As in Fig. 2, the nonmammalian taxa are highlighted in magenta.
Figure 2B illustrates the conservation of the gastrokine locus, using the murine gastrokine genes as reference, in species representative of distinct clades. Of those genes that are orthologous to mouse, GKN1 are in red, GKN2 are in black, and GKN3 are in blue. Incomplete gene annotation proves to be the biggest hindrance to building a complete picture of gastrokine evolution. Some GKN genes were found on scaffolds by themselves, as in the case of the two coelacanth genes and single platypus gene. In such cases, it becomes difficult to contextualize or verify the status of the GKN gene cluster. In other cases, such as the Chinese turtle, the scaffold that contains the gastrokine gene cluster also contains Antrx1 but ends before Bmp10. In several mammalian cases, the entire gastrokine gene cluster is present including both Antrx1 and Bmp10, but GKN3, the most recently discovered family member, is usually not identified.
To analyze the conservation and evolutionary relationships within and among the three GKN genes, a comprehensive phylogenetic tree was constructed (Fig. 3). This was done using MUSCLE alignments of both known and predicted amino acid sequences from all availably annotated GKN genes isolated from the species genomes available thus far (see methods for further details). Expressed sequence tags (ESTs) for GKN3 have been isolated from the following species: Mus musculus (mouse), Rattus norvegicus (rat), Sus scrofa (pig), and Bos taurus (cow), as discovered within the NCBI and/or UCSC databases.
Gkn3 localization to the neck region of gastric units.
Given the extensive conservation and distribution of gastrokines throughout the tetrapods and given their stomach specificity, we were interested in further characterizing GKN3 protein in the stomach. GKN1 and GKN2 have been well characterized as specific to mucous pit cells (Fig. 1B) (30, 52). However, genes expressed specifically in the mucous neck cell, which is thought to be an unusual transient progenitor population for gastric chief cells (12), are relatively rare. To confirm that Gkn3 was expressed in neck cells, we developed a panel of polyclonal antibodies, varying in antigenic epitope and host species. GKN3-94 was raised in rabbits against a synthetic peptide comprising the first 15 amino acids in the third exon of murine Gkn3 (translated from the RIKEN cDNA 1190003M12 sequence), designed to recognize the portion of GKN3 protein with least homology to GKN1 and GKN2. In the corpus, this antibody stains neck cells, i.e., colabels with neck cell markers like TFF2 and GS-II (Fig. 4A). Additionally, it labels some cells as high as the isthmus that may represent preneck cells (17). We also raised an antibody, GKN3–236, in chickens against full-length murine GKN3 fusion protein. While this antibody detected neck cells with high affinity, we made the surprising discovery that even preimmune chicken serum shows highly selective neck cell immunostaining, even though Western blot showed only immunized serum recognized murine GKN3 in addition to nonspecific protein bands (data not shown). Thus, chicken serum shows natural immunity against another epitope in mucous neck cells. We next raised an antibody, GKN3-85, in rabbits against the same immunogen. GKN3-85 also colocalizes with GS-II, with a slight variation in pattern relative to the peptide antibody in that it labels neck cells more prominently as they transition to the base in the corpus (Fig. 4B). In the antrum, there is strong staining in the deep mucous cells and also cellular (but not subcellular) colocalization with GS-II (Fig. 4C), an antral pattern similar to all known genes expressed in the corpus mucous neck cells. GKN3-94 also recognizes mucous cells within the base of the antrum (data not shown). In situ hybridization for Gkn3 mRNA also localizes expression to neck cells in the corpus (Fig. 4E) and deep mucous cells in the antrum (Fig. 4F).
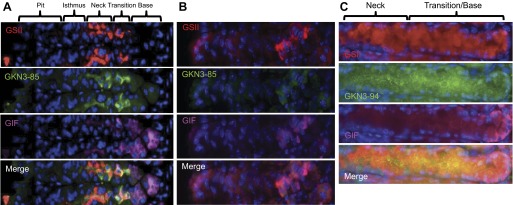
Fig. 4.

GKN3 is expressed in corpus mucous neck cells and deep mucous antral cells. Immunostaining of antibodies raised against murine peptide (A; GN-19894) and full-length (B, C; PAC3585) murine GKN3 (green) colocalizes with the neck cell marker GS-II (red). In corpus (A, B), GKN3 does not colocalize with the murine zymogenic cell marker GIF (pink). However, all 3 markers colocalize in the bases of the antral glands in a pattern consistent with that of deep antral mucous glandular cells (C). GKN3 and GS-II also colocalize in pigs (D), indicating both conservation of GKN3 and cross-species utility of the PAC3585 antibody. Nuclei are labeled with Hoechst (blue). In situ hybridizations localize Gkn3 message to corporal neck cells (E) and to the base in antral glands (F).
To determine whether GKN3 was not only evolutionarily conserved at the genomic level but also by pattern of expression, we next immunostained with GKN3-85 on porcine gastric tissue and found colocalization with GS-II in neck cells (Fig. 4D) Interestingly, porcine GS-II+/GKN3+ cells are less concentrated in the neck zone, with many extending more basally.
Gkn3 expression in mouse models of metaplasia.
Previously, we characterized a model of TFF2 (spasmolytic polypeptide) expressing metaplasia (SPEM) that occurs during the response to parietal cell loss (e.g., as occurs during infection with H. pylori). High doses of the selective estrogen receptor modulator (SERM) tamoxifen kill parietal cells (15), resulting in aberrant expression of neck cell markers (like TFF2 and GS-II) in the base of gastric units. GKN3 is similarly expressed in the base during tamoxifen-induced metaplasia (Fig. 5, A and B) and in metaplasia in tox176 mice, wherein parietal cell death is induced genetically (Fig. 5C) (4).
Fig. 5.
GKN3 localizes to metaplastic cells in the neck/chief lineage. During metaplasia, thought to be a precursor to gastric cancer, expression of neck cell markers occurs in chief cells in the base of gastric units, as well as in the usual cells in the neck. In normal gastric units (A), there is a delineation between the neck cell markers GS-II (red) and GKN-85 (green) and the zymogenic cell marker GIF (pink), with only a few overlapping cells in the transition. During metaplasia induced by tamoxifen (B), however, there is an overlap among all three makers. The same is true for GKN3 staining of a different mouse model of metaplasia, tox176 SPEM mice (C).
Analysis of GKN3 locus in humans.
How metaplasia occurs in humans is not clear, so an additional molecular marker of this precancerous lesion might help us better understand the process. However, there are no reported ESTs representing GKN3 in human libraries, and it is not clear whether GKN3 is expressed in humans or is a pseudogene. While we were analyzing sequence and expression of Gkn3, Menheniott et al. (25) reported their analysis of the same gene (Fig. 6A), finding it to be neck cell specific in mice. But in humans, they reported a SNP, rs10187256, in the predicted (by conservation) third exon that would mutate, by means of the G-A substitution, a highly conserved tryptophan to a premature STOP codon (Fig. 6, B and C) (25). We next decided to analyze GKN3 sequence evolution and conservation among populations of humans in an attempt to learn more about this SNP and possible functionality of the gene in various human populations. We identify another SNP 5 bp downstream of rs10187256, rs75578132, that confers an A-G substitution and would be expected to be nonsynonymous, converting what is a highly conserved glycine in coding species to an arginine (Fig. 6, B and C). We also discovered a mutation specific to all humans sampled so far, at the start of the predicted third intron that changes the presumptive obligate splice donor recognition site GT to AT (Fig. 6, B and C). This sequence is critical for recognition of the U1 snRNP to the 5′ splice site, and a G-A substitution at this site would greatly decrease likelihood of splicing at this junction, where conserved GKN3 mRNA transcripts in other species are known to have an exon-intron boundary. If GKN3 were expressed in humans, it would likely require either exon skipping or a cryptic splice site (38). A possible cryptic splice site, underlined in green in Fig. 6B, was predicted by both the NetGene2 and CrypSkip cryptic splice site prediction programs (13, 51).
Fig. 6.

A majority of the interesting human GKN3 mutations involve or affect the predicted 3rd exon. Similar to the other 2 gastrokines, GKN3 (A) is divided into 6 exons (separated by underscores) and composed of a signal sequence (light green), a BRICHOS domain (magenta), and 2 conserved cysteines (gray) at the N′ terminus. The predicted 3rd exon of GKN3 is particularly intriguing (B, blue). It contains 2 single nucleotide polymorphisms (SNPs, red) that are predicted to encode amino acid changes, the first SNP (rs10187256) is a G-A substitution that changes a conserved tryptophan (C, red) to a STOP codon; 5 bp downstream, an A-G substitution (rs75578132) changes a conserved glycine (C, red) to an arginine. There is also a change, from the conservative site in mammals (C, red), in the obligate donor splice site (B, red underline) at the beginning of exon 4 from the conserved GT-AT that occurs in all genotyped humans. A possible cryptic splice site that could be used to rectify this donor site change is underlined in green (B). This splice site was predicted using NetGene2. A comparative list of amino acids in the predicted 3rd exon, followed by the 1st 2 bases of the 3rd intron, among various species details the conservation of the ancestral form of the human SNPs. Note the human SNPs listed are the deviations and, in the case of rs75578132 (G-R), do not reflect the most common variant.
Using 1000 Genomes data to further analyze potential GKN3 pseudogenicity.
In addition to the splice site mutation, universal in all humans, and the premature STOP codon, in some humans, there is additional evidence against expression of GKN3. For one, as mentioned, we find no GKN3 in EST libraries. We next tested whether GKN3, especially the SNPs in exon 3, shows signs of natural selection. We therefore acquired data from the newly available 1000 Genomes Project phase 1 release (March 12, http://www.1000genomes.org/). Phase 1 includes phased reads from low coverage sequencing of 1,092 unrelated individuals from 14 different populations. A detailed list of each the number of individuals from each population included can be found in Table 1. We extracted and analyzed SNPs within an 80 kb region of chromosome 2, 69130000–69210000, which includes all three of the GKN genes. To contextualize selection on GKN3, we characterized the selective signatures across different populations for all three of the GKN genes.
Comparison of coding haplotypes among the three GKN genes.
While all three GKN genes exhibit a moderate amount of coding sequence haplotype diversity, partitioning polymorphisms into synonymous and nonsynonymous mutations reveals a distinction between GKN1 and the other two GKN genes (Fig. 7). The former shows virtually no diversity generated by nonsynonymous mutations, suggesting strong conservation of the encoded protein sequence. The reverse pattern is demonstrated by both GKN2 and GKN3, for which nonsynonymous mutations generated virtually all of the observable diversity. This result is intriguing, as GKN1 and GKN3 share the greatest sequence paralogy (25). GKN3 further appears to exhibit a strong region-specific effect, with certain haplotypes predominating in specific continental regions. Specifically, the haplotype corresponding to the yellow and lime green bars predominate in East Asia, while the haplotype corresponding to the purple bar predominates in Africa (Fig. 7C).
Fig. 7.
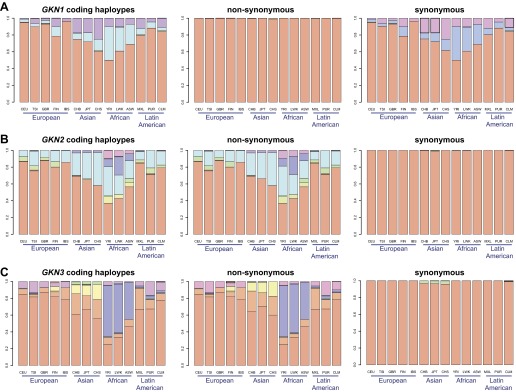
Differences in coding haplotypes and SNPs between the three gastrokines. The SNPs within the 80 kb region of extracted from chromosome 2 of the 1000 Genomes Project were divided between those located in exonic and intronic sequences for GKN1 (A), GKN2 (B), and GKN3 (C). The coding haplotypes, assembled from exonic SNPs, were also separated into those that would result in changes in amino acid sequence from reference sequence (nonsynonymous) and those that didn't (synonymous). The haplotype representing the reference amino acid sequence is in red and is clearly the predominant haplotype, by percentage (y-axis) in all populations, which are also grouped by continental regions (x-axis). The other haplotypes are separated by color. GKN2 and GKN3 have a similar pattern in terms of nonsynonymous and lack of synonymous coding haplotypes, which is the opposite from GKN1. Note that GKN1 and GKN3 are more similar to each other in sequence than either is to GKN2.
The SNPs that make up the coding haplotypes of the three GKN genes are detailed in Supplemental Table S1.1 To determine whether the amino acid substitutions from the nonsynonymous SNPs would be deleterious, we used the amino acid substitution predictor SIFT (28). SIFT is a homology-based program that predicts where an amino acid substitution at a specific site would be deleterious to the protein (and therefore not tolerated) based on the alignment of similar protein sequences and those predicted to have similar functions. The results of the SIFT analysis are included in Supplemental Table S1. Incidentally, the three nonsynonymous SNPs in GKN1 are all predicted to be tolerated. Of the 11 nonsynonymous SNPs in GKN2, six are predicted to be tolerated and five are predicted not to be tolerated. Of those five, four occur at very low frequencies within the populations. Of the 14 nonsynonymous SNPs in in GKN3, 10 are predicted to be tolerated and four are predicted not to be tolerated. Those four SNPs include rs10187256 and rs75578132, which will be discussed later; rs28441323, which is in high linkage disequilibrium (LD) with rs10187256 (D′ = 0.994); rs75578132 (D′ = 1); and rs191803503, which occurs at low levels in the populations.
Evolutionary origin of GKN3 coding haplotypes.
The haplotype network shown in Figs. 8 and 9 represents an estimation of the evolutionary history of the gene and, in particular, the sequence of point mutations in its coding regions that gave rise to observable variation across and within human populations. Though only coding mutations are directly represented in Fig. 9, its topology was assembled from a guide tree made from many additional noncoding polymorphic loci (Fig. 8). By partitioning the available haplotype data into distinct subsets and interrogating each subset for signatures of nonneutral evolution, we hoped not only to determine whether selection was occurring in this gene but also to discover the history and genetic context of any proposed selective sweeps. Furthermore, a haplotype network resolves ambiguities that result from mutational homoplasy (46), which may obscure signatures of positive selection (8). The construction of the network from coding sequence mutations was due to the hypothesis that one or more coding sequence mutations are driving the evolution of this gene.
Fig. 8.

Intronic SNPs prove useful for the design of an accurate coding haplotype network. From the coding haplotypes graphed in Fig. 7, a haplotype network was designed. The haplotype network was calculated based on the frequency and clustering of the SNPs within the putative coding region of GKN3 using Pegas (34). Each circle or node represents a haplotype, and its area is directly proportionate to its frequency. The network for coding SNPs was then compared with the GKN3 graph of all coding haplotypes from Fig. 7 (A). Each haplotype (separated by color) was assigned to its respective node (A, B). Note only the 5 most frequent haplotypes are identified by Roman numerals. The embedded pie charts (B, C) indicate the relative proportions of the sampled continental regions (blue for European, red for East Asian, orange for African, green for Latin American). The lines between nodes represent mutations that likely occurred, and their length is directly proportional to the mutational distance between haplotypes. A haplotype network base on all GKN3 SNPs (both exonic and intronic) was also created (C). There was a discrepancy in the relationship of haplotype V to that of I and III between the coding and full haplotype networks (B, C). Since the full haplotype network contained more SNPs, its pattern was favored and the coding haplotype network was adjusted to fit with that pattern (D).
Fig. 9.

The extended haplotype homozygosity of SNP (EHHS) profiles of the different haplotypes define patterns of selection. Using the coding haplotype network (derived in Fig. 7D), we created EHHS plots. As mentioned previously, the lines between nodes in the haplotype network represent mutations. We have labeled mutations, rs10187256 being representative, that define the differences between the major coding haplotypes. The 5 surrounding line charts (I–V) are EHHS profiles calculated for the 5 major haplotype sets in the network, scaled identically for comparison. Arrows are shown to connect EHHS plots with their respective haplotype sets in the network. Curves represent the decay of haplotype homozygosity within each set, centered around the SNP indicated in each chart title. Curves are colored to represent the different continental regions, using the same color scheme as the haplotype network and indicated in the legends, as are haplotype sample sizes.
EHHS profiles portray the decay of haplotype homozygosity in specific populations, as a function of distance from a core site TA (44). A narrow curve with a sharp peak indicates an older haplotype that has undergone multiple mutation and recombination events, while broader curves indicate a more recent origin and consequently less decay of homozygosity. We calculated the EHHS profiles for five prominent sets of coding sequence haplotypes in GKN3 (Fig. 9) to obtain a qualitative measure of the relative age and mutational history that has occurred within each set. Markedly different curves for populations within a haplotype set may indicate a recent local selective sweep for the population with the broader curve, possibly due to heterogeneous environmental (as opposed to genetic) influences across populations. Similarly, contrasting profiles for different haplotype sets may indicate a selective sweep for the set with broader curves, while mutations that distinguish these haplotype sets from each other represent putative causative mutations for that sweep. Though minor differences can be distinguished between populations within each EHHS profile, the strongest contrasts can be made between the profiles for different haplotype sets. The peaks in Fig. 9, IV, sampled almost entirely from individuals with African ancestry, are noticeably narrower than the rest, indicating a relatively ancient haplotype that has undergone multiple noncoding mutations. This is consistent with the widely held observation that most of human genetic diversity exists in African populations (48). For the purposes of this study, we posit that haplotype set IV represents the ancestral coding haplotype for GKN3 and that other haplotypes are derived from this in roughly the order and pattern shown in the haplotype network (notwithstanding past recombination or gene conversion events that would obscure network accuracy).
From this premise, a picture emerges of the evolutionary history of the GKN3 gene. From the ancestral haplotype, evolution of GKN3 progressed in two directions, one seemingly driven by the nonsense SNP (rs10187256) in exon 3 described by Menheniott et al. (25) and another driven by a second SNP only five base pairs downstream (rs75578132), changing a codon for glycine into one for arginine. The nonsense mutation was an apparent precursor to a massive expansion of the derived haplotype (Fig. 9, III) out of Africa, increasing its frequency in Latin America and spreading into Europe and East Asia. This is supported by a Kolmogorov-Smirnov test comparing the total EHHS profiles of the two haplotype sets in Fig. 9, III and IV, which yielded a P value < 0.001 (see methods).
At some later point a secondary derived haplotype (Fig. 9, II), resulting from another missense mutation changing glutamine to arginine, branched off and also spread across all four regions, particularly East Asia, in another selective sweep (P < 0.001). A tertiary derived haplotype (Fig. 9, I) sampled from Europe and East Asia also emerged from this, though its total EHHS profile relative to its precursor does not indicate a selective sweep (P = 0.518).
Even though it represents only a minority of the observed haplotypes, the derived haplotype set (Fig. 9, V) resulting from the Gly-Arg missense mutation appears to have evolutionary significance as well. In addition, while this haplotype is separated from its ancestral haplotype (Fig. 9, IV) by only a single coding mutation, its EHHS profile is markedly different (P < 0.001), with broader curves indicating a more recent origin and expansion. Interestingly, it appears that not only did this derived haplotype spread more rapidly in Latin America relative to its precursor, it spread rapidly throughout Europe, implying a strong regional effect.
SNP loci in GKN3 under positive selection.
Figure 10 shows the direct output of the fdist2 program for identifying candidate loci subject to selection, as implemented in the LOSITAN selection detection workbench (2). The method is premised on the idea that genetic differentiation between populations, measured in this case using Wright's inbreeding coefficient Fst (55), should be the same for different neutral loci when taken from the same sample of individuals, because of their shared demographic history (20). Among a large sample of loci, those with especially high or low estimated Fst values compared with neutral expectations should therefore be candidates for being subject to strong selective sweeps. The approach examines Fst as a function of expected heterozygosity, describing the expected distribution of these two parameters under an island model of migration and an assumption of neutrality. Confidence intervals are calculated by an extensive coalescent simulation process; loci that exhibit Fst values outside of these confidence intervals (shown in the red and yellow regions of the graph) are identified as candidates for selection. Candidates within the 80 kb region excised from 1000 Genomes data are listed in Table 2.
Fig. 10.
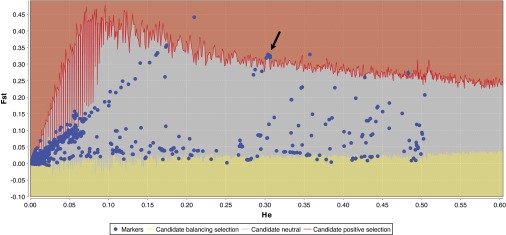
Fst outlier analysis identifies GKN3 SNPs under positive selection. All SNPs within the 80 kb region containing all 3 GKN genes are plotted by Fst vs. heterozygosity, directly as outputted by the LOSITAN software (2). SNPs in the red zone are outlier SNPs and thus candidates for positive selection. All candidate SNPs are listed in Table 2. The arrow points to the cluster of SNPs from the major selective sweep within GKN3 (Table 2, boldface).
Table 2.
SNPs under positive selection from the Fst outlier analysis
| bp Cords. | SNP ID | Locus | Het | Fst | P Value |
|---|---|---|---|---|---|
| 69148219 | rs10206911 | intragenic | 0.295893 | 0.278067 | 0.00180 |
| 69148666 | rs13428424 | GKN3 int 1 | 0.285242 | 0.267566 | 0.00548 |
| 69149169 | rs28654646 | GKN3 int 1 | 0.287334 | 0.283282 | 0.00300 |
| 69149706 | rs13406349 | GKN3 int 2 | 0.303525 | 0.326042 | 0.00020 |
| 69149717 | rs13431896 | GKN3 int 2 | 0.304849 | 0.326788 | 0.00019 |
| 69149757 | rs13394515 | GKN3 int 2 | 0.302107 | 0.319979 | 0.00054 |
| 69149788 | rs13432192 | GKN3 int 2 | 0.301585 | 0.318208 | 0.00057 |
| 69149812 | rs13406448 | GKN3 int 2 | 0.305366 | 0.3265 | 0.00048 |
| 69149981 | rs10187256 | GKN3 ex 3 | 0.306481 | 0.325189 | 0.00050 |
| 69150125 | rs10166239 | GKN3 int 3 | 0.304906 | 0.327163 | 0.00019 |
| 69150158 | rs10166077 | GKN3 int 3 | 0.304906 | 0.327163 | 0.00019 |
| 69150538 | rs10166498 | GKN3 int 3 | 0.304906 | 0.327163 | 0.00019 |
| 69150546 | rs10166499 | GKN3 int 3 | 0.304906 | 0.327163 | 0.00019 |
| 69150640 | rs28366977 | GKN3 int 3 | 0.304906 | 0.327163 | 0.00019 |
| 69151692 | rs28380047 | GKN3 ex 4 | 0.304906 | 0.327163 | 0.00019 |
| 69151723 | rs28627149 | GKN3 ex 4 | 0.304906 | 0.327163 | 0.00019 |
| 69151746 | rs28441323 | GKN3 ex 4 | 0.305841 | 0.324189 | 0.00052 |
| 69151846 | rs28539974 | GKN3 int 4 | 0.304384 | 0.328346 | 0.00018 |
| 69151900 | rs28501412 | GKN3 int 4 | 0.304384 | 0.328346 | 0.00018 |
| 69151952 | rs28517628 | GKN3 int 4 | 0.304384 | 0.328346 | 0.00018 |
| 69151991 | rs28734850 | GKN3 int 4 | 0.304384 | 0.328346 | 0.00018 |
| 69152111 | rs28414650 | GKN3 int 4 | 0.303924 | 0.329038 | 0.00017 |
| 69152365 | rs61656998 | GKN3 int 4 | 0.306518 | 0.319706 | 0.00061 |
| 69152568 | rs17036241 | GKN3 int 4 | 0.306576 | 0.320106 | 0.00060 |
| 69160271 | rs60437421 | intragenic | 0.161933 | 0.331484 | 0.00443 |
| 69169927 | rs13428587 | intragenic | 0.162649 | 0.333824 | 0.00424 |
| 69171699 | rs13396500 | intragenic | 0.160571 | 0.327211 | 0.00444 |
| 69172911 | rs10048698 | GKN2 int 5 | 0.174219 | 0.356873 | 0.00152 |
| 69174617 | rs13388180 | GKN2 int 3 | 0.174219 | 0.356873 | 0.00152 |
| 69175333 | rs10048657 | GKN2 int 3 | 0.17319 | 0.351439 | 0.00037 |
| 69179255 | rs10175379 | GKN2 int 3 | 0.209496 | 0.441299 | 0.00009 |
| 69184289 | rs4588222 | intragenic | 0.427538 | 0.259754 | 0.00311 |
| 69188010 | rs13423068 | intragenic | 0.357364 | 0.328924 | 0.00008 |
| 69207357 | rs57983899 | GKN2 int 1 | 0.482931 | 0.27378 | 0.00057 |
| 69208834 | rs7600486 | intragenic | 0.48309 | 0.271953 | 0.00063 |
The single nucleotide polymorphisms (SNPs) in this table are those under positive selection according to the fdist2 Fst outlier analysis (red region of Fig. 10). Heterozygosity and Fst values are shown as calculated from LOSITAN, and P values listed are the probability that a simulated Fst value is greater than the sample Fst (2). The SNPs highlighted in boldface are those that constitute the cluster of SNPs that make up the major selective sweep with GKN3 (Fig. 10, arrow).
Five loci with heterozygosity <0.1 were discarded due to the irregular contour of the confidence intervals in that region. Candidates for negative selection (those loci falling in the yellow region) were also discarded, first because the method has low reliability in detecting low-Fst outliers (2) and second because our primary interest was in detecting positive selection. Interestingly, of the 35 candidate SNPs identified, all but seven were located in the coding regions of the three GKN genes (exons or introns), and of these 28, all but five resided in GKN3 and clustered around the same point in the fdist2 output (Fig. 9). These 23 SNPs are in LD (minimum pairwise D′ = 0.845) and may therefore be remnants of an ancient selective sweep (Table 2, boldface). Though four of these SNPs reside in exons, only rs10187256 and rs28441323 were predicted not to be tolerated via the SIFT analysis (Supplemental Table S1).
DISCUSSION
We independently identified Gkn3 (which we originally termed Brinc, BRICHOS in neck cells) in a microarray screen for both stomach- and neck cell-specific genes. We confirmed that GKN3 is neck cell specific by both in situ hybridization and antibody staining in multiple species. Through comparative genomics we show that the gastrokine lineage likely arose slightly prior to terrestrial vertebrate evolution with two family members, and the third member was introduced in the mammalian clade. The platypus has only Gkn3, but according to Ordoñez et al. (31) several other stomach-specific genes are also absent in those animals, such as ATP4A, ATP4B, CTSE, GAST, NGN3, PGA, and PGC. The evolutionary rise of the gastrokines is in tetrapods, slightly later than that of pepsinogen and gastrin, which occur in some fish, suggesting that the GKNs may have evolved as animals with an acid secreting stomach adapted to terrestrial life (6, 50).
A preliminary investigation of the mutational patterns in coding regions for the three GKN genes revealed a clear distinction between GKN1 on the one hand and GKN2 and GKN3 on the other. Apparent global haplotype diversity in the former was driven almost entirely by synonymous mutations, while the opposite pattern was observed in the latter two genes, suggesting that of the three genes, only GKN1 is under strong purifying selection preserving its amino acid sequence. Conversely, GKN2 and GKN3 appear to be under neutral or positive selection, though distinguishing between these hypotheses for either of these genes is more difficult.
In both cases, only two SNPs can be observed that had resulted in synonymous mutations, and in all four cases these mutations have occurred recently in evolutionary history. We speculate that a previous selective sweep had wiped out other synonymous SNPs in these genomic regions, prior to the occurrence and relatively rapid spread of other nonsynonymous mutations. However, a modified McDonald-Kreitman test (24, 45) performed for both genes failed to reject the null hypothesis of neutrality in both cases (not shown), but this is likely due to the highly conservative nature of the test, coupled with small sample sizes of coding SNPs within either gene. The subjective appearance of a region-specific patterning of haplotype diversity in GKN3, however, coupled with the previous observation of a possible selective sweep in that same gene in non-African populations (25), suggested that a more comprehensive analysis was merited.
Haplotype network analysis, coupled with calculation of the EHHS profiles for major haplotype sets within the inferred network, reveal further hints of a more complex and region-specific pattern of positive selection, seemingly driven by specific coding mutations in its evolutionary history. Specifically, there appears to have been three selective sweeps driving the rapid proliferation of specific derived GKN3 haplotypes across various continental regions at different times. The first of these allowed for a massive expansion of the derived haplotype (III) outside of Africa, displacing the ancestral haplotype (IV) to become the majority haplotype across all sampled European, East Asian, and Latin American populations. The haplotype network suggests that the triggering mutation was the potentially inactivating nonsense mutation described by Menheniott et al. (25), as this was the last coding mutation to occur before the expansion. A subsequent missense mutation, changing glutamine to arginine, resulted in a secondary derived haplotype (II), which resulted in another more recent spread across all four continental regions, but increasing in frequency specifically in East Asian populations. Perhaps the most interesting region-specific effect arose from a relatively recent missense mutation changing glycine to arginine just five base pairs down from the nonsense mutation in the ancestral haplotype, resulting in a derived haplotype (V) that appears to have spread quickly in European and Latin American populations, while remaining completely absent in East Asia. Though the derived haplotype differs from the ancestral one by only a single coding mutation, its EHHS profile contrasts dramatically from that of the latter. In addition to its spread throughout Europe (in which the ancestral haplotype is now absent), even the relatively small subsets of this sampled haplotype found in Africa and Latin America show signatures of a selective sweep that may be displacing the ancestral haplotype in those regions even to this day. These region- and haplotype-specific signatures disappear when the EHHS analysis is performed for a single sample pooled across all regions and haplotypes, suggesting that this approach is useful for extracting meaningful analyses from specific portions of large data sets.
In an attempt to add quantitative rigor to this analysis, we subjected the same 1000 Genomes data to an analysis identifying outlier loci with extreme Fst values within the region, a pattern indicative of a selective sweep. The resulting analysis identified a block of 21 candidate loci located within GKN3, spanning the region from intron 2 to intron 4, and containing exons 3 and 4. Interestingly, it once again included the nonsense mutation described by Menheniott et al. (25). It failed to include the two other missense mutations identified in our haplotype/EHHS analysis to be putative drivers of rapid expansion, though this could be due to their more recent occurrence and the consequently lower frequencies of the derived alleles.
The presence of an alternate splice donor site at the start of intron 3 in humans further confounds the results surrounding selection on the SNPs in GKN3's third exon, rs10187256 and rs75578132. Since the change from a GT-AT in the obligate donor site is sufficient to abolish splicing at that region, it is likely that, if GKN3 is expressed in some humans, either the exon is skipped entirely or a cryptic splice site is utilized, thereby truncating or elongating the third exon. Cryptic splice site prediction indicates the likely utilization of a cryptic splice site upstream of both third exon SNPs, which could result in their omission. Utilization of this splice site would also remove a section of the BRICHOS domain, possibly changing the function of GKN3.
Perspectives
We confirm here the findings of Menheniott and colleagues (25) that GKN3 is a mucous-neck and stomach-specific protein expressed in mice. Additionally, we show similar neck cell expression in pigs and show that the gastrokines as a group are conserved across tetrapod species in general with highly conserved genomic locus structure. Menheniott et al. (25) identified a single SNP within the human GKN3 that would be expected to lead to nonsense mutation in a large portion of the human population. We identify additional missense SNPs and loss of a consensus splice donor sequence in all humans thus far analyzed. We show that both GKN2 and GKN3 have multiple nonsynonymous and predicted nontolerated SNPs, indicating that their amino acid sequences, and possibly their expression levels, are not constrained by strong selective pressure. To date, outside of an experiment in a cell line in which nonsense mediated decay had been inhibited, there has been no report of actual GKN3 expression in humans. In limited numbers of fresh gastric samples from Caucasians and African Americans of varying genotypes, we also have failed to detect GKN3 message with a variety of primers both upstream and downstream of the presumptive mutant splice donor site (data not shown). However, the possibility of alternative splicing indicated by abolishment of the canonical splice donor site at the end of exon 3 could complicate primer design. Thus, we performed RNA-Seq on RNA isolated from the corpus gastric mucosa of 29 Nicaraguan patients that lacked H. pylori infection and had normal morphology or were infected and had simple gastritis or intestinal metaplasia or atrophy. We detected transcripts for the other two members of the gastrokine family, GKN1 and GKN2, as well as TFF2 and MUC6, both of which are also neck cells markers but failed to detect any transcripts for GKN3 arguing for its pseudogenicity (Fig. 11A). Interestingly, a random sampling of 12 individuals from this Nicaraguan population all genotyped as A/A for rs10187256, indicating a lack of the selective sweep within this population (Fig. 11, B and C). Furthermore, we do not detect GKN3 protein using our antibodies in normal gastric tissue from a small cohort of St. Louis patients, about half of which are heterozygous for the A/G allele (Fig. 11, B and C), by immunolabeling or Western blot (not shown), though one of our antibodies, GKN3-85, was generated against murine GKN3 and is immunoreactive to porcine tissue (Fig. 4). Thus, all our data to date fail to detect expression from the GKN3 locus in humans, no matter the genotype. However, if GKN3 were truly a pseudogene, its relatively limited number of nontolerated mutations across the human population would be unusual (49). To resolve some of these issues would require extensive analysis of human GKN3 mRNA derived from diverse human stomachs, as well as analysis of translated protein, by both Western blot and mass spectrometry, from diverse normal and metaplastic gastric tissue.
Fig. 11.

Evidence that the GKN3 locus is not expressed. Expression levels of GKN3 compared with the other gastrokines, GKN1 and GKN2, as well as 2 mucous neck cell-specific transcripts TFF2 and MUC6 (A). Expression was analyzed by RNA sequencing, and values are shown as FPKM, fragments per kilobase of exon per million fragments mapped. All samples were from gastric resections from Nicaraguan patients and genotyped, using restriction fragment length polymorphism (RFLP) analysis to be homozygous for STOP alleles (A/A) at SNP rs10187256. No GKN3 expression was detected in 17 other Nicaraguan patients, though we were not able to genotype those patients (not shown). RFLP of genomic DNA from 10 randomly selected patients whose stomachs were resected for gastric cancer in St. Louis (B). Half are homozygous for the STOP (A/A) alleles and half heterozygous (A/G). No message or protein was detected from any of the stomachs of these patients (not shown). Distribution of alleles at this SNP site in the 1000 Genomes data is depicted in C. The G allele and G/G genotype are most common in African populations (YRI, LKW, ASW). The last two columns represent the RFLP data from St. Louis (STL) and Nicaragua samples (NCG) analyzed to date.
GRANTS
J. H. Geahlen, W. J. Huh, and S. S. Khurana were all funded in part by the Siteman Cancer Center Cancer Biology Pathway (Washington University School of Medicine). Other funding: A. R. Templeton (NIH P50-GM-65509), J. C. Mills (ACS DDC-115769, NIH DK-094989-1; Funderburg Research Scholar Award of the American Gastrological Association; NIH P30 DK-052574).
DISCLOSURES
No conflicts of interest, financial or otherwise, are declared by the author(s).
AUTHOR CONTRIBUTIONS
Author contributions: J.H.G., C.L., K.T., W.J.H., E.L.O., J.K.L., S.B.L., and J.C.M. conception and design of research; J.H.G., C.L., K.T., I.N., W.J.H., E.L.O., J.K.L., X.T., V.G.W., and S.S.K. performed experiments; J.H.G., C.L., K.T., I.N., W.J.H., E.L.O., J.K.L., V.G.W., S.S.K., A.R.T., and J.C.M. analyzed data; J.H.G., C.L., K.T., W.J.H., E.L.O., J.K.L., S.B.L., A.R.T., and J.C.M. interpreted results of experiments; J.H.G., C.L., K.T., E.L.O., and J.K.L. prepared figures; J.H.G., C.L., and J.C.M. drafted manuscript; J.H.G., C.L., A.R.T., and J.C.M. edited and revised manuscript; J.H.G., C.L., A.R.T., and J.C.M. approved final version of manuscript.
Supplementary Material
ACKNOWLEDGMENTS
The authors thank the 1000 Genomes Project for making their data publically available for analysis. We thank the National Center for Biotechnology Information, University of California Santa Cruz Genome Bioinformatics Group and the European Bioinformatics Institute and Sanger Welcome Trust for curating, analyzing, and maintaining information regarding animal genomes. We acknowledge the Alvin J. Siteman Cancer Center [Washington University School of Medicine, St. Louis, MO; supported by National Institutes of Health (NIH) Grant P30 CA-91842] for microarray hybridization services and for human tissue samples and both the Biobank and Morphology Cores of the Washington University Digestive Disease Research Core Center (NIH Grant #5P30-DK-052574). We also acknowledge the Lauren V. Ackerman Laboratory of Surgical Pathology at Barnes-Jewish Hospital (Washington University Medical Center, St. Louis, MO). We thank the Snyder and the Perlmutter labs for allowing us to take gastric tissue from their killed macaques and the DCM veterinarian, Chad Fulkner, for assisting in tissue procurement. We also thank the developers of all the software used in this manuscript: dChip, CrypSkip, MUSCLE, Mega5, Figtree, NetGene2, SIFT, Pegas, and LOSITAN. The authors also acknowledge: Drs. Reyna Victoria Palacios Gonzalez (Managua, Nicaragua) and Hala El-Zimaity (University Health Network, Toronto, Canada) for pathological diagnoses and Dr. Lawrence Paszat for funding and coordinating acquisition of Nicaraguan samples, as well as Dr. David Graham and the Texas Medical Center Digestive Diseases Center for additional funding (NIH Grant DK-56338) for acquisition of Nicaraguan specimens for RNA-Seq.
Footnotes
The online version of this article contains supplemental material.
REFERENCES
- 1. Amin SB, Shah PK, Yan A, Adamia S, Minvielle S, Avet-Loiseau H, Munshi NC, Li C. The dChip survival analysis module for microarray data. BMC Bioinformatics 12: 72, 2011 [DOI] [PMC free article] [PubMed] [Google Scholar]
- 2. Antao T, Lopes A, Lopes RJ, Beja-Pereira A, Luikart G. LOSITAN: a workbench to detect molecular adaptation based on a Fst-outlier method. BMC Bioinformatics 9: 323, 2008 [DOI] [PMC free article] [PubMed] [Google Scholar]
- 3. Beaumont MA, Nichols RA. Evaluating loci for use in the genetic analysis of population structure. Proc R Soc Lond B 263: 1619–1626, 1996 [Google Scholar]
- 4. Bredemeyer AJ, Geahlen JH, Weis VG, Huh WJ, Zinselmeyer BH, Srivatsan S, Miller MJ, Shaw AS, Mills JC. The gastric epithelial progenitor cell niche and differentiation of the zymogenic (chief) cell lineage. Dev Biol 325: 211–224, 2009 [DOI] [PMC free article] [PubMed] [Google Scholar]
- 5. Brunak S, Engelbrecht J, Knudsen S. Prediction of human mRNA donor and acceptor sites from the DNA sequence. J Mol Biol 220: 49–65, 1991 [DOI] [PubMed] [Google Scholar]
- 6. Castro LF, Lopes-Marques M, Goncalves O, Wilson JM. The evolution of pepsinogen C genes in vertebrates: duplication, loss and functional diversification. PLoS One 7: e32852, 2012 [DOI] [PMC free article] [PubMed] [Google Scholar]
- 7. Chu G, Qi S, Yang G, Dou K, Du J, Lu Z. Gastrointestinal tract specific gene GDDR inhibits the progression of gastric cancer in a TFF1 dependent manner. Mol Cell Biochem 359: 369–374, 2012 [DOI] [PubMed] [Google Scholar]
- 8. Desai MM, Plotkin JB. The polymorphism frequency spectrum of finitely many sites under selection. Genetics 180: 2175–2191, 2008 [DOI] [PMC free article] [PubMed] [Google Scholar]
- 9. Du JJ, Dou KF, Peng SY, Wang WZ, Wang ZH, Xiao HS, Guan WX, Liu YB, Gao ZQ. [Down-regulated full-length novel gene GDDR and its effect on gastric cancer]. Zhonghua Yi Xue Za Zhi 83: 1166–1168, 2003 [PubMed] [Google Scholar]
- 10. Edgar RC. MUSCLE: multiple sequence alignment with high accuracy and high throughput. Nucleic Acids Res 32: 1792–1797, 2004 [DOI] [PMC free article] [PubMed] [Google Scholar]
- 11. Gargiulo AM, Ceccarelli P, Dall'aglio C, Pedini V. Ultrastructural study on the stomach of Tilapia spp (Teleostei). Anat Histol Embryol 26: 331–336, 1997 [DOI] [PubMed] [Google Scholar]
- 12. Hanby AM, Poulsom R, Playford RJ, Wright NA. The mucous neck cell in the human gastric corpus: a distinctive, functional cell lineage. J Pathol 187: 331–337, 1999 [DOI] [PubMed] [Google Scholar]
- 13. Hebsgaard SM, Korning PG, Tolstrup N, Engelbrecht J, Rouze P, Brunak S. Splice site prediction in Arabidopsis thaliana pre-mRNA by combining local and global sequence information. Nucl Acids Res 24: 3439–3452, 1996 [DOI] [PMC free article] [PubMed] [Google Scholar]
- 14. Hu J, Ge H, Newman M, Liu K. OSA: a fast and accurate alignment tool for RNA-Seq. Bioinformatics 28: 1933–1934, 2012 [DOI] [PubMed] [Google Scholar]
- 15. Huh WJ, Khurana SS, Geahlen JH, Kohli K, Waller RA, Mills JC. Tamoxifen induces rapid, reversible atrophy, and metaplasia in mouse stomach. Gastroenterology 142: 21–24, 2012 [DOI] [PMC free article] [PubMed] [Google Scholar]
- 16. Kalyana-Sundaram S, Kumar-Sinha C, Shankar S, Robinson DR, Wu YM, Cao X, Asangani IA, Kothari V, Prensner JR, Lonigro RJ, Iyer MK, Barrette T, Shanmugam A, Dhanasekaran SM, Palanisamy N, Chinnaiyan AM. Expressed pseudogenes in the transcriptional landscape of human cancers. Cell 149: 1622–1634, 2012 [DOI] [PMC free article] [PubMed] [Google Scholar]
- 17. Karam SM, Leblond CP. Identifying and counting epithelial cell types in the “corpus” of the mouse stomach. Anat Rec 232: 231–246, 1992 [DOI] [PubMed] [Google Scholar]
- 18. Karolchik D, Hinrichs AS, Furey TS, Roskin KM, Sugnet CW, Haussler D, Kent WJ. The UCSC Table Browser data retrieval tool. Nucleic Acids Res 32: D493–D496, 2004 [DOI] [PMC free article] [PubMed] [Google Scholar]
- 19. Kouznetsova I, Laubinger W, Kalbacher H, Kalinski T, Meyer F, Roessner A, Hoffmann W. Biosynthesis of gastrokine-2 in the human gastric mucosa: restricted spatial expression along the antral gland axis and differential interaction with TFF1, TFF2 and mucins. Cell Physiol Biochem 20: 899–908, 2007 [DOI] [PubMed] [Google Scholar]
- 20. Lewontin RC, Krakauer J. Distribution of gene frequency as a test of the theory of the selective neutrality of polymorphisms. Genetics 74: 175–195, 1973 [DOI] [PMC free article] [PubMed] [Google Scholar]
- 21. Li C, Wong WH. Model-based analysis of oligonucleotide arrays: expression index computation and outlier detection. Proc Natl Acad Sci USA 98: 31–36, 2001 [DOI] [PMC free article] [PubMed] [Google Scholar]
- 22. Mao W, Chen J, Peng TL, Yin XF, Chen LZ, Chen MH. Downregulation of gastrokine-1 in gastric cancer tissues and restoration of its expression induced gastric cancer cells to apoptosis. J Exp Clin Cancer Res 31: 49, 2012 [DOI] [PMC free article] [PubMed] [Google Scholar]
- 23. Martin TE, Powell CT, Wang Z, Bhattacharyya S, Walsh-Reitz MM, Agarwal K, Toback FG. A novel mitogenic protein that is highly expressed in cells of the gastric antrum mucosa. Am J Physiol Gastrointest Liver Physiol 285: G332–G343, 2003 [DOI] [PubMed] [Google Scholar]
- 24. McDonald JH, Kreitman M. Adaptive protein evolution at the Adh locus in Drosophila. Nature 351: 652–654, 1991 [DOI] [PubMed] [Google Scholar]
- 25. Menheniott TR, Peterson AJ, O'Connor L, Lee KS, Kalantzis A, Kondova I, Bontrop RE, Bell KM, Giraud AS. A novel gastrokine, Gkn3, marks gastric atrophy and shows evidence of adaptive gene loss in humans. Gastroenterology 138: 1823–1835, 2010 [DOI] [PubMed] [Google Scholar]
- 26. Moss SF, Lee JW, Sabo E, Rubin AK, Rommel J, Westley BR, May FE, Gao J, Meitner PA, Tavares R, Resnick MB. Decreased expression of gastrokine 1 and the trefoil factor interacting protein TFIZ1/GKN2 in gastric cancer: influence of tumor histology and relationship to prognosis. Clin Cancer Res 14: 4161–4167, 2008 [DOI] [PMC free article] [PubMed] [Google Scholar]
- 27. Narum SR, Hess JE. Comparison of F(ST) outlier tests for SNP loci under selection. Mol Ecol Resour 11, Suppl 1: 184–194, 2011 [DOI] [PubMed] [Google Scholar]
- 28. Ng PC, Henikoff S. Predicting deleterious amino acid substitutions. Genome Res 11: 863–874, 2001 [DOI] [PMC free article] [PubMed] [Google Scholar]
- 29. Ogawa M, Nomura S, Varro A, Wang TC, Goldenring JR. Altered metaplastic response of waved-2 EGF receptor mutant mice to acute oxyntic atrophy. Am J Physiol Gastrointest Liver Physiol 290: G793–G804, 2006 [DOI] [PubMed] [Google Scholar]
- 30. Oien KA, McGregor F, Butler S, Ferrier RK, Downie I, Bryce S, Burns S, Keith WN. Gastrokine 1 is abundantly and specifically expressed in superficial gastric epithelium, down-regulated in gastric carcinoma, and shows high evolutionary conservation. J Pathol 203: 789–797, 2004 [DOI] [PubMed] [Google Scholar]
- 31. Ordoñez GR, Hillier LW, Warren WC, Grützner F, López-Otín C, Puente XS. Loss of genes implicated in gastric function during platypus evolution. Genome Biol 9: R81, 2008 [DOI] [PMC free article] [PubMed] [Google Scholar]
- 32. Otto WR, Patel K, McKinnell I, Evans MD, Lee CY, Frith D, Hanrahan S, Blight K, Blin N, Kayademir T, Poulsom R, Jeffery R, Hunt T, Wright NA, McGregor F, Oien KA. Identification of blottin: a novel gastric trefoil factor family-2 binding protein. Proteomics 6: 4235–4245, 2006 [DOI] [PubMed] [Google Scholar]
- 33. Otto WR, Thim L. Trefoil factor family-interacting proteins. Cell Mol Life Sci 62: 2939–2946, 2005 [DOI] [PMC free article] [PubMed] [Google Scholar]
- 34. Paradis E. pegas: an R package for population genetics with an integrated-modular approach. Bioinformatics 26: 419–420, 2010 [DOI] [PubMed] [Google Scholar]
- 35. Pink RC, Wicks K, Caley DP, Punch EK, Jacobs L, Carter DR. Pseudogenes: pseudo-functional or key regulators in health and disease? RNA 17: 792–798, 2011 [DOI] [PMC free article] [PubMed] [Google Scholar]
- 36. Ramsey VG, Doherty JM, Chen CC, Stappenbeck TS, Konieczny SF, Mills JC. The maturation of mucus-secreting gastric epithelial progenitors into digestive-enzyme secreting zymogenic cells requires Mist1. Development 134: 211–222, 2007 [DOI] [PubMed] [Google Scholar]
- 37. Rippa E, La Monica G, Allocca R, Romano MF, De Palma M, Arcari P. Overexpression of gastrokine 1 in gastric cancer cells induces Fas-mediated apoptosis. J Cell Physiol 226: 2571–2578, 2011 [DOI] [PubMed] [Google Scholar]
- 38. Roca X, Sachidanandam R, Krainer AR. Intrinsic differences between authentic and cryptic 5′ splice sites. Nucl Acids Res 31: 6321–6333, 2003 [DOI] [PMC free article] [PubMed] [Google Scholar]
- 39. Rousset F, Raymond M. Testing heterozygote excess and deficiency. Genetics 140: 1413–1419, 1995 [DOI] [PMC free article] [PubMed] [Google Scholar]
- 40. Sanchez-Pulido L, Devos D, Valencia A. BRICHOS: a conserved domain in proteins associated with dementia, respiratory distress and cancer. Trends Biochem Sci 27: 329–332, 2002 [DOI] [PubMed] [Google Scholar]
- 41. Stevens EC, Hume ID. Comparative Physiology of the Vertebrate Digestive System. Cambrige, UK: Cambridge University Press, 1995 [Google Scholar]
- 42. Stirling W. On the ferments or enzymes of the digestive tract in fishes. J Anat Physiol 18: 426–435, 1884 [PMC free article] [PubMed] [Google Scholar]
- 43. Tamura K, Peterson D, Peterson N, Stecher G, Nei M, Kumar S. MEGA5: molecular evolutionary genetics analysis using maximum likelihood, evolutionary distance, and maximum parsimony methods. Mol Biol Evol 28: 2731–2739, 2011 [DOI] [PMC free article] [PubMed] [Google Scholar]
- 44. Tang K, Thornton KR, Stoneking M. A new approach for using genome scans to detect recent positive selection in the human genome. PLoS Biol 5: e171, 2007 [DOI] [PMC free article] [PubMed] [Google Scholar]
- 45. Templeton AR. Contingency tests of neutrality using intra/interspecific gene trees: the rejection of neutrality for the evolution of the mitochondrial cytochrome oxidase II gene in the hominoid primates. Genetics 144: 1263–1270, 1996 [DOI] [PMC free article] [PubMed] [Google Scholar]
- 46. Templeton AR, Clark AG, Weiss KM, Nickerson DA, Boerwinkle E, Sing CF. Recombinational and mutational hotspots within the human lipoprotein lipase gene. Am J Hum Genet 66: 69–83, 2000 [DOI] [PMC free article] [PubMed] [Google Scholar]
- 47. The 1000 Genomes Project Consortium A map of human genome variation from population-scale sequencing. Nature: 1061–1073, 2010 [DOI] [PMC free article] [PubMed] [Google Scholar]
- 48.Tishkoff SA, Kidd KK. Implications of biogeography of human populations for ‘race’ and medicine. Nat Genet 36: S21–S27, 2004 [DOI] [PubMed] [Google Scholar]
- 49. Torrents D, Suyama M, Zdobnov E, Bork P. A genome-wide survey of human pseudogenes. Genome Res 13: 2559–2567, 2003 [DOI] [PMC free article] [PubMed] [Google Scholar]
- 50. Vigna S. Evolution of the cholecystokinin and gastrin peptides and receptors. Am Zool 40: 287–295, 2000 [Google Scholar]
- 51. Vorechovsky I. Aberrant 3′ splice sites in human disease genes: mutation pattern, nucleotide structure and comparison of computational tools that predict their utilization. Nucleic Acids Res 34: 4630–4641, 2006 [DOI] [PMC free article] [PubMed] [Google Scholar]
- 52. Westley BR, Griffin SM, May FE. Interaction between TFF1, a gastric tumor suppressor trefoil protein, and TFIZ1, a brichos domain-containing protein with homology to SP-C. Biochemistry 44: 7967–7975, 2005 [DOI] [PubMed] [Google Scholar]
- 53. Wilcox R. Kolmogorov-Smirnov test. Encyclopedia of Biostatistics 2005 [Google Scholar]
- 54. Willander H, Hermansson E, Johansson J, Presto J. BRICHOS domain associated with lung fibrosis, dementia and cancer–a chaperone that prevents amyloid fibril formation? FEBS J 278: 3893–3904, 2011 [DOI] [PubMed] [Google Scholar]
- 55. Wright S. Coefficients of inbreeding and relationship. Am Nat 56: 330–338, 1922 [Google Scholar]
- 56. Yoon JH, Kang YH, Choi YJ, Park IS, Nam SW, Lee JY, Lee YS, Park WS. Gastrokine 1 functions as a tumor suppressor by inhibition of epithelial-mesenchymal transition in gastric cancers. J Cancer Res Clin Oncol 137: 1697–1704, 2011 [DOI] [PubMed] [Google Scholar]
- 57. Yoshikawa Y, Mukai H, Hino F, Asada K, Kato I. Isolation of two novel genes, down-regulated in gastric cancer. Jpn J Cancer Res 91: 459–463, 2000 [DOI] [PMC free article] [PubMed] [Google Scholar]
Associated Data
This section collects any data citations, data availability statements, or supplementary materials included in this article.