

Abstract
Closed-loop deep brain stimulation (DBS) systems could provide automatic adjustment of stimulation parameters and improve outcomes in the treatment of Parkinson's disease and essential tremor. The evoked compound action potential (ECAP), generated by activated neurons near the DBS electrode, may provide a suitable feedback control signal for closed-loop DBS. The objectives of this work were to characterize the ECAP across stimulation parameters and determine the neural elements contributing to the signal. We recorded ECAPs during thalamic DBS in anesthetized cats and conducted computer simulations to calculate the ECAP of a population of thalamic neurons. The experimental and computational ECAPs were similar in shape and had characteristics that were correlated across stimulation parameters (R2 = 0.80–0.95, P < 0.002). The ECAP signal energy increased with larger DBS amplitudes (P < 0.0001) and pulse widths (P < 0.002), and the signal energy of secondary ECAP phases was larger at 10-Hz than at 100-Hz DBS (P < 0.002). The computational model indicated that these changes resulted from a greater extent of neural activation and an increased synchronization of postsynaptic thalamocortical activity, respectively. Administration of tetrodotoxin, lidocaine, or isoflurane abolished or reduced the magnitude of the experimental and computational ECAPs, glutamate receptor antagonists 6-cyano-7-nitroquinoxaline-2,3-dione (CNQX) and d(−)-2-amino-5-phosphonopentanoic acid (APV) reduced secondary ECAP phases by decreasing postsynaptic excitation, and the GABAA receptor agonist muscimol increased the latency of the secondary phases by augmenting postsynaptic hyperpolarization. This study demonstrates that the ECAP provides information about the type and extent of neural activation generated during DBS, and the ECAP may serve as a feedback control signal for closed-loop DBS.
Keywords: evoked compound action potential, neural recording, computational model, thalamus
deep brain stimulation (DBS) is a clinically effective treatment for movement disorders, including Parkinson's disease (PD) (Benabid et al. 1994) and essential tremor (ET) (Benabid et al. 1991; Pahwa et al. 2006), and is being investigated for other neurological disorders such as epilepsy (Hodaie et al. 2002). Present DBS systems operate in an open-loop fashion, in which patients receive invariant stimulation 24 h/day indefinitely and a physician closes the loop through periodic retuning of stimulation parameters (Kuncel and Grill 2004). The selection of stimulation parameters can be time-consuming and costly (Ondo and Bronte-Stewart 2005), may not result in optimal settings for the patient (Moro et al. 2006; Okun et al. 2005), and presents a significant clinical burden. The efficacy of therapy can be improved by more frequent parameter adjustment (Frankemolle et al. 2010; Lee et al. 2010; Moro et al. 2006), potentially compensating for progression of the disease state (Deuschl et al. 2006; Krack et al. 2003; Weaver et al. 2012). We are exploring evoked potentials as a feedback signal for closed-loop control of DBS parameters, and the objective of this work was to characterize evoked potentials during stimulation.
Closed-loop DBS systems would automatically and periodically adjust stimulation parameters to optimize symptom relief and reduce the time required for programming. One potential closed-loop feedback signal is the local field potential (LFP) recorded from the DBS electrode and reflecting synchronized network activity (Marceglia et al. 2007; Santaniello et al. 2011) that is correlated to motor symptoms in PD (Smirnov et al. 2008; Tass et al. 2010) and ET (Kane et al. 2009). Beta band (13–35 Hz) activity in PD (Brown and Williams 2005) and theta band (4–7 Hz) activity in ET (Kane et al. 2009) are disrupted by DBS (Bronte-Stewart et al. 2009; Eusebio et al. 2012; Ray et al. 2008; Rosa et al. 2011; Santaniello et al. 2011), suggesting that LFP recordings might be used to identify clinically effective stimulation parameters (Yoshida et al. 2010). Additionally, a closed-loop internal globus pallidus (GPi)-DBS system used single-unit activity from primary motor cortex (M1) as a trigger for each stimulus pulse and demonstrated greater symptom reduction than continuous, open-loop stimulation (Rosin et al. 2011).
We are investigating evoked compound action potentials (ECAPs) as a potential feedback control signal for closed-loop DBS. The ECAP is generated by the transmembrane currents of activated neurons near the electrode after each stimulation pulse and therefore provides insight into the activity of neural elements that are affected by stimulation. We previously demonstrated that ECAPs can be recorded from the DBS electrode during thalamic stimulation (Kent and Grill 2012). Similarly, clinical recordings of ECAPs made from the cochlea served as a feedback signal in the selection of stimulation parameters in cochlear implants (Jeon et al. 2010; Miller et al. 2008), and closed-loop cochlear systems have been designed (McLaughlin et al. 2012).
In this work we quantified the effects of changes in stimulation parameters on the characteristics of the ECAPs recorded during thalamic DBS in cats. Characteristic changes in the ECAP across stimulation parameters could potentially provide insight into the type and extent of neural activation during DBS. We combined administration of pharmacological agents to block specific neural elements and a computational model of thalamic DBS (Birdno et al. 2012) to determine the contribution of different neural elements to the ECAP.
MATERIALS AND METHODS
We combined experimental measurements and computational modeling to quantify changes in the ECAP across DBS parameters and to identify the neural origin of the ECAP.
In vivo ECAP recording.
We recorded the ECAPs generated during thalamic DBS in 17 male domestic short-haired cats (Table 1), initially anesthetized with ketamine HCl (35 mg/kg im) and maintained with α-chloralose (65 mg/kg iv supplemented at 15 mg/kg as needed). A ventilator maintained end-tidal CO2 at 3–4%, body temperature was maintained at 38°C with heating pads, arterial blood pressure was monitored with a catheter, and fluids were administered continuously (10–15 ml·kg−1·h−1). The Institutional Animal Care and Use Committee of Duke University reviewed and approved all animal care and experimental procedures. The methods were reported previously in detail (Kent and Grill 2012) and are reviewed briefly here. Some of the data from experiments A–C were also used in previous publications (Kent and Grill 2011, 2012).
Table 1.
Summary of in vivo experiments, including DBS electrode location as identified from histology, stimulation and recording contacts for the three contact configurations, and pharmacological agents tested in order of administration
| Stimulation (Recording) Contacts |
|||||
|---|---|---|---|---|---|
| Cat | Electrode Location | Monopolar Symmetric | Monopolar Asymmetric | Bipolar | Pharmacological Agent(s) (volume injected in μl) |
| A | VPL-VL | 1 (0+,2−) | 0 (1+,2−) | ||
| B | VA | 1 (0+,2−) | 2 (1+,0−) | ||
| C | VPL-VL | 1 (0+,2−) | 3 (2+,1−) | ||
| D | VPL-VL | 1 (0+,2−) | 0 (1+,2−) | ||
| E | VPL-VL | 1 (0+,2−) | 0 (1+,2−) | ||
| F | VPL-VL | 2 (1+,3−) | 0 (1+,2−) | 0+,2− (1+,3−) | |
| G | LGN | 1 (0+,2−) | 0 (1+,2−) | 0+,2− (1+,3−) | TTX (10) |
| H | VPL-VL | 2 (1+,3−) | 1 (2+,3−) | 0+,2− (1+,3−) | Saline (5), CNQX/APV (5) |
| I | VPL-VL | 1 (0+,2−) | 0 (1+,2−) | 0+,2− (1+,3−) | Saline (5), CNQX/APV (5) |
| J | VPL-VL* | 2 (1+,3−) | 0 (1+,2−) | 0+,2− (1+,3−) | Isoflurane, saline (5), CNQX/APV (10) |
| K | VPL-VL | 2 (1+,3−) | 3 (2+,1−) | 1+,3− (0+,2−) | Isoflurane, 2% lidocaine (20) |
| L | VPL-VL | 2 (1+,3−) | 1 (2+,3−) | 0+,2− (1+,3−) | Isoflurane, 2% lidocaine (20) |
| M | VPL-VL* | 2 (1+,3−) | 3 (2+,1−) | 0+,2− (1+,3−) | Muscimol (20) |
| N | Dorsal–thalamus | 1 (0+,2−) | 0 (1+,2−) | 0+,2− (1+,3−) | Muscimol (10) |
| O | VPL-VL | 1 (0+,2−) | 1 (2+,3−) | 0+,2− (1+,3−) | 5% Lidocaine (20), CNQX/APV (20) |
| P | VPL-VL | 1 (0+,2−) | 3 (2+,1−) | 1+,3− (0+,2−) | 10% Lidocaine (20), CNQX/APV (10) |
| Q | VPL-VL | 1 (0+,2−) | 2 (1+,0−) | 1+,3− (0+,2−) | 10% Lidocaine (20), CNQX/APV (20) |
Deep brain stimulation (DBS) electrode location was not confirmed with histology but was consistent with evoked responses recorded during sciatic nerve stimulation.
VPL, ventral posterolateral nucleus; VL, ventral lateral nucleus; VA, ventral anterior nucleus; LGN, lateral geniculate nucleus; TTX, tetrodotoxin; CQNX, 6-cyano-7-nitroquinoxaline-2,3-dione; APV, d(−)-2-amino-5-phosphonopentanoic acid.
With the cat prone and the head fixed in a stereotactic frame, a craniotomy was performed and thalamic nuclei were located with stereotactic technique and single-unit microelectrode recordings. The target implantation site was the ventrolateral (VL) nucleus of the thalamus, which is a cerebellar receiving area (Berkley 1983; Jimenez Castellanos 1949; Steriade et al. 1997) and appears to represent the feline homolog of the human ventral intermediate (Vim) nucleus of the thalamus (Steriade et al. 1997). The medial and lateral ventral posterior (VPM and VPL) nuclei form the ventrobasal complex [referred to as the ventrolateral complex by some authors (Butler and Hodos 2005)] and function as the principal somatosensory relay nuclei (Jimenez Castellanos 1949; Steriade et al. 1997). The VL thalamus also receives somatosensory input, including group I muscle afferents (Boivie 1971; Craig and Burton 1985; Hirai and Jones 1988; Jones and Burton 1974), and the border region between the VPL and VL in the cat receives converging somatosensory and cerebellar afferents (Berkley 1983). We attempted to identify the location of the VPL-VL thalamic complex through single-unit recording of neurons responding to passive movement of the contralateral hindlimb (Berkley 1983; Mallart 1968). A guide tube was then inserted into the brain with a micromanipulator, and a mini DBS electrode (Numed) was implanted through the guide tube into the VPL-VL thalamus (Fig. 1A). The mini DBS electrode had a lead body diameter of 0.625 mm and four contacts of 0.5-mm height separated by 0.5 mm. Accurate implantation was confirmed by recording with the DBS electrode responses evoked by electrical stimulation of the contralateral sciatic nerve. At the conclusion of each experiment, the anatomical location of the electrode with reference to a stereotactic atlas of the cat brain (Snider and Niemer 1961) was determined from Nissl-stained sections of formalin-fixed brain samples (McConnell et al. 2009). For all experiments, we verified that the ECAP was indeed a biological response by recording the neural activity at several time points after euthanasia and confirming that the ECAP was eventually abolished.
Fig. 1.

Experimental setup used to record evoked compound action potentials (ECAPs) in vivo during deep brain stimulation (DBS). A: a mini DBS electrode was inserted through a guide tube, implanted in the ventral lateral (VL)-ventral posterolateral (VPL) thalamic complex, and used to deliver stimulation and record the resulting ECAP. Pharmacological agents were administered through a needle cannula, with injection speed and volume controlled with a microsyringe. Modified from Kent and Grill (2012) with permission. B: example DBS contact connections used for stimulation and recording across the 3 contact configurations tested. The contacts that were not used are colored gray.
DBS was symmetric biphasic pulses with zero interphase delay. Voltage-controlled stimulation was used for clinical relevance, and parameters ranged from 1- to 3-V amplitude with 10- or 100-Hz frequency, 50 or 100 μs/phase pulse width, and both cathodic- and anodic-phase first polarities. Impedances measured between each contact and the counterelectrode were ∼1 kΩ, resulting in maximum charge of 0.3 μC/phase and maximum charge density of 30 μC/cm2. Differential ECAP recordings were made from two nonstimulating contacts and a Ag/AgCl reference electrode (model EL504, Biopac Systems) placed on the neck with our previously developed DBS-ECAP instrumentation (Kent and Grill 2012). This DBS-ECAP hardware was used to suppress the stimulus artifact, which could otherwise mask or distort experimental ECAP signals. It uses three stages of amplification, an amplifier blanking technique, and other circuit components to reduce selectively the amplitude and duration of the artifact. Three different contact configurations were used for stimulation and differential recording: monopolar stimulation between a contact on the DBS electrode and a stainless steel retractor in the ipsilateral chest with either symmetric recording contacts (monopolar symmetric) or asymmetric recording contacts (monopolar asymmetric) as well as bipolar stimulation in which stimulation and recording contacts were interleaved (Fig. 1B). ECAP recording trials were 10 s in duration and were separated by 10 s. A LabVIEW program controlled the DBS output, digital pulses to operate the DBS-ECAP instrumentation, and sampling (80 kHz) of the ECAP.
We conducted pharmacological interventions to block specific neural elements and determine the corresponding effect on the ECAP (Table 1). Most pharmacological agents were administered by local microinjection through a 22-gauge needle cannula, which was connected to a 250-μl microsyringe (model 1725, Hamilton) via saline-filled tubing (Fig. 1A). The agent was loaded at the cannula end of the injection system, and the cannula was implanted with a second micromanipulator at a distance of <1 mm anterior or posterior to the stimulation contact. Within 1 min of cannula implantation, we injected 5–20 μl of the agent at ∼5 μl/min. After administration and again after washout, ECAPs were recorded across a range of stimulation parameters with the monopolar symmetric contact configuration. Some animals received multiple pharmacological treatments, with successive administration after recovery from the prior treatment.
Agents were chosen to inhibit synaptic transmission or neural excitation. First, we blocked postsynaptic excitation by administering 6-cyano-7-nitroquinoxaline-2,3-dione (CNQX, 2.54 mM, Sigma-Aldrich) and d(−)-2-amino-5-phosphonopentanoic acid (APV, 2.15 mM, Sigma-Aldrich), which are glutamate AMPA and NMDA receptor antagonists, respectively. Second, the GABAA receptor antagonist muscimol (8.8 mM, Sigma-Aldrich) was injected to inhibit postsynaptic cells. Third, we administered sodium channel antagonists tetrodotoxin (TTX, 100 μM, EMD Chemicals) or 2–10% lidocaine HCl (0.07–0.35 M, Sigma-Aldrich) for nonselective inhibition of neural excitation. To limit dilution of lidocaine HCl by the saline present in the tubing of the microinjection system, 5 μl of mineral oil was loaded into the system to serve as a border between the saline and lidocaine (Noudoost and Moore 2011). Fourth, 2% isoflurane anesthesia was administered through the ventilator, which selectively inhibited presynaptic inputs in the rodent thalamus (Joksovic et al. 2009; Ying et al. 2009) and brain stem (Wu et al. 2004). As well, a saline control was injected to test whether the fluid flow generated by microinjection changed ECAP characteristics (Rathnasingham et al. 2004; Rohatgi et al. 2009). Because of the relatively long half-life of TTX (Boehnke and Rasmusson 2001) and CNQX/APV (Long et al. 1990) we did not wait for signal recovery from washout of these agents, and these were the final agents tested in an experiment.
Computational model of the ECAP.
We used a three-stage computational model of thalamic DBS to calculate the ECAP and determine the neural elements that contributed to the compound response (Fig. 2). The first stage was a finite element method (FEM) model used to calculate the voltages generated in the modeled tissue during DBS. The results of the FEM were coupled to the second stage, multicompartment cable models of a population of thalamocortical (TC) neurons and their presynaptic inputs, to calculate the transmembrane potentials and currents in the neural elements during DBS. In the third stage of the model, we used the reciprocity theorem to calculate the ECAP generated by the transmembrane currents of the neural elements.
Fig. 2.

Computational model of a population of thalamic neurons used to calculate ECAPs during thalamic DBS. A: the finite element method (FEM) model geometry included a mini DBS electrode implanted in a prism representation of the cat VL thalamus, all encompassed in a cylindrical representation of surrounding brain tissue (not shown). The VL thalamus contained 500 thalamocortical (TC) neurons, with cell locations indicated by dots, and presynaptic inputs from the cortex (CTx), cerebellum (CER), reticular nucleus (RN), and thalamic interneurons (TIN). The anatomical positions of the elements are shown for 1 neural unit, including the cell body, dendritic tree, and axon of the TC cell (black shapes) and the axons of the presynaptic inputs (gray lines). B: the synaptic connections made between neural elements in the model included glutamatergic and GABAergic synapses from presynaptic elements to the TC neuron. Additionally, there were excitatory 1:1 synapses between the neural elements, implemented with virtual axons. Modified from Birdno et al. (2012) with permission.
A FEM model was constructed in COMSOL Script 1.2 (COMSOL) to calculate the voltages generated by a three-dimensional representation of the mini DBS electrode within a prism representation of the cat VL thalamus (Fig. 2A) (Birdno et al. 2012). The dimensions of the thalamic nucleus were similar to the original model, except that the perpendicular distance between prism bases along the superior-inferior axis was reduced from 10 mm to 2.8 mm, which more closely matched the anatomy of the cat (Jimenez Castellanos 1949). DBS contacts 0–2 were located within the VL thalamus, where contacts were labeled 0-1-2-3 in a ventral-to-dorsal direction. The electrode and VL thalamus lay within a cylindrical representation of surrounding brain tissue, oriented parallel to the electrode with a diameter 64 times that of the electrode and centered at the electrode tip. This modeled tissue volume was sufficiently large, because doubling the diameter changed the potentials by only 4.2 ± 2.4% (mean ± SD). The tissue was homogeneous and isotropic with a resistivity of 300 Ω-cm (Moffitt and McIntyre 2005), and the resistivities of the DBS electrode contacts and insulating material were 20 × 10−6 Ω-cm and 1 × 10¹⁵ Ω-cm, respectively (Yousif et al. 2008). The boundary of the active DBS stimulation contact(s) was set to ±1 V, and the outer boundary of the cylindrical representation of the tissue was grounded. All other internal boundaries were set to a condition of continuity of normal current density. COMSOL Script created a variable-resolution mesh with ∼350,000 tetrahedral elements, which was a sufficient mesh density, as doubling the number of elements changed the potentials by only 0.2 ± 0.1%. Voltages were calculated by solving the Poisson equation at the mesh nodes with the conjugate gradient method. Since the bulk conductivity was linear, potentials generated at different stimulation amplitudes were scaled versions of the original solution.
In the second stage, the FEM solution was coupled to validated multicompartment cable models (Birdno et al. 2012; McIntyre et al. 2004) implemented in NEURON 7.1 (Hines and Carnevale 2001) (Fig. 2B). The model of a population of thalamic neurons included 500 TC neurons, with cell body locations randomly distributed within the VL thalamus, and their presynaptic inputs, including excitatory glutamatergic inputs from the cortex (CTx) and cerebellum (CER), and inhibitory GABAergic inputs from the reticular nucleus (RN) and local thalamic interneurons (TIN) (Birdno et al. 2012). The TC neurons had a multicompartment soma, initial segment, and branching dendritic tree (McIntyre et al. 2004), and the myelinated axons of the TC neurons and presynaptic inputs were represented with a double-cable model (McIntyre et al. 2002). Additionally, there were reliable 1:1 synapses (1 input spike corresponded to 1 time-delayed output spike) from TC and CTx to RN and from CTx and CER to TIN, implemented with virtual terminating axons. The synaptic time delays representing conduction of the action potentials down the virtual axons were reduced to 0.225 ms for connections to TIN and 0.3 ms for connections to RN, from the values in the original model, to match better the latency of experimentally recorded postsynaptic potentials (Ando et al. 1995). Neural elements that intersected with the electrode were removed from analysis. Furthermore, we removed the intrinsic activity applied to CTx and CER inputs and the TC somatic noise present in the original model.
The voltages calculated with the FEM were interpolated at the locations of the neural elements, scaled according to the DBS amplitude, and applied to elements with the extracellular mechanism in NEURON. The time-dependent DBS waveform was symmetric and biphasic with specified pulse width and frequency, and both cathodic- and anodic-phase first polarities were applied. The transmembrane potential and current at model compartments were calculated by backward Euler implicit integration. Neural activation was detected with a −20-mV threshold at the initial segment of the TC neuron or the proximal end of presynaptic inputs. The simulation time was 1.5 s, with a prestimulation period of 0.5 s and a 25-μs time step.
The final stage of the model was the calculation of ECAPs with the reciprocity theorem. The theorem of reciprocity states that the voltage at a particular point in space resulting from a unit current source at the electrode contact translates to the voltage that would be imposed on the contact by a unit current at the particular point (Helmholtz 1853). Applying this theorem, the FEM model was solved with a unit current source placed at the boundary of one of the recording contacts and subsequently repeated for the other recording contact. The potentials generated by the current source were interpolated at the compartment locations of the neural elements. By the reciprocity theorem, the scale factors were used to calculate the voltage impressed on the contact by transmembrane currents calculated from the NEURON simulation at each time step (Moffitt and McIntyre 2005). The voltages generated by these currents at each recording contact were summed across every compartment of all neural elements and the time-dependent ECAP calculated as the differential voltage between the two recording contacts. We accounted for the true cell density [65 cells/mm2 in 50-μm sections (Hirai et al. 1989)] by scaling the ECAP magnitude by a factor of 102. As well, we filtered the model-generated signals with two cascaded first-order 10-Hz to 10-kHz band-pass filters to replicate the filtering performed experimentally.
We used template subtraction to remove the stimulus artifact, generated by passive charging and discharging of the membrane capacitance of neural elements (Briaire and Frijns 2005), from the model-generated ECAP. The artifact template was calculated with a subthreshold stimulation train (0.01 V), with pulse width, frequency, and polarity identical to those used in the trial of interest. This template was scaled according to the amplitude of DBS in the trial of interest and subtracted from the signal (Fig. 3).
Fig. 3.

Template subtraction method used to remove the stimulus artifact from the model ECAP. Responses were calculated with a monopolar symmetric contact configuration with 100 Hz frequency and 50 μs/phase pulse width. The stimulus-triggered average ECAP (bold lines) are shown for cathodic- and anodic-phase first DBS polarities. The single trials (light traces) are also shown for the 2 polarities in dark and light gray, respectively. A: the signal calculated at 3 V included a stimulus artifact followed by the ECAP. B: a template of the stimulus artifact was calculated at a subthreshold amplitude of 0.01 V and scaled (300×) to create the artifact at 3 V. C: subtracting the artifact template from the original signal produced an artifact-free ECAP.
Model ECAPs were calculated with stimulation parameters, contact configurations, and pharmacological conditions matching those tested experimentally. We modeled the effects of TTX and lidocaine by blocking sodium channels. The effects of CNQX/APV were represented by blocking excitatory glutamatergic receptors on TC cells and 1:1 synaptic receptors on TINs. Muscimol was modeled by increasing the concentration of GABA to which GABAA receptors were exposed by 20% of the maximum concentration present in the untreated case for the entire simulation. This was based on the 15–20% of GABAA receptors bound by muscimol in cat motor thalamic nuclei (Kultas-Ilinsky et al. 1988). We also calculated the ECAP after selective inhibition of presynaptic inputs, which was the presumed effect of isoflurane. For the bipolar contact configuration, we investigated the effect on the ECAP of a ventral or dorsal shift of the electrode along its axis, such that contact 0 or 2 was outside the VL thalamus, respectively. We also modeled the ECAP generated in the internal capsule (IC), which is adjacent and lateral to the VPL-VL thalamus, by replacing the neural elements with a population of 500 passing axons with 2-μm diameter lying parallel to the DBS electrode.
Data analysis.
Stimulus-triggered averaging (64 responses for experimental signals and 8 responses for computational signals) was applied to the ECAPs to improve the signal-to-noise ratio. We quantified ECAP characteristics by calculating the signal energy of the experimental and computational ECAPs. First, any DC offset present in the stimulus-triggered averaged ECAP signal was calculated as the mean of the final 1 ms of signal and subtracted. Second, the integral of the square of the signal was calculated for different ECAP phases.
Experimental and computational ECAPs were compared both qualitatively, through analysis of waveform shape, and quantitatively, through calculation of correlation coefficients for ECAP signal energy values across stimulation parameters. Subsequently, neural element activation in the model was analyzed as the percentage of neural elements (TC neurons and presynaptic inputs from CTx, CER, TIN, and RN) that fired an action potential after a stimulus pulse within a given 0.1-ms bin and analyzed over the same time interval used for calculation of the stimulus-triggered average ECAP.
Differences in experimental ECAP characteristics across stimulation parameters were identified with the nonparametric Wilcoxon signed-rank test after a Bonferroni correction (α = 0.002) with StatView 5 (SAS Institute).
RESULTS
The characteristics of ECAPs during thalamic DBS were consistent across experiments but varied systematically with stimulation parameters. Pharmacological interventions resulted in clear changes in ECAP waveforms and provided insight into the neural origin of the different ECAP phases. The model-generated ECAPs were similar to the experimental waveforms across stimulation conditions and after pharmacological interventions and provided additional insight into the type and extent of neural element activation constituting the ECAP signal.
Experimental and computational ECAPs.
The mini DBS electrode was implanted in the VL-VPL thalamic complex accurately in 14 of 17 experiments (Table 1), and quantitative analysis of ECAP characteristics was performed using results from experiments with accurate electrode implantation.
The characteristics of ECAPs recorded with the monopolar symmetric configuration were dependent on the electrode position and DBS parameters (Fig. 4, A–E, top). Characterization of ECAPs with the monopolar asymmetric and bipolar contact configurations is presented in the appendix. ECAPs exhibited primary positive (P1) and negative (N1) phases with latencies of ∼0.25 and 0.75 ms, respectively, and secondary phases of either short latency (P2 at 1 ms and N2 at 1.5 ms) and short duration (<1 ms) or long latency (P2 at 3 ms) and long duration (on the order of 10 ms), as shown in cat Q (Fig. 4, A–D) or cat I (Fig. 4E), respectively. The secondary phase latency was always >0.7 ms. ECAPs had short-latency secondary phases in eight experiments and long-latency secondary phases in three experiments, and both types were present in three experiments (in which case the additional phases were labeled in succession as P3, N3, etc.). When the short-latency secondary response was present the electrode was generally implanted centrally within the VPL-VL thalamus or at the lateral border, while when the long-latency secondary response was present the electrode was typically located at the dorsolateral border. ECAPs were similar for cathodic- and anodic-phase first polarities (Fig. 4A). Moreover, the magnitude and duration of the phases generally increased with DBS amplitude (Fig. 4B) and pulse width (Fig. 4C). The latency of primary phases also increased with longer pulse widths, and N1 masked the secondary phases at 100-μs pulse width for cat Q (Fig. 4C). The P1 phase had a lower DBS amplitude threshold than the other phases in 5 of 14 cats, N1 had the lowest threshold in 1 cat, and P1 and N1 had the same threshold in the remaining cats. Furthermore, we never observed the presence of secondary phases without N1 also being present. Reducing DBS frequency from 100 Hz to 10 Hz led to increases in the magnitude of secondary phases and, in some experiments, also generated additional P3 and N3 phases (Fig. 4, D and E).
Fig. 4.

ECAPs recorded with the monopolar symmetric contact configuration. A–E: comparison of ECAPs recorded experimentally (top) with those calculated with the computational model (middle) and % of model elements activated in 0.1-ms bins after DBS pulses (bottom). The latter was calculated for each element type individually and is shown in a stacked bar format, in which activation of a specific type of neural element (0–100%) is given by the height of the corresponding segment within the bar. The “standard” DBS parameter set was 3 V amplitude (Amp), 100 Hz frequency (F), 50 μs/phase pulse width (PW), and cathodic-phase first polarity, and 1 parameter (polarity, Amp, PW, or F) was varied between subplots. The stimulus-triggered average ECAP (bold lines) and single trials (light traces) are shown, and ECAP phases are labeled. The experimental recordings were from cat Q (A–D) or cat I (E). The ECAP signal appears cut off at 100-Hz DBS in E because the interpulse interval (corresponding to the ECAP recording window) was 10 ms. F: model ECAP contributions individually from TC neurons or presynaptic inputs with 3 V, 10 Hz, 50 μs/phase, and both cathodic- and anodic-phase first polarities.
The signal energy of ECAPs was quantified across experiments for the entire ECAP signal and separately for the primary and secondary phases (Fig. 5A). The ECAP energy (Fig. 5B) increased with higher DBS amplitudes (P < 0.0001) and pulse widths (P < 0.002). There was also a small effect of frequency, and ECAP energy was greater at 10 Hz than at 100 Hz for amplitudes of 2 or 3 V and a pulse width of 100 μs (P < 0.002). Similar trends were observed between the signal energy of primary phases and DBS amplitude (P < 0.001) and pulse width (P < 0.002), except that no frequency effect was observed (Fig. 5C). Finally, the signal energy of secondary phases (Fig. 5D) increased with DBS amplitude (P < 0.002) and pulse width (P < 0.002) only at 10 Hz and was generally greater at 10 Hz than at 100 Hz across tested amplitudes and pulse widths (P < 0.002). This difference between DBS frequencies was not simply a reflection of cropping of the secondary phases by the shorter interpulse interval (IPI) at 100-Hz compared with 10-Hz DBS. The ECAP returned to baseline prior to the end of the IPI at 100 Hz in 10 of 14 experiments. In the other 4 experiments (cats J, L, P, and Q), the final ECAP value at the end of the IPI was only 4.9 ± 0.7% (mean ± SE, range: 0.3–23.7%) of the peak ECAP magnitude across stimulation parameters, and removing these experiments from the statistical analysis did not change the statistical significance between 10- and 100-Hz DBS as identified in Fig. 5D. The variance observed in signal energy measurements across experiments was generated both by variance between different response classes (i.e., short-latency, long-latency, or both short- and long-latency secondary phases) and by variance within each class.
Fig. 5.

Quantification of ECAP characteristics across experiments with the monopolar symmetric contact configuration. A: the ECAP signal was squared, and signal energy was calculated by integrating across the entire ECAP signal and separately for the primary phases (dark fill) and secondary phases (gray fill). B–D: signal energy values across experiments for the entire ECAP signal (B), primary phases (C), and secondary phases (D). Boxes have lines at the lower quartile, median, and upper quartile values. Statistical differences between parameters were identified with the Wilcoxon signed-rank test with Bonferroni correction: #significantly greater than 1-V DBS; ∧significantly greater than 2-V DBS; *significant difference between indicated bars (P < 0.002). Polarity was treated as a replicate.
We used a computational model of thalamic DBS to calculate the ECAP and the corresponding neural element activation. The model-generated ECAP calculated for three cell populations with different random distributions of TC locations within the VL thalamus had qualitatively similar waveform characteristics, and we used one population for all subsequent analysis.
The model ECAP waveform characteristics closely matched those of the experimentally recorded waveforms in phase polarity, magnitude, and latency across DBS parameters. For the monopolar symmetric configuration with 100-Hz DBS, model responses had the expected primary phases P1 and N1 followed by secondary phases, which included both shorter-latency P2 and N2 phases and a longer-latency positive phase (PLONG) akin to the secondary phase in cat I (Fig. 4, A–E, middle). Greater DBS amplitudes and pulse widths typically led to increases in the magnitude and/or duration of ECAP phases. The latency of the P1 phase also increased with a longer pulse width. Moreover, model ECAPs were similar for opposite stimulation polarities. Finally, when DBS frequency was reduced from 100 to 10 Hz, the model response exhibited additional secondary phases, P3 and N3, and increases in the magnitude of existing secondary phases, as observed experimentally. There were strong correlations between the signal energies of the model-generated and experimental ECAPs (Fig. 6). Both the computational and experimental ECAP signal energies had low values for secondary phases at 100-Hz DBS, and data were log-transformed to allow for a linear regression (Fig. 6C).
Fig. 6.

Correlation between values of ECAP signal energy from the computational model and in vivo experiments, measured with the monopolar symmetric configuration, for the entire ECAP signal (A), primary phases (B), and secondary phases (C; log-transformed). Each data point corresponds to computational and median experimental signal energy values for a single set of stimulation parameters. The size of the data point is proportional to the DBS amplitude (1–3 V), and color indicates the corresponding DBS pulse width and frequency. Polarity was treated as a replicate. The correlation coefficients for the linear trend lines (black lines) are provided (P < 0.002).
We used the model to deconstruct the ECAP signal and determine the neural elements contributing to the ECAP components. Monopolar stimulation generated direct activation of all model elements, but predominantly presynaptic elements, within ∼0.6 ms of pulse onset, which corresponded in time with the primary P1 and N1 phases (Fig. 4, A–E, bottom). Subsequently, TC neurons and inputs from RN and TIN were postsynaptically activated in the 0.9–3.1 ms window, aligning with both the short- and long-latency secondary phases. The RN inputs were then reactivated via the TC-to-RN excitatory synapse in the 4.4–6.3 ms window and contributed to the long-latency secondary phase (PLONG) (Fig. 4E). We selectively recorded the potentials generated by either individual activation of the TC neurons or the presynaptic inputs to determine their corresponding ECAP contributions and found that the former was primarily responsible for the P1, P3-N3, and PLONG phases, whereas the latter generated the N1 and P2-N2 phases and contributed to the PLONG phase (Fig. 4F). Increasing DBS amplitude or pulse width generated a greater extent of direct neural excitation, which paralleled an increase in magnitude and/or duration of primary ECAP phases. In some cases, this also led to a corresponding increase in postsynaptic activation and larger secondary ECAP phases. Decreasing DBS frequency from 100 Hz to 10 Hz reduced the extent of RN and TIN postsynaptic activity and increased the synchronization of TC postsynaptic activity (i.e., a shorter activation window). The latter may have been responsible for generation of P3-N3 and increase in magnitude and duration of PLONG. Finally, stimulation of a population of parallel axons, representing a lateral shift toward the IC that was characteristic of electrode placement in some experiments, generated neural activation in the range of 0.9–1.8 ms and a corresponding negative ECAP phase with this same latency (Fig. 7A).
Fig. 7.

Model ECAPs calculated from a population of parallel axons with the monopolar symmetric (A) or bipolar (B) contact configuration. The DBS parameters were 3 V, 10 Hz, 50 μs/phase, and both cathodic- and anodic-phase first polarities. The stimulus-triggered average ECAP is shown overlapping the single trials (top), and the percentage activation of the parallel axons in 0.1-ms bins after DBS pulses for cathodic-phase first polarity is also provided (bottom). There was a small residual artifact for the bipolar configuration after template subtraction, observed as inverted peaks for opposite stimulation polarities.
Pharmacological interventions.
We quantified the effect on ECAP characteristics of pharmacological agents to determine the neural origin of the ECAP. Saline microinjection generated negligible changes in two of three cats tested (Fig. 8A) and a moderate increase in N1 in cat J, which may have still been recovering from isoflurane administration. Microinjection of CNQX/APV led to a large reduction in the magnitude and duration of both short- and long-latency secondary phases in four of six cats (Fig. 8A). CNQX/APV also caused a decrease (3 cats) or an increase (1 cat) in the magnitude of N1, and P1 was reduced in two of these cats. Administration of muscimol shifted secondary phases toward longer latencies and generated a shorter-latency negative signal feature (NMUSC) following N1 in both cats tested (Fig. 8B). A similar but less pronounced negative signal feature was also observed after administration of CNQX/APV in cat I (Fig. 8A) and lidocaine in cat K but was not reproduced in any other experiment. ECAP signal recovery from the effects of muscimol was observed after a 1-h washout in one of two cats tested (Fig. 8B).
Fig. 8.
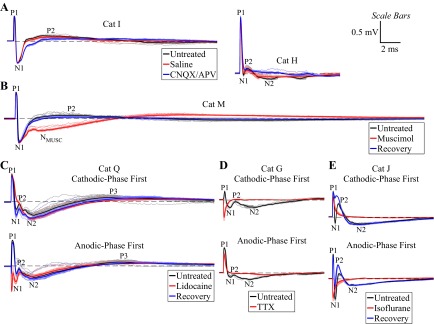
Effect of pharmacological interventions on the ECAPs measured with the monopolar symmetric contact configuration from different experiments (see Table 1). DBS was applied with 3 V, 10 Hz, and 50 or 100 μs/phase and with cathodic-phase first polarity unless otherwise denoted. Stimulus-triggered average ECAP (bold lines) and single trials (light traces) are shown. Dashed line indicates 0 mV. ECAP phases are labeled on the untreated traces. A: signal recorded before treatment and 5 min after administration of 5 μl of saline or 5 μl of 6-cyano-7-nitroquinoxaline-2,3-dione (CNQX)/d(−)-2-amino-5-phosphonopentanoic acid (APV). B: signal recorded before treatment, 5 min after administration of 20 μl of muscimol, and after recovery following a 1-h washout period. A negative phase (NMUSC) was generated after muscimol administration that was not observed in the untreated condition. C: signal recorded before treatment, 5 min after administration of 20 μl of 10% lidocaine, and after recovery following a 2-h washout period. D: signal recorded before treatment and 20 min after administration of 10 μl of tetrodotoxin (TTX). E: signal recorded before treatment, 10 min after administration of isoflurane anesthesia, and after recovery following a 1-h washout period. The ECAP signal was abolished with administration of TTX and isoflurane and reduced with lidocaine, and the resulting signals contained residual stimulus artifact observed as inverted peaks for opposite stimulation polarities.
Administration of 5–10% lidocaine reduced the ECAP magnitude, with recovery of the signal observed after at least 30 min in two of three cats (Fig. 8C). Conversely, 2% lidocaine led to relatively small and inconsistent changes in ECAP characteristics in two of two cats. Microinjection of TTX completely eliminated the ECAP in the one cat tested (Fig. 8D). Administering isoflurane anesthesia also completely abolished the signal (Fig. 8E) in two of three cats, whereas only P1 was eliminated in the other cat. The ECAP recovered in two of three cats after cessation of isoflurane administration and a washout period of at least 30 min.
The model was also used to simulate the effects of the pharmacological interventions performed experimentally. Administration of CNQX/APV was modeled by blocking excitatory receptors on TC and TIN, which eliminated postsynaptic activation of these elements relative to the untreated case (Fig. 9, A and B). Furthermore, CNQX/APV resulted in reduced direct activation of TC neurons due to the decrease in excitatory input, hyperpolarization of TC somata, and an increased stimulation threshold (Fig. 9B). These changes were manifested as a reduction in secondary ECAP phases, while primary phases were relatively unaffected. The residual secondary phase activity was generated by postsynaptic activation of RN inputs and was eliminated by inhibiting all model synapses (Fig. 9C). Administration of muscimol was modeled as an increase in the concentration of GABA at GABAergic receptors on TC neurons and led to hyperpolarization of TC somata (Fig. 9D). As a result, direct activation of TC neurons was reduced and postsynaptic activation was either inhibited in some cells or delayed in others. The effect on the ECAP was evident in secondary phases P3, N3, and PLONG as a shift toward longer latencies, which matched the changes observed experimentally. Blocking sodium channels abolished all neural activation and the corresponding ECAP (Fig. 9E), as observed with experimental administration of TTX and to a lesser extent with lidocaine. Selectively inhibiting presynaptic inputs, presumed to be the mechanism of action of isoflurane (Joksovic et al. 2009; Wu et al. 2004; Ying et al. 2009), abolished all ECAP phases except P1, which differed from the experimental effect, where the ECAP was completely eliminated in a majority of experiments.
Fig. 9.

Simulation of effects of pharmacological agents on the model-generated ECAP. The ECAP (top) and % of neural elements activated in 0.1-ms bins after the DBS pulse (bottom) are shown for the untreated case (A) and after inhibition of excitatory receptors on TC and TIN (B), inhibition of all synapses (C), addition of a GABAA agonist (D), inhibition of sodium channels (E), and inhibition of presynaptic inputs (F). The monopolar symmetric contact configuration was used, with DBS applied with 3 V, 10 Hz, 50 μs/phase, and both cathodic- and anodic-phase first polarities. Percentage activation is shown for cathodic-phase first polarity. Insets in B and D show the transmembrane potential recordings from TC somata after a DBS pulse applied at t = 2 ms for the untreated case and after pharmacological intervention. The cell hyperpolarization generated by inhibition of excitatory synapses blocked direct activation of the TC cell. Similarly, cell hyperpolarization generated by the presence of the GABAA agonist led to inhibition of postsynaptic activity in soma A and delayed generation of an action potential in soma B.
DISCUSSION
This study characterized the evoked potentials generated by DBS, quantified their dependence on stimulation parameters, and determined the neural elements contributing to the different phases of the ECAP. For the monopolar symmetric configuration, primary phases corresponded to direct neural activation and secondary phases to postsynaptic activation. The ECAP phases increased in magnitude and/or duration with DBS amplitude and pulse width, suggesting a greater extent of neural activation, and were modulated by DBS frequency due to changes in postsynaptic activity. If these systematic changes in ECAP characteristics observed across stimulation parameters are correlated with changes in symptoms, the ECAP may be suitable as a feedback control signal for closed-loop DBS systems. Furthermore, these ECAP signatures of clinical efficacy could inform design of electrodes and stimulation methods for selective stimulation of the neural elements mediating the symptom-relieving effects of DBS. Finally, the electrode position-dependent character of the ECAP may provide a signal useful for electrode targeting during implantation or contact selection during programming of stimulation parameters.
Neural origin of ECAP phases.
We combined experimental pharmacology with model-based deconstruction to identify the neural elements that generated the different components of the ECAP. The primary P1 and N1 phases occurred at latencies of <1 ms and were generated by direct neural excitation. This was evident from the direct activation of model elements within 0.6 ms and by the lack of any consistent effect on these phases of pharmacological agents targeting synaptic transmission. More specifically, the model indicated that P1 was generated by TC neuron activation and N1 by presynaptic axon activation. Local circuit currents generated by action potential propagation in the TC neuron would be expected to generate a triphasic waveform with a dominant negative phase at an external recording contact (Gold et al. 2006). Since the TC axon projects past the dorsal, negative recording contact, this would be recorded predominantly as a positive voltage, and therefore result in the P1 phase. Likewise, presynaptic inputs, including CER and CTx inputs, project past both the positive and negative recording contacts, respectively, and would result in contributions to ECAP phases of both polarities, including the N1 phase.
The secondary phases of the ECAP recorded with the monopolar symmetric configuration occurred at latencies >0.7 ms and were generated by postsynaptic activation. This conclusion was supported by several results, including the postsynaptic activation of model elements in the 0.9–6.3 ms window, the effects of DBS frequency on secondary phases, the reduction in magnitude with application of glutamate receptor antagonists CNQX/APV, and the invariable association between the presence of N1 generated by presynaptic inputs and the secondary phases in experimental recordings. The model indicated that the short-latency secondary phases were generated by postsynaptic activation of TC, RN, and TIN elements, whereas long-latency phases apparently resulted from late postsynaptic activation of TC neurons and from the reexcitation of RN by these TC neurons in the 4.4–6.3 ms window. These long-latency phases were observed in 6 of 14 experiments, and in these experiments the electrode was implanted near the dorsal and/or lateral VPL-VL thalamic border, potentially near local RN cells receiving input from TC neurons or near passing axons within the IC. Therefore, postsynaptic activation of RN local cells, which were not explicitly represented in the model, may have also contributed to the longer-latency secondary phase. On the other hand, IC axons were directly activated at a latency of 0.9–1.8 ms and were therefore unlikely to be the source of these phases with latencies >3 ms. An additional source of the long-latency secondary phases could have been activation derived from reciprocal thalamocortical-corticothalamic connections (Briggs and Usrey 2007; Hersch and White 1981), which also were not represented in the model. The average time required for action potential propagation in the reciprocal pathway from the lateral geniculate nucleus (LGN) of the thalamus to the primary visual cortex and back to the LGN in nonhuman primates was 9.3 ms (Briggs and Usrey 2007), which was within the latency range observed for long-latency secondary ECAP phases measured in this study.
Identification of neural elements through pharmacological interventions.
Specific pharmacological interventions enabled identification of the neural elements contributing to the different phases of the ECAP. First, the predominant effect of CNQX/APV was a reduction in postsynaptic activity and corresponding secondary ECAP phases, but there were also changes to the primary ECAP phases recorded experimentally and associated with direct neural excitation. The latter may have resulted from a reduced direct excitability of TC neurons due to a decrease in the relative strength of excitatory inputs, although the model suggested this would have a negligible effect on primary phases. Alternatively, the effect of CNQX/APV on experimentally recorded primary phases could have been generated by antagonism of the thalamic triad in the VL thalamus. In this thalamic triad, a CER afferent makes synaptic connections to both a postsynaptic TC dendrite and a presynaptic input from a local interneuron, and the latter establishes synaptic contact with the same TC dendrite (Sato et al. 1996). There is evidence for AMPA and NMDA receptors on the presynaptic inputs from local interneurons in a similar triad arrangement within the LGN of cats (Sherman 2004). Therefore, antagonism of the triad arrangement in the VL thalamus by CNQX/APV could have decreased the direct excitability of TIN inputs and reduced the amplitude of primary phases, particularly the N1 phase. Because the thalamic triad was not explicitly represented in the model, an effect of CNQX/APV on primary ECAP phases would not have been observed.
Second, hyperpolarization of TC neurons by muscimol reduced their propensity for direct activation and inhibited or delayed postsynaptic activation, with the latter shifting the secondary ECAP phases toward longer latencies. A novel negative phase feature was also revealed after injection of muscimol and in some experiments after delivery of CNQX/APV and lidocaine. This could have been otherwise masked by other secondary ECAP phases and may have corresponded to the early latency P2-N2 phases generated by postsynaptic activation of TIN (Fig. 9D).
Third, inhibiting neural activation with lidocaine or TTX generally led to a reduction or abolition of all ECAP phases, respectively. Whereas Levy and colleagues found that 2% lidocaine was sufficient to reduce neural activity at least 0.78 mm from the injection site (Levy et al. 2001), we observed ECAP reduction only with higher concentrations of 5–10%, more closely matching results from Boehnke and Rasmusson (2001). The smaller effect of lidocaine relative to TTX may be explained by the use-dependent effects in neurons of the former (Balser et al. 1996; Courtney 1975; Khodorov et al. 1976; Strichartz 1973) but not the latter (Cohen et al. 1981; Ulbricht and Wagner 1975) or from the larger effective spread of TTX compared with lidocaine (Boehnke and Rasmusson 2001).
Fourth, we found that isoflurane abolished the ECAP, suggesting nonselective inhibition of both pre- and postsynaptic elements. Whereas some studies identified selective inhibition of presynaptic afferents by isoflurane (Joksovic et al. 2009; Wu et al. 2004; Ying et al. 2009), another study found an increase in GABAergic inhibition and depression of glutamate release (Detsch et al. 2002), which would be expected to decrease the excitatory drive of postsynaptic TC neurons. In fact, the selective elimination of P1 in one experiment after administration of isoflurane is indicative of selective TC inhibition, although this was not a consistent result across experiments.
There was a residual stimulus artifact in the recordings after neuronal inhibition following administration of TTX, isoflurane, or lidocaine. Similar results were observed in a previous study at 5 min after euthanasia, and it was hypothesized that the artifact size increased in the postmortem condition because of the generation of tissue inhomogeneities and/or decreases in tissue conductivity and permittivity (Kent and Grill 2012). Similarly, it is possible that microinjection generated local changes in conductivity near the electrode and thereby increased the size of the artifact. Alternatively, a latent artifact may have been present in the untreated condition and distorted the short-latency ECAP phases.
Effect of DBS parameters on the ECAP.
Changes in ECAP characteristics across DBS parameters measured experimentally and calculated with the computational model were in strong agreement and provided insight into the effect of stimulation parameters on neural activation.
Delivery of stimulus pulses with opposite polarities generated similar neural responses. This suggested that a polarity averaging technique (Brown and Abbas 1990) could reduce the stimulus artifact with minimal error. The small effect of polarity on the neural response was expected for symmetric, biphasic pulses delivered with monopolar and bipolar contact configurations (Kent and Grill 2012; McIntyre and Grill 2000). In contrast, applying opposite stimulation polarities with the asymmetric waveforms used in clinical DBS systems can generate differential effects on neural activation (McIntyre and Grill 2000; Wang et al. 2012) and clinical outcomes (Yousif et al. 2012).
Increasing DBS amplitude and pulse width led to an increase in ECAP amplitude and signal energy, reflecting a greater extent of direct neural activation, which could in turn generate additional postsynaptic activation. Compared with the model, the experimental waveforms exhibited smaller changes in ECAP magnitude across DBS amplitudes (Fig. 4B). This may have resulted from a neural stun or microlesion effect of nearby elements following experimental electrode implantation, which could reduce differences in the volume of tissue activated across stimulation amplitudes. This was confirmed in the computational model by removing neural elements that passed within 200 μm of the DBS electrode, after which we observed smaller relative increases in ECAP magnitude with greater DBS amplitudes (data not shown). Using a longer pulse width increased the latency of primary ECAP phases, which could have been caused by activation of higher-threshold neural elements (Kuncel and Grill 2004) near the end of the longer pulse. These elements would make longer-latency contributions to the recorded ECAP and shift the time at which the phases were observed.
Decreasing the frequency from 100 Hz to 10 Hz resulted in an increase in the number and magnitude of secondary phases. This could arise from neurotransmitter depletion and less reliable synaptic transmission at high frequencies (Anderson et al. 2006; Urbano et al. 2002; Wang and Kaczmarek 1998; Wesseling and Lo 2002; Zucker and Regehr 2002). However, neurotransmitter depletion was not represented in the model, and, on the contrary, the model exhibited greater postsynaptic activation of RN and TIN at 100 Hz. Alternatively, the model indicated that there was increased synchronization of postsynaptic TC activity at 10 Hz, and this may have contributed to the additional phases and increase in magnitude and/or duration of existing ECAP phases. Clinical symptoms are suppressed only at high DBS frequencies and low frequencies are ineffective or may lead to exacerbation (Birdno and Grill 2008), and the extent of postsynaptic synchronization may contribute to this frequency dependence.
We found that TC neurons corresponding to P1 had the lowest activation threshold in five experiments, presynaptic inputs corresponding to N1 had a lower threshold in just one experiment, and thresholds were similar in the remaining experiments. Although activation occurs at the axon for both elements (McIntyre and Grill 1999), the TC neuron initial segment may be hyperexcitable and thereby have lower thresholds than presynaptic inputs. Conversely, Baldissera and colleagues applied stimulation to the feline red nucleus and found that the threshold of the preterminal segment of presynaptic interpositorubral efferents was only 10% of that for the postsynaptic rubrospinal fibers (Baldissera et al. 1972). Moreover, our model results indicated that presynaptic inputs had a lower threshold than TC neurons, with greater activation of the former at 1 V (Fig. 4B). Therefore, in light of this contradictory evidence, the relative thresholds of pre- and postsynaptic elements in the VPL-VL thalamus remain unclear. The responses in these experiments were recorded at only three stimulation amplitudes, resulting in relatively crude estimates of relative thresholds, which may have contributed to these inconclusive findings.
The consistent effects of stimulation parameters on ECAP characteristics suggest that the ECAP could be used to identify stimulation parameters that generate a sufficient extent of activation of the appropriate types of neural elements. The ECAP signal energy may indicate the extent of neural activation and, if correlated with changes in symptoms, could be used to set the DBS amplitude and pulse width. The signal energy takes into account changes in either the magnitude or the duration of ECAP phases and may be a more robust measure of neural activation than the ECAP magnitude alone. Similarly, the energy of secondary ECAP phases may enable identification of the critical DBS frequency above which pathological firing patterns are masked and symptoms are suppressed (Birdno and Grill 2008; Kuncel et al. 2007). The ECAP could also be used to distinguish between activation of presynaptic inputs or postsynaptic cells that are associated with clinical benefit or side effects. For example, it is hypothesized that Vim-DBS provides tremor suppression in ET by activating cerebellar axonal inputs (Birdno et al. 2012), whereas paresthesias are caused by stimulation of local neurons within the adjacent ventral caudal (Vc) nucleus of the thalamus (Lenz et al. 1993). Similarly, it is thought that treatment of PD with DBS in the subthalamic nucleus (STN) is effective through activation of presynaptic cortico-STN afferents (Gradinaru et al. 2009), whereas stimulation of passing axons in the IC causes side effects (Krack et al. 2002; Tamma et al. 2002). The ECAP could be used to test these hypotheses and enable selective targeting of elements required for therapy.
Experimental and computational limitations.
There were several limitations in this work that should be addressed. First, we did not investigate the relationship between ECAP characteristics and the pathological symptom response to DBS, as required to demonstrate that the ECAP is a viable feedback control signal for closed-loop DBS. Second, use of general anesthetics may have affected neural activity and the corresponding experimental ECAP response. Ketamine is a NMDA receptor antagonist (Kemp and McKernan 2002) and may have decreased postsynaptic activation and the corresponding secondary ECAP phases. The mechanisms of action of α-chloralose remain unclear (Posner and Burns 2009), and so the resulting effect on the ECAP is uncertain.
We determined the neural origin of ECAPs with pharmacological interventions, but there were several potential limitations in our approach. First, although we found that administration of 5 μl of saline control typically had a negligible effect on the ECAP, we delivered up to 20 μl of some pharmacological agents, and therefore we cannot be certain that these larger volumes would not have affected the ECAP because of the mechanical forces of fluid flow. However, this was likely mitigated by the use of a constant injection rate. Second, the volume of a specific pharmacological agent necessary for ECAP modulation varied between experiments, which likely resulted from slight differences in the relative distance between the injection cannula and the DBS electrode. Third, the administration of multiple agents in some experiments may have caused interaction effects on the ECAP characteristics if recovery from one agent was not complete when another agent was delivered.
The computational model corroborated identification of neural elements contributing to the ECAP but also had several limitations. First, the geometrical representation of the VL thalamus was an approximation (Jimenez Castellanos 1949) based on the human Vim thalamus (Birdno et al. 2012) with a reduced dimension along the superior-inferior axis. Using a more accurate morphology of the cat VL thalamus, including the true anatomical shape from a cat brain atlas, accurate fiber trajectories, and correct relative positioning of the DBS electrode, might have changed neural activation and the calculated ECAP response. The use of a simplified prism representation of the nucleus may have contributed to the differences between the experimental and computational ECAPs. Second, while the use of a population of 500 local neurons generated ECAPs that were consistent across different cell distributions, the responses were not identical. However, there existed a trade-off between further increasing cell density to reduce this variability and maintaining a shorter computational time by minimizing the number of cells used. Third, we did not account for the electrode-tissue interface, tissue capacitance, or tissue inhomogeneities in our model, which would lead to filtering of both the potentials generated by DBS (Butson and McIntyre 2005; Grant and Lowery 2010; Lempka et al. 2010; Tracey and Williams 2011; Yousif et al. 2008) and the ECAP signal (Bedard et al. 2004, 2006). Low-pass filtering of the latter would reduce the high frequency fluctuations observed in the computational ECAP and likely produce a closer match between computational and experimental waveforms.
GRANTS
This work was supported by National Institute of Neurological Disorders and Stroke Grant R01 NS-079312, National Institutes of Health Fellowship F31 NS-070460, and the Duke University Department of Biomedical Engineering Robert Plonsey Fellowship. Computational facilities were provided through the Duke University Shared Cluster Resource.
DISCLOSURES
No conflicts of interest, financial or otherwise, are declared by the author(s).
AUTHOR CONTRIBUTIONS
Author contributions: A.R.K. and W.M.G. conception and design of research; A.R.K. performed experiments; A.R.K. analyzed data; A.R.K. and W.M.G. interpreted results of experiments; A.R.K. prepared figures; A.R.K. drafted manuscript; A.R.K. and W.M.G. edited and revised manuscript; A.R.K. and W.M.G. approved final version of manuscript.
ACKNOWLEDGMENTS
The authors thank Dr. Dennis Turner for assistance with stereotactic electrode placement, Gilda Mills for animal care and surgical assistance, and Siddhartha Kosaraju for contributions to computational model development and assistance with the cat experiments.
APPENDIX
In addition to measuring ECAPs with the monopolar symmetric contact configuration, we also conducted experimental and computational ECAP recordings with the monopolar asymmetric and bipolar contact configurations.
Monopolar asymmetric configuration.
The experimental ECAPs recorded with the monopolar asymmetric configuration included primary negative (N1′) and positive (P1′) phases at latencies of 0.23 and 0.5 ms, respectively, followed by a secondary negative phase (N2′) at ∼2 ms (Fig. 10, A–D, top). Similarly, the model ECAP had primary N1′ and P1′ phases, although the smaller-magnitude secondary N2′ phase observed experimentally was not prominent in the model at 100 Hz (Fig. 10, A–D, bottom). Experimental ECAPs exhibited similar waveform shapes for opposite stimulation polarities (Fig. 10A), although the positive and negative phases were consistently greater in magnitude with cathodic- and anodic-phase first polarities, respectively. In contrast, the magnitude of primary phases was larger with cathodic-phase first polarity for the computational ECAPs. In addition, the magnitude of the experimental and computational ECAPs increased with DBS amplitude (Fig. 10B) and pulse width (Fig. 10C). Finally, using a lower DBS frequency in the model led to the generation of a small N2′ phase, which was present experimentally but unaffected by frequency (Fig. 10D).
Fig. 10.

ECAPs recorded with the monopolar asymmetric contact configuration. A–D: comparison of ECAPs recorded experimentally (cat H, top) and calculated with the computational model (bottom). Since the same stimulation contact was used as in Fig. 4, the % neural activation was identical and is therefore omitted here. Data presentation is otherwise similar to Fig. 4. The N1′ phase is masked in C for a pulse width of 100 μs/phase because of amplifier blanking with the DBS-ECAP instrumentation. E: analysis of the neural origin of the computational ECAP. Left: diagram of the prism representation of the VL thalamus, implanted DBS electrode (stimulation and recording contacts identified), and axon node locations of the elements from 1 neural unit (TC and CTx nodes are overlapping). This is viewed from an anterior position perpendicular to the electrode axis. Right: ECAPs recorded from all elements in the neural unit and selectively from the TC neuron and CTx input (other elements had negligible contribution). The corresponding transmembrane potential is shown at selected nodes in the TC axon during action potential propagation, with nearly identical recordings made in the CTx axon. The N1′ phase was generated by action potential propagation near the positive recording contact and P1′ by subsequent propagation near the negative recording contact.
Using the model, we found that the ECAP recorded with the monopolar asymmetric configuration was generated by action potential propagation in TC neurons and CTx inputs. The contribution of the other neural elements to the ECAP was negligible. The action potential was initiated at a site near the stimulation contact, and local circuit currents generated the negative N1′ phase with propagation near the positive recording contact, followed by a positive P1′ phase with propagation near the negative recording contact (Fig. 10E). The propagation speed and corresponding latency difference between model ECAP primary phases were in agreement with the typical latency difference of 0.2–0.3 ms observed experimentally. The small-magnitude N2′ phase observed experimentally corresponded in time with postsynaptic activation of model elements (Fig. 4 and Fig. 10). However, the lack of DBS frequency effects on N2′ suggested another source, and this may have instead been generated by potassium ion efflux during membrane repolarization at the trailing edge of the action potential (Gold et al. 2006).
Bipolar configuration.
For the bipolar contact configurations, there were two experimental ECAP waveform variants. The first variant had primary negative (N1″) and positive (P1″) phases at ∼0.2 and 0.5 ms (always <0.8 ms across experiments) and a secondary negative (N2″) phase at 1.1 ms (Fig. 11, A–D, top). In the second variant, these ECAP phases were inverted (data not shown). Of the 12 experiments in which the bipolar configuration was tested, 4 generated responses of the initial negative phase variant, 7 generated responses with the initial positive phase variant, and 1 generated a large artifact that masked the ECAP. The electrode was generally implanted near the ventral or dorsal border of the VPL-VL thalamus when the initial negative variant was observed and centrally or near the lateral border of the target nuclei when the initial positive variant was recorded. The model ECAP had primary N1″ and P1″ phases followed by a secondary N2″ phase, which were observed in the initial negative phase variant of the responses seen experimentally (Fig. 11, A–D, middle). The effect of DBS parameter adjustment on ECAP characteristics was similar to that observed for the monopolar asymmetric configuration, except that the secondary phase (N2″) was modulated by frequency in both the experimental and model conditions, typically being slightly larger at 10 Hz than at 100 Hz.
Fig. 11.

ECAPs recorded with the bipolar contact configuration. A–D: comparison of experimental ECAPs (cat I, top), computational ECAPs (middle), and % activation of model elements (bottom). Data presentation is similar to Fig. 4, except that experimental ECAPs for B were collected at 10 Hz DBS frequency because of high noise in 1 response at 100 Hz. The N1″ phase is masked in C for a pulse width of 100 μs/phase because of amplifier blanking with the DBS-ECAP instrumentation. E: effect on the model ECAP of a dorsal or ventral shift of the DBS electrode with respect to the VL thalamus. Stimulation parameters were 3 V, 10 Hz, 50 μs/phase, and both cathodic- and anodic-phase first polarities. F: selective recording of the contribution of TC neurons or presynaptic inputs to the model ECAP. The same parameters were used as in E.
We attempted to reproduce the apparent dependence of experimental waveform characteristics recorded with the bipolar configuration on the electrode location by implementing in the model a dorsal or ventral shift of the electrode (Fig. 11E) or placing the electrode within a population of parallel IC axons (Fig. 7B). These alternate electrode positions approximated the experimental electrode locations at the dorsal, ventral, or lateral border of the VL thalamus. Whereas the model indicated that the original, central location or a dorsal shift generated ECAPs similar to the initial negative phase variant observed experimentally, a ventral shift or lateral position near the population of parallel axons generated responses of the initial positive phase variant. Both the experimental and computational results suggested that the response recorded with the bipolar configuration was particularly sensitive to electrode position.
The temporal pattern of neural activation observed for the monopolar symmetric configuration was very similar for bipolar stimulation (Fig. 11, A–D, bottom). The primary phases corresponded to direct neural excitation and the secondary phases to postsynaptic activation. Selectively recording the ECAP contribution from presynaptic inputs and TC neurons indicated that the former were primarily responsible for all of the phases, N1″, P1″, and N2″ (Fig. 11F).
Bipolar stimulation led to a greater extent of activation compared with monopolar stimulation. This was reflected in the larger-magnitude ECAPs with bipolar stimulation observed in experiments that used the same recording contacts for both configurations (data not shown) and in the extent of neural activation of model elements between these configurations (Fig. 4 and Fig. 11). This result can be explained by the generation of neural activation near both contacts with bipolar stimulation when using symmetric, biphasic pulses.
REFERENCES
- Anderson TR, Hu B, Iremonger K, Kiss ZH. Selective attenuation of afferent synaptic transmission as a mechanism of thalamic deep brain stimulation-induced tremor arrest. J Neurosci 26: 841–850, 2006 [DOI] [PMC free article] [PubMed] [Google Scholar]
- Ando N, Izawa Y, Shinoda Y. Relative contributions of thalamic reticular nucleus neurons and intrinsic interneurons to inhibition of thalamic neurons projecting to the motor cortex. J Neurophysiol 73: 2470–2485, 1995 [DOI] [PubMed] [Google Scholar]
- Baldissera F, Lundberg A, Udo M. Stimulation of pre- and postsynaptic elements in the red nucleus. Exp Brain Res 15: 151–167, 1972 [DOI] [PubMed] [Google Scholar]
- Balser JR, Nuss HB, Romashko DN, Marban E, Tomaselli GF. Functional consequences of lidocaine binding to slow-inactivated sodium channels. J Gen Physiol 107: 643–658, 1996 [DOI] [PMC free article] [PubMed] [Google Scholar]
- Bedard C, Kroger H, Destexhe A. Model of low-pass filtering of local field potentials in brain tissue. Phys Rev E Stat Nonlin Soft Matter Phys 73: 051911, 2006 [DOI] [PubMed] [Google Scholar]
- Bedard C, Kroger H, Destexhe A. Modeling extracellular field potentials and the frequency-filtering properties of extracellular space. Biophys J 86: 1829–1842, 2004 [DOI] [PMC free article] [PubMed] [Google Scholar]
- Benabid AL, Pollak P, Gervason C, Hoffmann D, Gao DM, Hommel M, Perret JE, de Rougemont J. Long-term suppression of tremor by chronic stimulation of the ventral intermediate thalamic nucleus. Lancet 337: 403–406, 1991 [DOI] [PubMed] [Google Scholar]
- Benabid AL, Pollak P, Gross C, Hoffmann D, Benazzouz A, Gao DM, Laurent A, Gentil M, Perret J. Acute and long-term effects of subthalamic nucleus stimulation in Parkinson's disease. Stereotact Funct Neurosurg 62: 76–84, 1994 [DOI] [PubMed] [Google Scholar]
- Berkley KJ. Spatial relationships between the terminations of somatic sensory motor pathways in the rostral brainstem of cats and monkeys. II. Cerebellar projections compared with those of the ascending somatic sensory pathways in lateral diencephalon. J Comp Neurol 220: 229–251, 1983 [DOI] [PubMed] [Google Scholar]
- Birdno MJ, Grill WM. Mechanisms of deep brain stimulation in movement disorders as revealed by changes in stimulus frequency. Neurotherapeutics 5: 14–25, 2008 [DOI] [PMC free article] [PubMed] [Google Scholar]
- Birdno MJ, Kuncel AM, Dorval AD, Turner DA, Gross RE, Grill WM. Stimulus features underlying reduced tremor suppression with temporally patterned deep brain stimulation. J Neurophysiol 107: 364–383, 2012 [DOI] [PMC free article] [PubMed] [Google Scholar]
- Boehnke SE, Rasmusson DD. Time course and effective spread of lidocaine and tetrodotoxin delivered via microdialysis: an electrophysiological study in cerebral cortex. J Neurosci Methods 105: 133–141, 2001 [DOI] [PubMed] [Google Scholar]
- Boivie J. The termination of the spinothalamic tract in the cat. An experimental study with silver impregnation methods. Exp Brain Res 112: 331–353, 1971 [DOI] [PubMed] [Google Scholar]
- Briaire JJ, Frijns JH. Unraveling the electrically evoked compound action potential. Hear Res 205: 143–156, 2005 [DOI] [PubMed] [Google Scholar]
- Briggs F, Usrey WM. A fast, reciprocal pathway between the lateral geniculate nucleus and visual cortex in the macaque monkey. J Neurosci 27: 5431–5436, 2007 [DOI] [PMC free article] [PubMed] [Google Scholar]
- Bronte-Stewart H, Barberini C, Koop MM, Hill BC, Henderson JM, Wingeier B. The STN beta-band profile in Parkinson's disease is stationary and shows prolonged attenuation after deep brain stimulation. Exp Neurol 215: 20–28, 2009 [DOI] [PubMed] [Google Scholar]
- Brown CJ, Abbas PJ. Electrically evoked whole-nerve action potentials: parametric data from the cat. J Acoust Soc Am 88: 2205–2210, 1990 [DOI] [PubMed] [Google Scholar]
- Brown P, Williams D. Basal ganglia local field potential activity: character and functional significance in the human. Clin Neurophysiol 116: 2510–2519, 2005 [DOI] [PubMed] [Google Scholar]
- Butler AB, Hodos W. Comparative Vertebrate Neuroanatomy: Evolution and Adaptation. Hoboken, NJ: Wiley, 2005 [Google Scholar]
- Butson CR, McIntyre CC. Tissue and electrode capacitance reduce neural activation volumes during deep brain stimulation. Clin Neurophysiol 116: 2490–2500, 2005 [DOI] [PMC free article] [PubMed] [Google Scholar]
- Cohen CJ, Bean BP, Colatsky TJ, Tsien RW. Tetrodotoxin block of sodium channels in rabbit Purkinje fibers. Interactions between toxin binding and channel gating. J Gen Physiol 78: 383–411, 1981 [DOI] [PMC free article] [PubMed] [Google Scholar]
- Courtney KR. Mechanism of frequency-dependent inhibition of sodium currents in frog myelinated nerve by the lidocaine derivative GEA. J Pharmacol Exp Ther 195: 225–236, 1975 [PubMed] [Google Scholar]
- Craig AD, Burton H. The distribution and topographical organization in the thalamus of anterogradely-transported horseradish peroxidase after spinal injections in cat and raccoon. Exp Brain Res 58: 227–254, 1985 [DOI] [PubMed] [Google Scholar]
- Detsch O, Kochs E, Siemers M, Bromm B, Vahle-Hinz C. Differential effects of isoflurane on excitatory and inhibitory synaptic inputs to thalamic neurones in vivo. Br J Anaesth 89: 294–300, 2002 [DOI] [PubMed] [Google Scholar]
- Deuschl G, Herzog J, Kleiner-Fisman G, Kubu C, Lozano AM, Lyons KE, Rodriguez-Oroz MC, Tamma F, Troster AI, Vitek JL, Volkmann J, Voon V. Deep brain stimulation: postoperative issues. Mov Disord 21, Suppl 14: S219–S237, 2006 [DOI] [PubMed] [Google Scholar]
- Eusebio A, Cagnan H, Brown P. Does suppression of oscillatory synchronisation mediate some of the therapeutic effects of DBS in patients with Parkinson's disease? Front Integr Neurosci 6: 47, 2012 [DOI] [PMC free article] [PubMed] [Google Scholar]
- Frankemolle AM, Wu J, Noecker AM, Voelcker-Rehage C, Ho JC, Vitek JL, McIntyre CC, Alberts JL. Reversing cognitive-motor impairments in Parkinson's disease patients using a computational modelling approach to deep brain stimulation programming. Brain 133: 746–761, 2010 [DOI] [PMC free article] [PubMed] [Google Scholar]
- Gold C, Henze DA, Koch C, Buzsaki G. On the origin of the extracellular action potential waveform: a modeling study. J Neurophysiol 95: 3113–3128, 2006 [DOI] [PubMed] [Google Scholar]
- Gradinaru V, Mogri M, Thompson KR, Henderson JM, Deisseroth K. Optical deconstruction of parkinsonian neural circuitry. Science 324: 354–359, 2009 [DOI] [PMC free article] [PubMed] [Google Scholar]
- Grant PF, Lowery MM. Effect of dispersive conductivity and permittivity in volume conductor models of deep brain stimulation. IEEE Trans Biomed Eng 57: 2386–2393, 2010 [DOI] [PubMed] [Google Scholar]
- Helmholtz HL. Ueber einige Gesetze der vertheilung Elektrischer Ströme in korperlichen Leitern mit Anwendung auf die thierisch-electrischen Versuche. Ann Physik Chemie 89: 354–377, 1853 [Google Scholar]
- Hersch SM, White EL. Thalamocortical synapses with corticothalamic projection neurons in mouse SmI cortex: electron microscopic demonstration of a monosynaptic feedback loop. Neurosci Lett 24: 207–210, 1981 [DOI] [PubMed] [Google Scholar]
- Hines ML, Carnevale NT. NEURON: a tool for neuroscientists. Neuroscientist 7: 123–135, 2001 [DOI] [PubMed] [Google Scholar]
- Hirai T, Jones EG. Segregation of lemniscal inputs and motor cortex outputs in cat ventral thalamic nuclei: application of a novel technique. Exp Brain Res 71: 329–344, 1988 [DOI] [PubMed] [Google Scholar]
- Hirai T, Ohye C, Nagaseki Y, Matsumura M. Cytometric analysis of the thalamic ventralis intermedius nucleus in humans. J Neurophysiol 61: 478–487, 1989 [DOI] [PubMed] [Google Scholar]
- Hodaie M, Wennberg RA, Dostrovsky JO, Lozano AM. Chronic anterior thalamus stimulation for intractable epilepsy. Epilepsia 43: 603–608, 2002 [DOI] [PubMed] [Google Scholar]
- Jeon EK, Brown CJ, Etler CP, O'Brien S, Chiou LK, Abbas PJ. Comparison of electrically evoked compound action potential thresholds and loudness estimates for the stimuli used to program the Advanced Bionics cochlear implant. J Am Acad Audiol 21: 16–27, 2010 [DOI] [PMC free article] [PubMed] [Google Scholar]
- Jimenez Castellanos J. Thalamus of the cat in Horsley-Clarke coordinates. J Comp Neurol 91: 307–330, 1949 [DOI] [PubMed] [Google Scholar]
- Joksovic PM, Weiergraber M, Lee W, Struck H, Schneider T, Todorovic SM. Isoflurane-sensitive presynaptic R-type calcium channels contribute to inhibitory synaptic transmission in the rat thalamus. J Neurosci 29: 1434–1445, 2009 [DOI] [PMC free article] [PubMed] [Google Scholar]
- Jones EG, Burton H. Cytoarchitecture and somatic sensory connectivity of thalamic nuclei other than the ventrobasal complex in the cat. J Comp Neurol 154: 395–432, 1974 [DOI] [PubMed] [Google Scholar]
- Kane A, Hutchison WD, Hodaie M, Lozano AM, Dostrovsky JO. Enhanced synchronization of thalamic theta band local field potentials in patients with essential tremor. Exp Neurol 217: 171–176, 2009 [DOI] [PubMed] [Google Scholar]
- Kemp JA, McKernan RM. NMDA receptor pathways as drug targets. Nat Neurosci 5, Suppl: 1039–1042, 2002 [DOI] [PubMed] [Google Scholar]
- Kent AR, Grill WM. Instrumentation to record evoked potentials for closed-loop control of deep brain stimulation. Conf Proc IEEE Eng Med Biol Soc 2011: 6777–6780, 2011 [DOI] [PMC free article] [PubMed] [Google Scholar]
- Kent AR, Grill WM. Recording evoked potentials during deep brain stimulation: development and validation of instrumentation to suppress the stimulus artefact. J Neural Eng 9: 036004, 2012 [DOI] [PMC free article] [PubMed] [Google Scholar]
- Khodorov BL, Shishkova L, Peganov E, Revenko S. Inhibition of sodium currents in frog Ranvier node treated with local anesthetics. Role of slow sodium inactivation. Biochim Biophys Acta 433: 409–435, 1976 [Google Scholar]
- Krack P, Batir A, Van Blercom N, Chabardes S, Fraix V, Ardouin C, Koudsie A, Limousin PD, Benazzouz A, LeBas JF, Benabid AL, Pollak P. Five-year follow-up of bilateral stimulation of the subthalamic nucleus in advanced Parkinson's disease. N Engl J Med 349: 1925–1934, 2003 [DOI] [PubMed] [Google Scholar]
- Krack P, Fraix V, Mendes A, Benabid AL, Pollak P. Postoperative management of subthalamic nucleus stimulation for Parkinson's disease. Mov Disord 17, Suppl 3: S188–S197, 2002 [DOI] [PubMed] [Google Scholar]
- Kultas-Ilinsky K, Fogarty JD, Hughes B, Ilinsky IA. Distribution and binding parameters of GABA and benzodiazepine receptors in the cat motor thalamus and adjacent nuclear groups. Brain Res 459: 1–16, 1988 [DOI] [PubMed] [Google Scholar]
- Kuncel AM, Cooper SE, Wolgamuth BR, Grill WM. Amplitude- and frequency-dependent changes in neuronal regularity parallel changes in tremor with thalamic deep brain stimulation. IEEE Trans Neural Syst Rehabil Eng 15: 190–197, 2007 [DOI] [PubMed] [Google Scholar]
- Kuncel AM, Grill WM. Selection of stimulus parameters for deep brain stimulation. Clin Neurophysiol 115: 2431–2441, 2004 [DOI] [PubMed] [Google Scholar]
- Lee JY, Jeon BS, Paek SH, Lim YH, Kim MR, Kim C. Reprogramming guided by the fused images of MRI and CT in subthalamic nucleus stimulation in Parkinson disease. Clin Neurol Neurosurg 112: 47–53, 2010 [DOI] [PubMed] [Google Scholar]
- Lempka SF, Johnson MD, Miocinovic S, Vitek JL, McIntyre CC. Current-controlled deep brain stimulation reduces in vivo voltage fluctuations observed during voltage-controlled stimulation. Clin Neurophysiol 121: 2128–2133, 2010 [DOI] [PMC free article] [PubMed] [Google Scholar]
- Lenz FA, Seike M, Richardson RT, Lin YC, Baker FH, Khoja I, Jaeger CJ, Gracely RH. Thermal and pain sensations evoked by microstimulation in the area of human ventrocaudal nucleus. J Neurophysiol 70: 200–212, 1993 [DOI] [PubMed] [Google Scholar]
- Levy R, Lang AE, Dostrovsky JO, Pahapill P, Romas J, Saint-Cyr J, Hutchison WD, Lozano AM. Lidocaine and muscimol microinjections in subthalamic nucleus reverse Parkinsonian symptoms. Brain 124: 2105–2118, 2001 [DOI] [PubMed] [Google Scholar]
- Long SK, Smith DA, Siarey RJ, Evans RH. Effect of 6-cyano-2,3-dihydroxy-7-nitro-quinoxaline (CNQX) on dorsal root-, NMDA-, kainate- and quisqualate-mediated depolarization of rat motoneurones in vitro. Br J Pharmacol 100: 850–854, 1990 [DOI] [PMC free article] [PubMed] [Google Scholar]
- Mallart A. Thalamic projection of muscle nerve afferents in the cat. J Physiol 194: 337–353, 1968 [DOI] [PMC free article] [PubMed] [Google Scholar]
- Marceglia S, Rossi L, Foffani G, Bianchi A, Cerutti S, Priori A. Basal ganglia local field potentials: applications in the development of new deep brain stimulation devices for movement disorders. Expert Rev Med Devices 4: 605–614, 2007 [DOI] [PubMed] [Google Scholar]
- McConnell GC, Rees HD, Levey AI, Gutekunst CA, Gross RE, Bellamkonda RV. Implanted neural electrodes cause chronic, local inflammation that is correlated with local neurodegeneration. J Neural Eng 6: 056003, 2009 [DOI] [PubMed] [Google Scholar]
- McIntyre CC, Grill WM. Excitation of central nervous system neurons by nonuniform electric fields. Biophys J 76: 878–888, 1999 [DOI] [PMC free article] [PubMed] [Google Scholar]
- McIntyre CC, Grill WM. Selective microstimulation of central nervous system neurons. Ann Biomed Eng 28: 219–233, 2000 [DOI] [PubMed] [Google Scholar]
- McIntyre CC, Grill WM, Sherman DL, Thakor NV. Cellular effects of deep brain stimulation: model-based analysis of activation and inhibition. J Neurophysiol 91: 1457–1469, 2004 [DOI] [PubMed] [Google Scholar]
- McIntyre CC, Richardson AG, Grill WM. Modeling the excitability of mammalian nerve fibers: influence of afterpotentials on the recovery cycle. J Neurophysiol 87: 995–1006, 2002 [DOI] [PubMed] [Google Scholar]
- McLaughlin M, Lu T, Dimitrijevic A, Zeng FG. Towards a closed-loop cochlear implant system: application of embedded monitoring of peripheral and central neural activity. IEEE Trans Neural Syst Rehabil Eng 20: 443–454, 2012 [DOI] [PubMed] [Google Scholar]
- Miller CA, Brown CJ, Abbas PJ, Chi SL. The clinical application of potentials evoked from the peripheral auditory system. Hear Res 242: 184–197, 2008 [DOI] [PubMed] [Google Scholar]
- Moffitt MA, McIntyre CC. Model-based analysis of cortical recording with silicon microelectrodes. Clin Neurophysiol 116: 2240–2250, 2005 [DOI] [PubMed] [Google Scholar]
- Moro E, Poon YY, Lozano AM, Saint-Cyr JA, Lang AE. Subthalamic nucleus stimulation: improvements in outcome with reprogramming. Arch Neurol 63: 1266–1272, 2006 [DOI] [PubMed] [Google Scholar]
- Noudoost B, Moore T. A reliable microinjectrode system for use in behaving monkeys. J Neurosci Methods 194: 218–223, 2011 [DOI] [PMC free article] [PubMed] [Google Scholar]
- Okun MS, Tagliati M, Pourfar M, Fernandez HH, Rodriguez RL, Alterman RL, Foote KD. Management of referred deep brain stimulation failures: a retrospective analysis from 2 movement disorders centers. Arch Neurol 62: 1250–1255, 2005 [DOI] [PubMed] [Google Scholar]
- Ondo WG, Bronte-Stewart H. The North American survey of placement and adjustment strategies for deep brain stimulation. Stereotact Funct Neurosurg 83: 142–147, 2005 [DOI] [PubMed] [Google Scholar]
- Pahwa R, Lyons KE, Wilkinson SB, Simpson RK, Jr, Ondo WG, Tarsy D, Norregaard T, Hubble JP, Smith DA, Hauser RA, Jankovic J. Long-term evaluation of deep brain stimulation of the thalamus. J Neurosurg 104: 506–512, 2006 [DOI] [PubMed] [Google Scholar]
- Posner LP, Burns P. Injectable anesthetic agents. In: Veterinary Pharmacology and Therapeutics, edited by Riviere JE, Papich MG. Ames, IA: Wiley-Blackwell, 2009, p. 265–300 [Google Scholar]
- Rathnasingham R, Kipke DR, Bledsoe SC, Jr, McLaren JD. Characterization of implantable microfabricated fluid delivery devices. IEEE Trans Biomed Eng 51: 138–145, 2004 [DOI] [PubMed] [Google Scholar]
- Ray NJ, Jenkinson N, Wang S, Holland P, Brittain JS, Joint C, Stein JF, Aziz T. Local field potential beta activity in the subthalamic nucleus of patients with Parkinson's disease is associated with improvements in bradykinesia after dopamine and deep brain stimulation. Exp Neurol 213: 108–113, 2008 [DOI] [PubMed] [Google Scholar]
- Rohatgi P, Langhals NB, Kipke DR, Patil PG. In vivo performance of a microelectrode neural probe with integrated drug delivery. Neurosurg Focus 27: E8, 2009 [DOI] [PMC free article] [PubMed] [Google Scholar]
- Rosa M, Giannicola G, Servello D, Marceglia S, Pacchetti C, Porta M, Sassi M, Scelzo E, Barbieri S, Priori A. Subthalamic local field beta oscillations during ongoing deep brain stimulation in Parkinson's disease in hyperacute and chronic phases. Neurosignals 19: 151–162, 2011 [DOI] [PubMed] [Google Scholar]
- Rosin B, Slovik M, Mitelman R, Rivlin-Etzion M, Haber SN, Israel Z, Vaadia E, Bergman H. Closed-loop deep brain stimulation is superior in ameliorating parkinsonism. Neuron 72: 370–384, 2011 [DOI] [PubMed] [Google Scholar]
- Santaniello S, Fiengo G, Glielmo L, Grill WM. Closed-loop control of deep brain stimulation: a simulation study. IEEE Trans Neural Syst Rehabil Eng 19: 15–24, 2011 [DOI] [PubMed] [Google Scholar]
- Sato F, Nakamura Y, Shinoda Y. Three-dimensional analysis of cerebellar terminals and their postsynaptic components in the ventral lateral nucleus of the cat thalamus. J Comp Neurol 371: 537–551, 1996 [DOI] [PubMed] [Google Scholar]
- Sherman SM. Interneurons and triadic circuitry of the thalamus. Trends Neurosci 27: 670–675, 2004 [DOI] [PubMed] [Google Scholar]
- Smirnov DA, Barnikol UB, Barnikol TT, Bezruchko BP, Hauptmann C, Buhrle C, Maarouf M, Sturm V, Freund HJ, Tass PA. The generation of parkinsonian tremor as revealed by directional coupling analysis. Europhys Lett 83: 1–6, 2008 [Google Scholar]
- Snider RS, Niemer WT. A Stereotaxic Atlas of the Cat Brain. Chicago, IL: Univ. of Chicago Press, 1961 [Google Scholar]
- Steriade M, Jones EG, McCormick DA. Thalamus. Oxford, UK: Elsevier Science, 1997 [Google Scholar]
- Strichartz GR. The inhibition of sodium currents in myelinated nerve by quaternary derivatives of lidocaine. J Gen Physiol 62: 37–57, 1973 [DOI] [PMC free article] [PubMed] [Google Scholar]
- Tamma F, Caputo E, Chiesa V, Egidi M, Locatelli M, Rampini P, Cinnante C, Pesenti A, Priori A. Anatomo-clinical correlation of intraoperative stimulation-induced side-effects during HF-DBS of the subthalamic nucleus. Neurol Sci 23, Suppl 2: S109–S110, 2002 [DOI] [PubMed] [Google Scholar]
- Tass P, Smirnov D, Karavaev A, Barnikol U, Barnikol T, Adamchic I, Hauptmann C, Pawelcyzk N, Maarouf M, Sturm V, Freund HJ, Bezruchko B. The causal relationship between subcortical local field potential oscillations and Parkinsonian resting tremor. J Neural Eng 7: 16009, 2010 [DOI] [PubMed] [Google Scholar]
- Tracey B, Williams M. Computationally efficient bioelectric field modeling and effects of frequency-dependent tissue capacitance. J Neural Eng 8: 036017, 2011 [DOI] [PubMed] [Google Scholar]
- Ulbricht W, Wagner HH. The influence of pH on equilibrium effects of tetrodotoxin on myelinated nerve fibres of Rana esculenta. J Physiol 252: 159–184, 1975 [DOI] [PMC free article] [PubMed] [Google Scholar]
- Urbano F, Leznik E, Llinás R. Cortical activation patterns evoked by afferent axons stimuli at different frequencies: an in vitro voltage-sensitive dye imaging study. Thalamus Relat Syst 1: 371–378, 2002 [Google Scholar]
- Wang LY, Kaczmarek LK. High-frequency firing helps replenish the readily releasable pool of synaptic vesicles. Nature 394: 384–388, 1998 [DOI] [PubMed] [Google Scholar]
- Wang Q, Millard DC, Zheng HJ, Stanley GB. Voltage-sensitive dye imaging reveals improved topographic activation of cortex in response to manipulation of thalamic microstimulation parameters. J Neural Eng 9: 026008, 2012 [DOI] [PMC free article] [PubMed] [Google Scholar]
- Weaver FM, Follett KA, Stern M, Luo P, Harris CL, Hur K, Marks WJ, Jr, Rothlind J, Sagher O, Moy C, Pahwa R, Burchiel K, Hogarth P, Lai EC, Duda JE, Holloway K, Samii A, Horn S, Bronstein JM, Stoner G, Starr PA, Simpson R, Baltuch G, De Salles A, Huang GD, Reda DJ. Randomized trial of deep brain stimulation for Parkinson disease: thirty-six-month outcomes. Neurology 79: 55–65, 2012 [DOI] [PMC free article] [PubMed] [Google Scholar]
- Wesseling JF, Lo DC. Limit on the role of activity in controlling the release-ready supply of synaptic vesicles. J Neurosci 22: 9708–9720, 2002 [DOI] [PMC free article] [PubMed] [Google Scholar]
- Wu XS, Sun JY, Evers AS, Crowder M, Wu LG. Isoflurane inhibits transmitter release and the presynaptic action potential. Anesthesiology 100: 663–670, 2004 [DOI] [PubMed] [Google Scholar]
- Ying SW, Werner DF, Homanics GE, Harrison NL, Goldstein PA. Isoflurane modulates excitability in the mouse thalamus via GABA-dependent and GABA-independent mechanisms. Neuropharmacology 56: 438–447, 2009 [DOI] [PMC free article] [PubMed] [Google Scholar]
- Yoshida F, Martinez-Torres I, Pogosyan A, Holl E, Petersen E, Chen CC, Foltynie T, Limousin P, Zrinzo LU, Hariz MI, Brown P. Value of subthalamic nucleus local field potentials recordings in predicting stimulation parameters for deep brain stimulation in Parkinson's disease. J Neurol Neurosurg Psychiatry 81: 885–889, 2010 [DOI] [PubMed] [Google Scholar]
- Yousif N, Bayford R, Liu X. The influence of reactivity of the electrode-brain interface on the crossing electric current in therapeutic deep brain stimulation. Neuroscience 156: 597–606, 2008 [DOI] [PMC free article] [PubMed] [Google Scholar]
- Yousif N, Pavese N, Naushahi MJ, Nandi D, Bain PG. Reversing the polarity of bipolar stimulation in deep brain stimulation for essential tremor: a theoretical explanation for a useful clinical intervention. Neurocase (September 24, 2012). 10.1080/13554794.2012.713495 [DOI] [PubMed] [Google Scholar]
- Zucker RS, Regehr WG. Short-term synaptic plasticity. Annu Rev Physiol 64: 355–405, 2002 [DOI] [PubMed] [Google Scholar]