

Abstract
Responses of many neurons in primary visual cortex (V1) are suppressed by stimuli exceeding the classical receptive field (RF), an important property that might underlie the computation of visual saliency. Traditionally, it has proven difficult to disentangle the underlying neural circuits, including feedforward, horizontal intracortical, and feedback connectivity. Since circuit-level analysis is particularly feasible in the mouse, we asked whether neural signatures of spatial integration in mouse V1 are similar to those of higher-order mammals and investigated the role of parvalbumin-expressing (PV+) inhibitory interneurons. Analogous to what is known from primates and carnivores, we demonstrate that, in awake mice, surround suppression is present in the majority of V1 neurons and is strongest in superficial cortical layers. Anesthesia with isoflurane-urethane, however, profoundly affects spatial integration: it reduces the laminar dependency, decreases overall suppression strength, and alters the temporal dynamics of responses. We show that these effects of brain state can be parsimoniously explained by assuming that anesthesia affects contrast normalization. Hence, the full impact of suppressive influences in mouse V1 cannot be studied under anesthesia with isoflurane-urethane. To assess the neural circuits of spatial integration, we targeted PV+ interneurons using optogenetics. Optogenetic depolarization of PV+ interneurons was associated with increased RF size and decreased suppression in the recorded population, similar to effects of lowering stimulus contrast, suggesting that PV+ interneurons contribute to spatial integration by affecting overall stimulus drive. We conclude that the mouse is a promising model for circuit-level mechanisms of spatial integration, which relies on the combined activity of different types of inhibitory interneurons.
Keywords: V1, size tuning, gain control, contrast normalization, anesthesia, PV+ interneurons, surround suppression
in primary visual cortex (v1), many neurons exhibit selectivity for stimulus size, showing suppression of responses when stimuli extend beyond the classical receptive field (RF) into the surround (Allman et al. 1985; Blakemore and Tobin 1972; DeAngelis et al. 1994; Gilbert and Wiesel 1990; Knierim and van Essen 1992; Nelson and Frost 1978). Understanding the neural mechanisms of surround suppression is important, since this modulation is thought to constitute a key aspect of perception: the computation of visual saliency by integration of local information within the global context (Sachdev et al. 2012).
Surround suppression is likely mediated by a combination of different neural circuits and mechanisms. In higher-order mammals, where spatial integration has been studied most extensively, surround suppression shows signatures of various components (Angelucci and Bressloff 2006), including feedforward (e.g., Alitto and Usrey 2008; Solomon et al. 2002; Webb et al. 2005), feedback (e.g., Angelucci et al. 2002; Bair et al. 2003), and horizontal intracortical circuitry (e.g., Angelucci et al. 2002; Gilbert et al. 1996; Reynaud et al. 2012; Somers et al. 1998). The relative contributions of these circuits, however, are under debate and the cell types involved mostly unknown.
Exploiting powerful genetic tools, recent work in mouse V1 has characterized a neural circuit for spatial integration in layers 2/3 involving somatostatin-expressing (SOM+) inhibitory interneurons (Adesnik et al. 2012). SOM+ interneurons seem to have little surround suppression themselves such that they can exert inhibition onto neighboring pyramidal cells at large stimulus sizes. Moreover, optogenetic hyperpolarization of SOM+ interneurons weakens surround suppression.
The influence of other types of interneurons on surround suppression is an open question. Parvalbumin-expressing (PV+) interneurons constitute the major class of GABAergic interneurons in mouse V1 (Gonchar et al. 2007). Preferred size of PV+ inhibitory interneurons seems to be larger and surround suppression weaker than in the general population (Adesnik et al. 2012). Furthermore, PV+ interneurons have been suggested to perform gain control and response normalization (Atallah et al. 2012), computations that lie at the heart of surround suppression (reviewed in Carandini and Heeger 2012). Therefore, PV+ interneurons likely affect surround suppression, but the nature of their influence remains unknown.
Likewise, surround suppression beyond layers 2/3 in mouse V1 is much less explored. With the exception of a single study (Van den Bergh et al. 2010), little is known about the laminar profile of surround suppression in the mouse. Yet, this study failed to observe any laminar dependence, which is a hallmark of surround suppression in higher-order mammals such as cats and primates. These recordings, however, were obtained under anesthesia, which may well have led to an underestimation of the overall impact of suppressive circuits in mouse V1 (Adesnik et al. 2012; Haider et al. 2013).
In the present study, we assess the laminar profile of surround suppression in mouse V1 and compare the impact of suppressive circuits between anesthesia and wakefulness. We combine electrophysiological extracellular recordings with optogenetic manipulation of interneuron activity to investigate the role of PV+ inhibitory interneurons in surround suppression.
METHODS
Experiments were performed on adult mice. Procedures were in accordance with the standards of the Society for Neuroscience and the German Law for Protection of Animals and were approved by the local authorities. Recordings from V1 were obtained through a craniotomy (<1 mm2) located 3 mm lateral to the midline and 1.1 mm in front of the anterior margin of the transverse sinus (Wang et al. 2011). Extracellular recordings were performed with 16-channel silicon probes (A1×16-3mm-50-177, Neuronexus; 50-μm intercontact spacing). Online estimates of RF position, orientation preference, and contrast sensitivity relied on high-pass filtered signals crossing a fixed threshold (typically 4.5–6.5 SDs). For offline data analysis, spikes were extracted for each electrode contact separately from the unfiltered signal sampled at 30 kHz using the NDManager software suite (Hazan et al. 2006). Here, spike detection threshold was automatically determined (Quiroga et al. 2004) and multiplied by a factor of 2 to avoid spurious threshold crossings by noise. This procedure typically resulted in high-quality multiunit activity (Fig. 1A). Since only suboptimal spike-sorting strategies are currently available for high-density multielectrode arrays (Einevoll et al. 2012), we did not attempt to perform systematic spike sorting. Throughout this report, we use the term “units” to refer to multiunit activity.
Fig. 1.
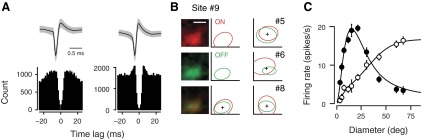
Recording and analysis methods. A: example spike waveforms and autocorrelograms (experiments 5-2.10.9 and 14-2.7.12). B: color maps (left) of ON (red) and OFF (green) subfields and their superposition along with ellipses depicting the fitted outline of the spike subfields for a single recording site (#9). Receptive field (RF) outlines (right) of another 3 simultaneously recorded sites (#5, #6, and #8). Scale bar, 10° (applies to all data in B). Crosses indicate average RF position (experiment 5-2.10). C: example units without (open circles) and with surround suppression (filled circles), recorded in 2 different experiments (experiments 9-2.12.12 and 5-2.2.8). Solid lines are fits of the ratio-of-Gaussians model. All example data shown come from recordings during wakefulness. Shaded regions and error bars indicate ±SE.
Recordings in anesthetized mice.
In six C57BL6/J mice, anesthesia was induced by 3% isoflurane and maintained during surgery by a combination of urethane (750 mg/kg ip) and isoflurane (1–2%). Buprenorphine (0.1 mg/kg sc) was used for analgesia and atropine (0.3 mg/g sc) to reduce bronchial secretions. Animal temperature was kept at 37°C. A custom-designed head post was mounted to the skull using dental cement (Tetrik EvoFlow, Ivoclar Vivadent). A reference wire was placed into the cerebellum and a ground wire under the skin. During recording, isoflurane was reduced to ∼0.5%.
Recordings in awake mice.
Under isoflurane anesthesia (3% induction, 1–2% maintenance), six C57BL6/J mice were implanted with head post and miniature screws over the cerebellum for ground and reference wires. Atropine (0.3 mg/kg sc), antibiotics (Baytril, 5 mg/kg sc), and analgesics (buprenorphine, 0.1 mg/kg sc) were given during surgery, and for the following 3 days the same antibiotics and longer lasting analgesics (carprofen, 5 mg/kg sc) were injected. The animals were habituated to being head-fixed and placed on an air-suspended Styrofoam ball (Dombeck et al. 2007). After habituation, a craniotomy over V1 was performed, which was sealed with Kwik-Cast (WPI) after each recording session (3–4 h). To avoid residual effects of anesthesia, recordings were never performed on the day of the craniotomy. Eye position was monitored under infrared illumination using a camera (Guppy AVT; frame rate 50 Hz) coupled to a zoom lens (Navitar Zoom 6000). Although eye movements were occasionally observed, their amplitude was small and less of a concern, because we were able to consistently evoke visual responses even with the smallest stimulus size. In addition, removing trials with eye movements does not substantially alter size tuning curves in mouse area V1 (Adesnik et al. 2012).
Recordings with optogenetics in awake mice.
Seven PV-IRES-cre mice [B6;129P2-Pvalbtm1(cre)Arbr/J; Jackson Laboratory] underwent head post surgery as described above. They were additionally injected with the adeno-associated viral vector AAV2/1.EF1a.DIO.hChR2(H134R)-EYFP.WPRE.hGH or AAV2/9.EF1a.DIO.hChR2(H134R)-EYFP.WPRE.hGH (Vector Core, University of Pennsylvania) through a small craniotomy 3 mm lateral to the midline and 1.5 mm in front of the anterior margin of the transverse sinus. A glass pipette connected to a Picospritzer III (Parker) was slowly lowered to ∼750 μm below the brain surface, and a total of 100–150 nl of virus was injected every 100 μm while gradually retracting the pipette. The pipette was left in place for an additional 5 min to allow viral diffusion, and the craniotomy was covered with Kwik-Cast (WPI). Neurophysiological recordings with photostimulation were performed at least 3–4 wk after virus injection. For these recordings, a second craniotomy was performed over V1 as described above.
Photostimulation was carried out using a fiber-coupled light-emitting diode (LEDs; Doric lenses) with a center wavelength of 473 nm, driven by an LED driver (LEDD1B, Thorlabs). The fibers were mounted on a manual manipulator and positioned less than 1 mm from the craniotomy. LED light was delivered with a light intensity of 22 mW/mm2 measured at the tip of a 200-μm-diameter core.
For histological analyses, mice were transcardially perfused under pentobarbital sodium anesthesia (200 mg/kg) with 0.2 M sodium phosphate buffer (PBS), followed by 4% paraformaldehyde in PBS. Brains were postfixed for 24 h at 4°C and then rinsed 3 times with 1× PBS. Free-floating sections (60 μm) were cut using a vibratome (Microm HM 650 V-Thermo Scientific) and incubated at room temperature for 1 h with blocking solution (10% Roche blocking reagent for ELISA in PBS with 0.3% Triton-X 100 detergent) and then for 24 h with anti-PV primary antibody (Sigma; 1:2,000 in blocking solution with PBS and 0.3% Triton-X 100 detergent). After being rinsed 3 times for 10 min in 1× PBS, sections were incubated in Alexa Fluor 647-conjugated secondary antibodies (Invitrogen; 1:1,000 in blocking solution with PBS and 0.3% Triton-X 100 detergent). Sections were rinsed 3 times for 10 min in 1× PBS, mounted on glass slides with Vectashield (Vector Laboratories), and coverslipped. Slides were inspected for the presence of yellow fluorescent protein (YFP) and Alexa 647 using a Zeiss Imager.Z1m fluorescent microscope.
We excluded from the analysis one animal, in which there was no effect of optogenetic photostimulation on firing rates. In this animal, postmortem histological analysis confirmed insufficient viral expression. We also excluded recordings from PV+ interneurons, which we identified by transient and strong increases in firing rate time-locked to blue light stimulation.
Stimuli.
Stimuli were presented using custom software (EXPO; https://sites.google.com/a/nyu.edu/expo/home) on a calibrated liquid crystal display (LCD) monitor (Samsung 2233RZ; mean luminance 50 cd/m2). To estimate RF position before measuring size tuning curves, we mapped ON and OFF subfields of RFs using a sparse noise stimulus (Liu et al. 2009). This stimulus consisted of white or black squares (4° diameter) flashed for 180 ms on a 40° square grid. Following Liu et al. (2009), we fitted ON and OFF subfields separately with a two-dimensional Gaussian:
where A is the maximum amplitude, a and b are half-axes of the ellipse, and x′ and y′ are transformations of the stimulus coordinates x and y, taking into account the angle θ and the coordinates of the center (xc, yc) of the ellipse. For each contact, we computed a single RF center by averaging coordinates of the best-fit ON and OFF subfield (explained variance > 70%). Subsequent stimuli were presented at the average RF center across recording sites.
To guide the choice of stimulus orientation for the size tuning experiment, we assessed online orientation biases in threshold crossings using 2-s sinusoidal gratings moving in 8 different directions (spatial frequency 0.02 cycles/deg, temporal frequency 1.5 cycles/s). These spatial and temporal frequencies represent average optimal values for mouse V1 (Marshel et al. 2011). Since spatial and temporal frequency tuning are typically broad in mouse V1 (Marshel et al. 2011; Niell and Stryker 2008), we did not optimize these parameters for individual experiments. The salt-and-pepper organization of orientation preference in rodent V1 (Ohki et al. 2005) excludes the possibility to determine preferred orientation from multiunit activity. However, we tried to optimize stimulus orientation as much as possible by choosing the orientation that elicited the strongest activity in the cleanest spike waveforms.
For size tuning experiments, we presented 750-ms sinusoidal gratings at a single orientation centered over the previously determined average RF center. Grating diameter ranged from 4° to 67°. The interstimulus interval was 0.5 s. For contrast-response functions, gratings of optimal diameter were shown at 12 different contrasts, ranging from 0 to 100%. Stimulus duration was 2 s with an interstimulus interval of 0.5 s.
Contrast responses were analyzed online using the threshold crossings and fitted with a hyperbolic ratio function (Albrecht and Hamilton 1982): r(c) = r0 + rmax·[cn/(c50n + cn)]. The function has four parameters: r0, baseline response; rmax, responsiveness; c50, semisaturation contrast; and the exponent n.
For size tuning at different contrasts we presented gratings of varying size at full and semisaturation contrast. Semisaturation contrast was determined on the basis of the average extracted semisaturation contrast across recording sites in the contrast tuning experiment. For size tuning during optogenetic depolarization of PV+ interneurons, we delivered, in half of the trials, a blue light pulse 250 ms after stimulus onset for a duration of 250 ms. Trials with and without photostimulation were interleaved in pseudorandom order. Size tuning experiments at different contrasts and size tuning experiments with optogenetics were performed in awake mice only.
Data analysis.
Size tuning curves were fitted with a ratio-of-Gaussians model (Cavanaugh et al. 2002):
where
and
Here, x is stimulus diameter and Kc, Ks, wc, and ws are parameters for the gain and width of the center and surround mechanisms. For fitting, we imposed wc < ws. We defined RF center size as the stimulus diameter eliciting the maximal response, and surround size as the diameter for which the response reached asymptote (i.e., where a 1° increment in size failed to alter firing rate by 0.5%) We determined suppression strength with a suppression index: SI = (Ropt − Rsupp)/Ropt, where Ropt is the peak response and Rsupp is the asymptotic response. Following Van den Bergh et al. (2010), units with SI > 0.1 were considered suppressed. We excluded units if maximal firing rate was <1 spike/s or if the percentage of variance explained by the model was <85%.
We computed the current source density (CSD) from the second spatial derivative of the local field potentials (Mitzdorf 1985) evoked by a full-field checkerboard reversing in contrast. We used a value of 0.4 S/m as measure of cortical conductivity (Logothetis et al. 2007) to approximate CSD in units of nanoamperes per cubic millimeter. We determined layer 4 as the center of the initial current sink (Maier et al. 2011) and assigned recording sites to supragranular, granular, or infragranular laminae. In addition to classifying the location of recording sites into the three categories, we also evaluated our results as a function of relative cortical depth, where 0 represents the middle of layer 4 as determined by CSD analysis. We then used a local robust regression to estimate a smoothed average (MATLAB function “smooth,” method “rlowess”).
We compared distributions of peak evoked firing rates between recordings in anesthetized and awake mice. To test whether differences in firing rates could explain differences in spatial integration, we generated reduced data sets in which firing rates between brain states were matched: we binned firing rates (5-Hz binwidth) and equated the number of units between brain states for each bin by randomly removing excess units from the data set. We then compared key parameters of spatial integration between brain states in these rate-matched data sets. To test for the robustness of this procedure, we repeated this random selection multiple times. Similar results were obtained when matching distributions of baseline firing rates in the absence of sensory stimulation.
To analyze the temporal dynamics of spatial integration, we aligned normalized responses for all units to stimulus onset. We defined response latency as the first of 20 consecutive time points (1-ms interval), where activity exceeded 2.58 times the standard deviation of the baseline response (0–200 ms before stimulus onset).
RESULTS
We performed extracellular multielectrode recordings in area V1 of anesthetized and awake mice. We extracted spikes from continuously recorded data and typically obtained high-quality multiunit activity (Fig. 1A). We first used a sparse noise stimulus consisting of briefly flashed black and white squares (Liu et al. 2009) to estimate RF positions for all recording sites (Fig. 1B). As expected for vertical penetrations, RF center locations were generally overlapping but also exhibited some scatter (6.7 ± 0.7°). This amount of scatter was about one-third the diameter of a typical RF recorded during wakefulness (see next section) and is similar to what has previously been reported for mouse visual cortex (Bonin et al. 2011; Smith and Häusser 2010). We then measured size tuning by increasing the diameter of a grating centered over the average location of the cells' RFs. For some units, responses increased asymptotically with increasing stimulus size (Fig. 1C, open circles); for other units, responses reached a peak, after which further increases in stimulus size led to a suppression of responses (filled circles). We estimated center and surround sizes by fitting a ratio-of-Gaussian model (Cavanaugh et al. 2002), and, for units showing surround suppression, we quantified suppression strength using a suppression index (SI).
We compared key measures of size tuning across cortical layers during anesthesia and wakefulness (Fig. 2). We report data for 68 units collected from 6 awake mice in a total of 17 penetrations, and 163 units collected from 6 anesthetized mice in a total of 22 penetrations. Using CSD analysis (Mitzdorf 1985), we classified the laminar location of each recording site as supragranular, granular, or infragranular (Fig. 2, A and B). We took responses with SI > 0.1 as suppressed (Van den Bergh et al. 2010) and found that the percentage of suppressed units depended on both brain state (awake vs. anesthetized) and laminar position (supragranular vs. granular vs. infragranular) (log-linear analysis, Akaike's information criterion = 19.21) (Fig. 2C). The overall prevalence of suppression was higher in awake vs. anesthetized animals (65% vs. 47%, P = 0.012, χ2 test) and higher in supragranular than in infragranular layers (75% vs. 37%, P < 0.0001, χ2 test). Focusing on size tuning curves with surround suppression (Fig. 2D) revealed that key features of spatial integration depend on both brain state and laminar position (Fig. 2. E and F). RF center size was smaller for awake than for anesthetized mice [19.8 ± 1.9°, n = 44, vs. 32.7 ± 1.5°, n = 76; ANOVA, F(1,114) = 9.9, P = 0.002] and increased with laminar position [ANOVA, F(2,114) = 13.8, P < 0.0001; Fig. 2E]. Likewise, suppression strength was higher, overall, for awake than for anesthetized mice [SI = 0.70 ± 0.03, n = 44, vs. 0.45 ± 0.02, n = 76; ANOVA, F(1,114) = 30.8, P < 0.0001]. The laminar pattern of suppression strength depended on brain state [ANOVA, F(2,114) = 6.3, P = 0.003]: in awake animals, surround suppression was stronger in supragranular than in infragranular layers (SI = 0.80 ± 0.03, n = 23, vs. 0.54 ± 0.07, n = 14, t-test, P < 0.0001), whereas under anesthesia, the strength of suppression did not differ across laminar positions [ANOVA, F(2,73) = 0.8, P = 0.5; Fig. 2F]. A similar pattern was observed when RF center size and suppression strength were plotted as a function of cortical depth relative to layer 4 (Fig. 2, G and H).
Fig. 2.

Spatial integration varies with brain state and laminar location. A and B: local field potential (LFP; black traces) superimposed on current source density (CSD) profile obtained during anesthesia (A) and wakefulness (B) (experiments 68-1.9 and 4-1.9). C: proportion of suppressed units (suppression index SI > 0.1) as a function of laminar location (red, awake; blue, anesthetized). D: fitted size tuning curves for all recorded units with SI > 0.1 and the mean obtained by averaging parameters (solid traces). Arrows depict average RF center sizes. E and F: RF center size (E) and suppression strength (F) as a function of cortical layer. G and H: RF center size (G) and suppression strength (H) for cortical depth relative to the granular layer identified by CSD analysis, along with the local robust regression line. Dashed lines indicate estimated upper and lower boundaries of layer 4. S, supragranular; G, granular; I, infragranular.
We next asked whether these marked differences in spatial integration between brain states could simply be explained by differences in firing rates. We first compared average firing rates between the two brain states and found that stimulus-evoked peak firing rates were indeed higher during wakefulness than anesthesia (18.7 ± 2.2 spikes/s, n = 68, vs. 11.9 ± 1.2 spikes/s, n = 163, t-test, P < 0.01; Fig. 3A). We then considered a random subset of the data, in which firing rates approximately matched. Even with matched firing rates, the effects of brain state on spatial integration persisted, in terms of both RF center size and suppression strength (Fig. 3B). Thus differences in firing rates between brain states cannot explain the observed differences in spatial integration.
Fig. 3.

Anesthesia modulates surround suppression by affecting contrast normalization. A: distributions of stimulus-evoked peak firing rates under wakefulness (red) and anesthesia (blue). Iso, isoflurane; Ure, urethane. Arrows represent population means. B: differences in spatial integration between awake and anesthetized animals persist after firing rates are matched: peak firing rate (left), RF center size (middle), and suppression strength (right). Black, original data set; colors, rate-matched data set. C: example unit with size tuning curves recorded at 100% (black) and 18% contrast (gray). Arrows indicate RF center size (experiment 17-7.14.7). D and E: scatter plots of RF center size (D) and suppression strength (E) at high vs. low contrast (experiments 9-2.12.12 and 5-2.2.8). Inverted triangles in D and E depict example unit from C. All data from size tuning experiments at different contrasts were obtained in awake mice. F–K: dynamics of responses to the optimal (dark colors) and maximal size stimulus (light colors). Horizontal bar indicates stimulus presentation. F: example unit recorded during wakefulness (experiment 5-5.8.13). G: average across the population during wakefulness. H: example unit recorded under anesthesia (experiment 83-4.15.4). I: average across the population under anesthesia. J: initial 100 ms of the average response; data are replotted from G and I. K: distribution of onset latencies under wakefulness (red) and anesthesia (blue). Arrows depict population means. L: contrast-response functions under wakefulness (red), anesthesia with isoflurane and urethane (blue), and anesthesia with urethane only (green). Bold lines represent averages. M and N: distributions of parameters of the hyperbolic ratio function fitted to the contrast-response data separately for each brain state: semisaturation contrast c50 (M) and exponent n (N). Edges of the boxes represent the 25th and 75th percentiles, and whiskers extend to the most extreme data points (excluding outliers, shown as crosses, which lie beyond 2.7σ).
Because the responses under anesthesia were reminiscent of responses typically obtained at low levels of stimulus contrast, we hypothesized that anesthesia modulates surround suppression by affecting contrast normalization. Contrast normalization is thought to underlie a number of suppressive phenomena, including surround suppression (e.g., Carandini and Heeger 2012). Indeed, work in cats and monkeys has documented that RF size grows, and surround suppression weakens, as stimulus contrast decreases (e.g., Kapadia et al. 1999; Levitt and Lund 1997; Sceniak et al. 1999). We therefore hypothesized that anesthesia reduces sensitivity for stimulus contrast, making a high-contrast stimulus appear as having lower contrast.
To test this hypothesis, we studied surround suppression at different levels of contrast and measured the effects of anesthesia on contrast responses; the results provide support for our hypothesis. First, we confirmed that, just as in cat and monkey, spatial integration in mouse V1 depends on stimulus contrast (see also Ayaz et al. 2013; Nienborg et al. 2013). At high stimulus contrast (Fig. 3C, black), RF size of this example unit is small and large stimuli cause full suppression, bringing responses almost back to baseline level. At low stimulus contrast, however, RF size is larger and suppression weaker (Fig. 3C, gray). These effects of stimulus contrast were consistent across the population of recorded units (Fig. 3, D and E): with higher contrast, RF center size was smaller (21.9 ± 3.2° vs. 27.9 ± 2.7° diameter, n = 17, paired t-test, P = 0.02) and suppression was stronger (SI: 0.63 ± 0.07 vs. 0.51 ± 0.08, paired t-test, P = 0.03). Second, anesthesia had an effect on response dynamics (Fig. 3, F–K). During wakefulness, stimulus onset evoked vigorous transient responses, whereas under anesthesia, responses lacked the onset transient and were sluggish. This effect of brain state on response dynamics was present in individual units (Fig. 3, F and H) as well as in the population (Fig. 3, G and I). Also, responses to both optimal and largest stimuli had faster onset latencies during wakefulness (40.0 ± 1.2 ms, n = 44) compared with under anesthesia (54.7 ± 2.7 ms, n = 51, P < 0.0001, Fig. 3, J and K). Third, we found that anesthesia indeed reduced contrast sensitivity (Fig. 3, L–N). Throughout the sample of recorded units with contrast saturation, the semisaturation contrast c50 was lower in awake animals (red) than in animals anesthetized with isoflurane and urethane (blue; 27.3 ± 2.3%, n = 58, vs. 67.5 ± 7.5%, n = 13, t-test, P < 0.0001; Fig. 3M), which is reflected in a rightward shift of the contrast-response functions under anesthesia. Likewise, the exponent n was lower during wakefulness than under anesthesia with isoflurane-urethane (2.1 ± 0.3 vs. 4.4 ± 0.3, t-test, P < 0.0001; Fig. 3N). Indeed, a substantial number of units recorded in anesthetized animals did not even show saturation of responses (25.8%), which was clearly present for almost all units recorded during wakefulness (97.9%). Note that contrast-response functions obtained in additional experiments with urethane as the sole anesthetic (green) were more similar to those obtained during wakefulness but still not as sensitive (c50 = 52.6 ± 5.2%, n = 15, t-test, P < 0.001; Fig. 3M; exponent n = 1.6, not significant; Fig. 3N). Together, these findings are consistent with the idea that anesthesia with isoflurane-urethane influences surround suppression by affecting contrast normalization.
Finally, we assessed the role of PV+ interneurons in spatial integration. We conditionally expressed the light-sensitive cation channel channelrhodopsin 2 (ChR2) by injecting adeno-associated viral vectors (AAV) into V1 of PV-Cre transgenic mice (Fig. 4A). We performed size tuning experiments where in half of the trials we photostimulated PV+ interneurons. Since the recorded multiunit responses mostly reflected pyramidal cell activity, we typically observed a reduction in firing rate during light stimulation (Fig. 4B). In addition, we found that PV+ interneuron activation markedly affected the two key features of spatial integration: the size of RF center widened, and suppression strength decreased (Fig. 4C). These effects were consistent across the population of recorded units (Fig. 4, D–G). On average, driving PV+ neurons decreased firing rates (24.7 ± 3.6 spikes/s to 20.0 ± 2.7 spikes/s, n = 28, paired t-test, P < 0.002). More importantly, RF center size widened from 16.2 ± 1.8° to 23.3 ± 3.3° (paired t-test, P < 0.004), and suppression strength decreased from an SI of 0.71 ± 0.04 to 0.55 ± 0.07 (paired t-test, P < 0.001). Consistent with this decrease of suppression strength, the ratio of responses during photostimulation vs. control condition was smaller at optimal than at maximal stimulus size (0.79 ± 0.04 vs. 1.22 ± 0.22, paired t-test, P < 0.05). We found the effects of PV+ interneuron activation to be similar to the effects of reducing stimulus contrast (compare Fig. 3, C–E, with Fig. 4, C–F). These observations indicate that PV+ interneurons in mouse V1 might contribute to surround suppression by reducing overall stimulus drive.
Fig. 4.
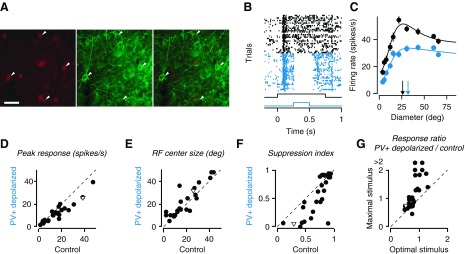
Parvalbumin-expressing (PV+) interneurons influence spatial integration. A: cell-type specific expression of channelrhodopsin 2 (ChR2) in PV+ interneurons: PV immunostaining (left), ChR2-EYFP expression (middle), and overlay (right). Scale bar, 50 μm. B: raster plots of responses to a grating of 15.5° without (black) and with (blue) optogenetic depolarization of PV+ interneurons (black trace, visual stimulus; blue trace, photostimulation) (unit 36-2.7.11). C: size tuning curves; same conventions and example unit as in B. Arrows depict RF center size. D–F: changes in peak firing rates (D), RF center size (E), and suppression strength (F) with optogenetic depolarization of PV+ interneurons. G: ratio of responses with and without photostimulation to optimal and maximal stimulus size. In D–G, inverted triangle depicts example unit from B and C.
DISCUSSION
We investigated the laminar profile of spatial integration and the role of PV+ interneurons in mouse V1. Analogous to what is seen in higher-order mammals, we have demonstrated that the majority of V1 neurons show surround suppression, which is most pronounced in superficial cortical layers. Signatures of spatial integration strongly depend on brain state: under isoflurane/urethane anesthesia, the laminar specificity of spatial integration is decreased, the strength of surround suppression is reduced, RF size is increased, and responses are slower and more sluggish. These effects of brain state on spatial integration can be parsimoniously explained by assuming that anesthesia affects contrast normalization in visual cortex. Finally, we report that optogenetic depolarization of PV+ interneurons affects surround suppression by increasing RF size and decreasing suppression strength, similar to an overall reduction of stimulus contrast.
As for anesthetized recordings, our characterization of spatial integration is consistent with a previous report on center-surround interactions in mouse V1. Under anesthesia, we found RF center sizes (median = 32.4° diameter) and surround sizes (median = 98.7°) comparable to those earlier reported (medians of 28.85° and 92.5°) and no dependence of suppression strength on laminar location (Van den Bergh et al. 2010). This independence of suppression strength and laminar location stands in sharp contrast to results obtained in higher-order mammals, where suppression is typically strongest in superficial layers (Levitt and Lund 2002; Sceniak et al. 2001; Shushruth et al. 2009).
Our results obtained during wakefulness, however, are profoundly different and, despite larger RFs in mice, similar to those in higher-order mammals. We found that in V1 of awake mice, spatial integration is layer dependent: RF center size is smallest and surround suppression is strongest in superficial layers.
Recent work in supragranular layers of mouse visual cortex has identified a specific intracortical circuit for spatial integration, in which SOM+ interneurons play a major role (Adesnik et al. 2012). SOM+ interneurons include Martinotti cells, which have ascending axon collaterals into layer 1 and make synaptic contact to the distal tuft dendrites of pyramidal cells across neighboring columns (Silberberg and Markram 2007; Wang et al. 2004). In layers 2/3, SOM+ interneurons are preferentially recruited by horizontal cortical axons and, in contrast to pyramidal cells, do not show surround suppression (Adesnik et al. 2012). Rather, SOM+ neurons increase firing rates with stimulation of the RF surround, allowing them to downregulate the firing rate of their pyramidal targets with increasing stimulus size. Indeed, optogenetic hyperpolarization of SOM+ interneurons specifically reduces the strength of surround suppression (Adesnik et al. 2012). This circuit likely contributes to the relatively strong surround suppression that we observe in superficial layers.
Our data indicate that PV+ interneurons also contribute to spatial integration in mouse V1, but rather indirectly by affecting overall stimulus drive. PV+ neurons mainly correspond to soma-targeting fast-spiking inhibitory interneurons (reviewed in Markram et al. 2004) and have been shown to be involved in cortical feedforward inhibition (e.g., Swadlow 2003; Yoshimura and Callaway 2005). We have demonstrated that, in contrast to SOM+, PV+ interneurons need to be depolarized to reduce surround suppression. Increasing PV+ activity likely reduces stimulus drive by controlling the overall responsiveness in the network. Indeed, our observed effects of PV+ interneuron activation on spatial integration are similar to those obtained when stimulus contrast is lowered (see also Nienborg et al. 2013). Consistent with a general modulation of stimulus drive, PV+ interneurons have recently been implicated in gain control (Atallah et al. 2012; Ma et al. 2010; Wilson et al. 2012).
Whether these interneurons contribute in the same way to spatial integration in primates remains to be tested. In monkeys, orientation-tuned surround suppression in area V1, together with the absence of pronounced orientation tuning in earlier processing stages, have been taken as evidence for intracortical and feedback circuits involved in spatial integration (Angelucci and Bressloff 2006). In mice, orientation tuned responses have recently been documented for the lateral geniculate nucleus (Marshel et al. 2012; Piscopo et al. 2013). This observation could point toward a potential species difference in the relative contribution of feedforward, lateral, and feedback circuits contributing to surround suppression.
Caution should be taken when directly comparing RF sizes and suppression strength between this study in mouse V1 and previous studies in cats and monkeys because of methodological differences. Previous studies on spatial integration in higher-order mammals typically recorded from single cells and optimized stimulus parameters, such as position, orientation, spatial, and temporal frequency, for the isolated neuron. This is different from our approach, in which we recorded simultaneously from multiple sites, focused on multiunit activity, and adjusted stimulus parameters to match the average preferences. It is well documented that stimulus orientation, spatial frequency, and position can affect measures of spatial integration (e.g., Osaki et al. 2011; Shushruth et al. 2012; Tailby et al. 2007). Hence, a less than perfect match between stimulus properties and neuronal preferences likely could have contributed to the variability of the effects we observed. Yet, our results obtained in anesthetized mice closely match those obtained by Van den Bergh et al. (2010), who recorded from single units and tailored stimuli to neuronal preferences, indicating that our procedure likely did not introduce systematic biases.
We also document that anesthesia composed of isoflurane and urethane strongly influences neural response properties in visual cortex. Isoflurane has typically been avoided in the study of the visual system because of adverse side effects, such as alterations of the time course of synaptic transmission (Ries and Puil 1999), reduction of overall responsiveness (Villeneuve and Casanova 2003), and decreased contrast sensitivity (Solomon et al. 1999). Nevertheless, isoflurane is frequently used for acute studies of the mouse visual system (e.g., Bonin et al. 2011; Runyan et al. 2010; Smith and Häusser 2010) because it allows precise control over depth of anesthesia despite the small size of the mouse. Another popular anesthetic for acute neurophysiology in rodents is urethane (e.g., Niell and Stryker 2008, Wang et al. 2011; Van den Bergh et al. 2010), which seems to reduce overall neuronal excitability (Girman et al. 1999; Sceniak and Maciver 2006) without changing synaptic transmission and without affecting tuning properties (Sceniak and Maciver 2006). Considering these findings, one might ascribe the effects of brain state on surround suppression primarily to isoflurane. However, in control experiments using urethane as the sole anesthetic, we still found attenuated suppressive effects and lower contrast sensitivity compared with recordings during wakefulness (albeit less pronounced). We conclude that the full extent of surround suppression cannot be revealed under isoflurane or urethane anesthesia (see also Adesnik et al. 2012; Haider et al. 2013).
Our finding that brain state strongly modulates tuning for stimulus size is consistent with a recent intracellular recording study in mouse V1 (Haider et al. 2013). Here, the authors showed that during anesthesia with chlorprothixene and either isoflurane or urethane, responses were persistent in time and broad in space compared with those obtained under wakefulness. Their recordings of synaptic conductances revealed that a dominance of inhibition during wakefulness is responsible for the temporal and spatial restriction of responses.
We hypothesize that the differences in spatial integration between the awake and anesthetized brain arise because reduced inhibition during anesthesia alters mechanisms of contrast normalization. Contrast normalization has been successfully used to model surround suppression (Carandini and Heeger 2012). In primate and cat V1, spatial and temporal properties of center-surround interactions depend on stimulus contrast (Kapadia et al. 1999; Sadakane et al. 2006; Sceniak et al. 1999; Schwabe et al. 2010; Webb et al. 2005). In the present study, we have shown that stimulus contrast similarly influences surround suppression in mouse V1, where lower stimulus contrast leads to larger RF center sizes and weaker suppression strength (see also Ayaz et al. 2013; Nienborg et al. 2013). Since anesthesia also substantially reduced contrast sensitivity, the decrease in suppression strength and the slow time course of responses under anesthesia could be attributed to anesthesia affecting contrast normalization: a full contrast stimulus presented during anesthesia might evoke comparable responses to a reduced contrast stimulus seen by an awake mouse.
We conclude that mouse V1 is a valuable model to study the circuit-level mechanisms of spatial integration in visual cortex. As for intracortical inhibitory neurons alone, a picture emerges in which at least two cell types, SOM+ and PV+ inhibitory interneurons, shape spatial integration in distinct ways. The application of genetic tools promises to further disentangle the relative impact of feedforward, intracortical, and feedback connections.
GRANTS
This work was supported by Deutsche Forschungsgemeinschaft funds (DFG Exec 307) awarded to the Werner Reichardt Centre for Integrative Neuroscience, by an ERASMUS higher education exchange program grant and a Deutscher Akademischer Austauschdienst grant awarded to A. Vaiceliunaite, and by a European Research Council Starting Independent Researcher grant (project acronym: PERCEPT) awarded to S. Katzner.
DISCLOSURES
No conflicts of interest, financial or otherwise, are declared by the authors.
AUTHOR CONTRIBUTIONS
A.V., S.K., and L.B. conception and design of research; A.V. performed experiments; A.V., S.E., F.F., S.K., and L.B. analyzed data; A.V., S.E., S.K., and L.B. interpreted results of experiments; A.V., S.K., and L.B. prepared figures; A.V., S.E., S.K., and L.B. edited and revised manuscript; A.V., S.E., F.F., S.K., and L.B. approved final version of manuscript; S.K. and L.B. drafted manuscript.
ACKNOWLEDGMENTS
We thank O. Ruksenas for valuable advice, D. Yatsenko and A. Ecker for sharing code for data management (DataJoint), and I. Ehrlich and C. Daniel for helpful advice on viral delivery strategies and immunohistochemistry.
REFERENCES
- Adesnik H, Bruns W, Taniguchi H, Huang ZJ, Scanziani M. A neural circuit for spatial summation in visual cortex. Nature 490: 226–231, 2012 [DOI] [PMC free article] [PubMed] [Google Scholar]
- Albrecht DG, Hamilton DB. Striate cortex of monkey and cat: contrast response function. J Neurophysiol 48: 217–237, 1982 [DOI] [PubMed] [Google Scholar]
- Alitto HJ, Usrey WM. Origin and dynamics of extraclassical suppression in the lateral geniculate nucleus of the macaque monkey. Neuron 57: 135–146, 2008 [DOI] [PMC free article] [PubMed] [Google Scholar]
- Allman J, Miezin F, McGuinness E. Stimulus specific responses from beyond the classical receptive field: neurophysiological mechanisms for local-global comparisons in visual neurons. Annu Rev Neurosci 8: 407–430, 1985 [DOI] [PubMed] [Google Scholar]
- Angelucci A, Bressloff PC. Contribution of feedforward, lateral and feedback connections to the classical receptive field center and extra-classical receptive field surround of primate V1 neurons. Prog Brain Res 154: 93–120, 2006 [DOI] [PubMed] [Google Scholar]
- Angelucci A, Levitt JB, Walton EJS, Hupe JM, Bullier J, Lund JS. Circuits for local and global signal integration in primary visual cortex. J Neurosci 22: 8633–8646, 2002 [DOI] [PMC free article] [PubMed] [Google Scholar]
- Atallah BV, Bruns W, Carandini M, Scanziani M. Parvalbumin-expressing interneurons linearly transform cortical responses to visual stimuli. Neuron 73: 159–170, 2012 [DOI] [PMC free article] [PubMed] [Google Scholar]
- Ayaz A, Saleem AB, Scholvinck ML, Carandini M. Locomotion controls spatial integration in mouse visual cortex. Curr Biol: 23: 890–894, 2013 [DOI] [PMC free article] [PubMed] [Google Scholar]
- Bair W, Cavanaugh JR, Movshon JA. Time course and time-distance relationships for surround suppression in macaque V1 neurons. J Neurosci 23: 7690–7701, 2003 [DOI] [PMC free article] [PubMed] [Google Scholar]
- Blakemore C, Tobin EA. Lateral inhibition between orientation detectors in the cat's visual cortex. Exp Brain Res 15: 439–440, 1972 [DOI] [PubMed] [Google Scholar]
- Bonin V, Histed MH, Yurgenson S, Reid RC. Local diversity and fine-scale organization of receptive fields in mouse visual cortex. J Neurosci 31: 18506–18521, 2011 [DOI] [PMC free article] [PubMed] [Google Scholar]
- Carandini M, Heeger DJ. Normalization as a canonical neural computation. Nat Rev Neurosci 13: 51–62, 2012 [DOI] [PMC free article] [PubMed] [Google Scholar]
- Cavanaugh JR, Bair W, Movshon JA. Nature and interaction of signals from the receptive field center and surround in macaque V1 neurons. J Neurophysiol 88: 2530–2546, 2002 [DOI] [PubMed] [Google Scholar]
- DeAngelis GC, Freeman RD, Ohzawa I. Length and width tuning of neurons in the cat's primary visual cortex. J Neurophysiol 71: 347–374, 1994 [DOI] [PubMed] [Google Scholar]
- Dombeck DA, Khabbaz AN, Collman F, Adelman TL, Tank DW. Imaging large-scale neural activity with cellular resolution in awake, mobile mice. Neuron 56: 43–57, 2007 [DOI] [PMC free article] [PubMed] [Google Scholar]
- Einevoll GT, Franke F, Hagen E, Pouzat C, Harris KD. Towards reliable spike-train recordings from thousands of neurons with multielectrodes. Curr Opin Neurobiol 22: 11–17, 2012 [DOI] [PMC free article] [PubMed] [Google Scholar]
- Gilbert CD, Das A, Ito M, Kapadia M, Westheimer G. Spatial integration and cortical dynamics. Proc Natl Acad Sci USA 93: 615–622, 1996 [DOI] [PMC free article] [PubMed] [Google Scholar]
- Gilbert CD, Wiesel TN. The influence of contextual stimuli on the orientation selectivity of cells in primary visual cortex of the cat. Vision Res 30: 1689–1701, 1990 [DOI] [PubMed] [Google Scholar]
- Girman SV, Sauvé Y, Lund RD. Receptive field properties of single neurons in rat primary visual cortex. J Neurophysiol 82: 301–311, 1999 [DOI] [PubMed] [Google Scholar]
- Gonchar Y, Wang Q, Burkhalter A. Multiple distinct subtypes of GABAergic neurons in mouse visual cortex identified by triple immunostaining. Front Neuroanat 1: 3, 2007 [DOI] [PMC free article] [PubMed] [Google Scholar]
- Haider B, Häusser M, Carandini M. Inhibition dominates sensory responses in the awake cortex. Nature 493: 97–100, 2013 [DOI] [PMC free article] [PubMed] [Google Scholar]
- Hazan L, Zugaro M, Buzsaki G. Klusters, NeuroScope, NDManager: a free software suite for neurophysiological data processing and visualization. J Neurosci Methods 155: 207–216, 2006 [DOI] [PubMed] [Google Scholar]
- Kapadia MK, Westheimer G, Gilbert CD. Dynamics of spatial summation in primary visual cortex of alert monkeys. Proc Natl Acad Sci USA 96: 12073–12078, 1999 [DOI] [PMC free article] [PubMed] [Google Scholar]
- Knierim JJ, van Essen DC. Neuronal responses to static texture patterns in area V1 of the alert macaque monkey. J Neurophysiol 67: 961–980, 1992 [DOI] [PubMed] [Google Scholar]
- Levitt JB, Lund JS. Contrast dependence of contextual effects in primate visual cortex. Nature 387: 73–76, 1997 [DOI] [PubMed] [Google Scholar]
- Levitt JB, Lund JS. The spatial extent over which neurons in macaque striate cortex pool visual signals. Vis Neurosci 19: 439–452, 2002 [DOI] [PubMed] [Google Scholar]
- Liu BH, Li P, Sun YJ, Li YT, Zhang LI, Tao HW. Intervening inhibition underlies simple-cell receptive field structure in visual cortex. Nat Neurosci 13: 89–96, 2009 [DOI] [PMC free article] [PubMed] [Google Scholar]
- Logothetis NK, Kayser C, Oeltermann A. In vivo measurement of cortical impedance spectrum in monkeys: implications for signal propagation. Neuron 55: 809–823, 2007 [DOI] [PubMed] [Google Scholar]
- Ma WP, Liu BH, Li YT, Huang ZJ, Zhang LI, Tao HW. Visual representations by cortical somatostatin inhibitory neurons–selective but with weak and delayed responses. J Neurosci 30: 14371–14379, 2010 [DOI] [PMC free article] [PubMed] [Google Scholar]
- Maier A, Aura CJ, Leopold DA. Infragranular sources of sustained local field potential responses in macaque primary visual cortex. J Neurosci 31: 1971–1980, 2011 [DOI] [PMC free article] [PubMed] [Google Scholar]
- Markram H, Toledo-Rodriguez M, Wang Y, Gupta A, Silberberg G, Wu C. Interneurons of the neocortical inhibitory system. Nat Rev Neurosci 5: 793–807, 2004 [DOI] [PubMed] [Google Scholar]
- Marshel JH, Garrett ME, Nauhaus I, Callaway EM. Functional specialization of seven mouse visual cortical areas. Neuron 72: 1040–1054, 2011 [DOI] [PMC free article] [PubMed] [Google Scholar]
- Marshel JH, Kaye AP, Nauhaus I, Callaway EM. Anterior-posterior direction opponency in the superficial mouse lateral geniculate nucleus. Neuron 76: 713–720, 2012 [DOI] [PMC free article] [PubMed] [Google Scholar]
- Mitzdorf U. Current source-density method and application in cat cerebral cortex: investigation of evoked potentials and EEG phenomena. Physiol Rev 65: 37–100, 1985 [DOI] [PubMed] [Google Scholar]
- Nelson JI, Frost BJ. Orientation-selective inhibition from beyond the classic visual receptive field. Brain Res 139: 359–365, 1978 [DOI] [PubMed] [Google Scholar]
- Niell CM, Stryker MP. Highly selective receptive fields in mouse visual cortex. J Neurosci 28: 7520–7536, 2008 [DOI] [PMC free article] [PubMed] [Google Scholar]
- Nienborg H, Hasenstaub A, Nauhaus I, Taniguchi H, Huang ZH, Callaway EM. Contrast dependence and differential contributions from somatostatin- and parvalbumin-expressing neurons to spatial integration in mouse V1. J Neurosci 33: 11145–11154, 2013 [DOI] [PMC free article] [PubMed] [Google Scholar]
- Ohki K, Chung S, Ch'ng YH, Kara P, Reid RC. Functional imaging with cellular resolution reveals precise micro-architecture in visual cortex. Nature 433: 597–603, 2005 [DOI] [PubMed] [Google Scholar]
- Osaki H, Naito T, Sadakane O, Okamoto M, Sato H. Surround suppression by high spatial frequency stimuli in the cat primary visual cortex. Eur J Neurosci 33: 923–932, 2011 [DOI] [PubMed] [Google Scholar]
- Piscopo DM, El-Danaf RN, Huberman AD, Niell CM. Diverse visual features encoded in mouse lateral geniculate nucleus. J Neurosci 33: 4642–4656, 2013 [DOI] [PMC free article] [PubMed] [Google Scholar]
- Quiroga RQ, Nadasdy Z, Ben-Shaul Y. Unsupervised spike detection and sorting with wavelets and superparamagnetic clustering. Neural Comput 16: 1661–1687, 2004 [DOI] [PubMed] [Google Scholar]
- Reynaud A, Masson GS, Chavane F. Dynamics of local input normalization result from balanced short- and long-range intracortical interactions in area V1. J Neurosci 32: 12558–12569, 2012 [DOI] [PMC free article] [PubMed] [Google Scholar]
- Ries CR, Puil E. Ionic mechanism of isoflurane's actions on thalamocortical neurons. J Neurophysiol 81: 1802–1809, 1999 [DOI] [PubMed] [Google Scholar]
- Runyan CA, Schummers J, Van Wart A, Kuhlman SJ, Wilson NR, Huang ZJ, Sur M. Response features of parvalbumin-expressing interneurons suggest precise roles for subtypes of inhibition in visual cortex. Neuron 67: 847–857, 2010 [DOI] [PMC free article] [PubMed] [Google Scholar]
- Sachdev RNS, Krause MR, Mazer JA. Surround suppression and sparse coding in visual and barrel cortices. Front Neural Circuits 6: 43, 2012 [DOI] [PMC free article] [PubMed] [Google Scholar]
- Sadakane O, Ozeki H, Naito T, Akasaki T, Kasamatsu T, Sato H. Contrast-dependent, contextual response modulation in primary visual cortex and lateral geniculate nucleus of the cat. Eur J Neurosci 23: 1633–1642, 2006 [DOI] [PubMed] [Google Scholar]
- Sceniak MP, Hawken MJ, Shapley R. Visual spatial characterization of macaque V1 neurons. J Neurophysiol 85: 1873–1887, 2001 [DOI] [PubMed] [Google Scholar]
- Sceniak MP, Maciver MB. Cellular actions of urethane on rat visual cortical neurons in vitro. J Neurophysiol 95: 3865–3874, 2006 [DOI] [PubMed] [Google Scholar]
- Sceniak MP, Ringach DL, Hawken MJ, Shapley R. Contrast's effect on spatial summation by macaque V1 neurons. Nat Neurosci 2: 733–739, 1999 [DOI] [PubMed] [Google Scholar]
- Schwabe L, Ichida JM, Shushruth S, Mangapathy P, Angelucci A. Contrast-dependence of surround suppression in Macaque V1: experimental testing of a recurrent network model. Neuroimage 52: 777–792, 2010 [DOI] [PMC free article] [PubMed] [Google Scholar]
- Shushruth S, Ichida JM, Levitt JB, Angelucci A. Comparison of spatial summation properties of neurons in macaque V1 and V2. J Neurophysiol 102: 2069–2083, 2009 [DOI] [PMC free article] [PubMed] [Google Scholar]
- Shushruth S, Mangapathy P, Ichida JM, Bressloff PC, Schwabe L, Angelucci A. Strong recurrent networks compute the orientation tuning of surround modulation in the primate primary visual cortex. J Neurosci 32: 308–321, 2012 [DOI] [PMC free article] [PubMed] [Google Scholar]
- Silberberg G, Markram H. Disynaptic inhibition between neocortical pyramidal cells mediated by Martinotti cells. Neuron 53: 735–746, 2007 [DOI] [PubMed] [Google Scholar]
- Smith SL, Häusser M. Parallel processing of visual space by neighboring neurons in mouse visual cortex. Nat Neurosci 13: 1144–1149, 2010 [DOI] [PMC free article] [PubMed] [Google Scholar]
- Solomon SG, White AJ, Martin PR. Extraclassical receptive field properties of parvocellular, magnocellular, and koniocellular cells in the primate lateral geniculate nucleus. J Neurosci 22: 338–349, 2002 [DOI] [PMC free article] [PubMed] [Google Scholar]
- Solomon SG, White AJ, Martin PR. Temporal contrast sensitivity in the lateral geniculate nucleus of a New World monkey, the marmoset Callithrix jacchus. J Physiol 517: 907–917, 1999 [DOI] [PMC free article] [PubMed] [Google Scholar]
- Somers DC, Todorov EV, Siapas AG, Toth LJ, Kim DS, Sur M. A local circuit approach to understanding integration of long-range inputs in primary visual cortex. Cereb Cortex 8: 204–217, 1998 [DOI] [PubMed] [Google Scholar]
- Swadlow HA. Fast-spike interneurons and feedforward inhibition in awake sensory neocortex. Cereb Cortex 13: 25–32, 2003 [DOI] [PubMed] [Google Scholar]
- Tailby C, Solomon SG, Peirce JW, Metha AB. Two expressions of “surround suppression” in V1 that arise independent of cortical mechanisms of suppression. Vis Neurosci 24: 99–109, 2007 [DOI] [PubMed] [Google Scholar]
- Van den Bergh G, Zhang B, Arckens L, Chino YM. Receptive-field properties of V1 and V2 neurons in mice and macaque monkeys. J Comp Neurol 518: 2051–2070, 2010 [DOI] [PMC free article] [PubMed] [Google Scholar]
- Villeneuve MY, Casanova C. On the use of isoflurane versus halothane in the study of visual response properties of single cells in the primary visual cortex. J Neurosci Methods 129: 19–31, 2003 [DOI] [PubMed] [Google Scholar]
- Wang Q, Gao E, Burkhalter A. Gateways of ventral and dorsal streams in mouse visual cortex. J Neurosci 31: 1905–1918, 2011 [DOI] [PMC free article] [PubMed] [Google Scholar]
- Wang Y, Toledo-Rodriguez M, Gupta A, Wu C, Silberberg G, Luo J, Markram H. Anatomical, physiological and molecular properties of Martinotti cells in the somatosensory cortex of the juvenile rat. J Physiol 561: 65–90, 2004 [DOI] [PMC free article] [PubMed] [Google Scholar]
- Webb BS, Dhruv NT, Solomon SG, Tailby C, Lennie P. Early and late mechanisms of surround suppression in striate cortex of macaque. J Neurosci 25: 11666–11675, 2005 [DOI] [PMC free article] [PubMed] [Google Scholar]
- Wilson NR, Runyan CA, Wang FL, Sur M. Division and subtraction by distinct cortical inhibitory networks in vivo. Nature 488: 343–348, 2012 [DOI] [PMC free article] [PubMed] [Google Scholar]
- Yoshimura Y, Callaway EM. Fine-scale specificity of cortical networks depends on inhibitory cell type and connectivity. Nat Neurosci 8: 1552–1559, 2005 [DOI] [PubMed] [Google Scholar]