

Abstract
We often make reaching movements having similar trajectories within very different mechanical environments, for example, with and without an added load in the hand. Under these varying conditions, our kinematic intentions must be transformed into muscle commands that move the limbs. Primary motor cortex (M1) has been implicated in the neural mechanism that mediates this adaptation to new movement dynamics, but our recent experiments suggest otherwise. We have recorded from electrode arrays that were chronically implanted in M1 as monkeys made reaching movements under two different dynamic conditions: the movements were opposed by either a clockwise or counterclockwise velocity-dependent force field acting at the hand. Under these conditions, the preferred direction (PD) of neural discharge for nearly all neurons rotated in the direction of the applied field, as did those of proximal limb electromyograms (EMGs), although the median neural rotation was significantly smaller than that of muscles. For a given neuron, the rotation angle was very consistent, even across multiple sessions. Within the limits of measurement uncertainty, both the neural and EMG changes occurred nearly instantaneously, reaching a steady state despite ongoing behavioral adaptation. Our results suggest that M1 is not directly involved in the adaptive changes that occurred within an experimental session. Rather, most M1 neurons are directly related to the dynamics of muscle activation that themselves reflect the external load. It appears as though gain modulation, the differential recruitment of M1 neurons by higher motor areas, can account for the load and behavioral adaptation-related changes in M1 discharge.
Keywords: reaching movements, monkey, curl fields, inverse dynamics model
a compelling view of the role of the primary motor cortex (M1) during reaching is that it instantiates an internal, inverse model of the arm. In this view, the model receives inputs in an extrinsic, kinematic space (e.g., the desired movement of the hand toward an object) that are transformed into the intrinsic, angular coordinates of the limb and ultimately into a sequence of muscle activations that accelerate the limb (Buneo et al. 1995; Flanagan and Wing 1997; Kalaska and Crammond 1992; Kawato 1999).
Beyond the theoretical appeal of such models, perhaps the most convincing experimental evidence for the existence of internal models comes from psychophysical studies of motor adaptation. Point-to-point reaching movements between targets are typically nearly straight, with a smoothly accelerating speed profile that causes the hand to follow a minimum jerk trajectory (Flash and Hogan 1985). This trajectory can be disrupted, however, by applying an external force field to the hand (Lackner and Dizio 1994; Shadmehr and Mussa-Ivaldi 1994). If the disturbance is predictable, the subject adapts and movement trajectory returns approximately to normal. However, when the original conditions are restored, the trajectories briefly take on roughly the opposite distortion of that initially caused by the perturbation. These adaptation aftereffects are thought to reveal the effects of an internal model that was updated during the process of adaptation.
Whereas the idea that the brain might embody an internal model of the limb is reasonably well accepted, the question of how and where such a model is actually instantiated is not at all clear. A variety of theoretical models have been proposed, most involving the primary and premotor cortices, and their interconnections with the cerebellum (Hollerbach 1982; Kawato 1999; Loeb et al. 1999; Miall and Wolpert 1996; Schweighofer et al. 1998; Shadmehr et al. 2010). There is evidence that neurons in M1 are more closely related to the dynamics of movement, whereas premotor cortex appears to be more closely related to movement kinematics and the target of the intended reach (Hatsopoulos et al. 2004; Kakei et al. 2001). A compelling view is that this reflects a kinematic-to-dynamic transformation of movement intent into execution (Alexander and Crutcher 1990; Bhushan and Shadmehr 1999; Buneo et al. 1995; Flanagan and Wing 1997; Kalaska and Crammond 1992; Kawato 1999).
If this network instantiates an adaptive internal model, one might expect to see evidence of this adaptation in neuronal discharge during behavioral adaptation. Several studies have examined neural discharge in motor cortex during visuomotor adaptation. Although the discharge of task-related neurons in M1 was altered during the adaptation, in several cases this adaptation lagged well behind the behavioral changes (Paz et al. 2005; Paz and Vaadia 2009; Wise et al. 1998). In contrast to the late changes in M1, the same group found changes in the discharge in the supplementary motor cortex (SMA) that occurred relatively early in adaptation (Paz et al. 2005).
The late time course of neural changes has led to the suggestion that the activity is related to consolidation of learning, rather than the initial adaptive process. Further evidence of this possibility is given by experiments in which repetitive transcranial magnetic stimulation (rTMS) delivered to M1 interfered not with the development of the adapted behavior but with its subsequent consolidation (Muellbacher et al. 2002; Overduin et al. 2009). However, other experiments have found adaptation-related modification of M1 discharge during the execution phase of movement (Gandolfo et al. 2000; Li et al. 2001). These experiments involved not a kinematic, visuomotor perturbation but a dynamic perturbation induced by curl force fields much like those used in our study. These experiments revealed a range of different neuronal responses to the force fields, characterized in terms of the angle of rotation of each neuron's tuning curve. One large group (44%) had PDs that appeared to be unaffected by the curl field. Another similarly sized group had a washout period PD that differed from that in the baseline period. These they called “memory cells,” reflecting the fact that they were not affected only by the current state but “remembered” their state from the preceding condition. The authors speculated that these cells embody the adapted internal model, perhaps contributing to the savings that accumulate across sessions.
In our experiments, we examined both the immediate and the adaptive changes that occurred in both muscle activity and neuronal discharge on exposure to velocity-dependent force fields during reaching movements. We found that like muscles, essentially all neurons rotated their tuning instantaneously whenever the field was changed. The magnitude of these changes was distributed fairly broadly but was, on average, significantly smaller than that of the muscles. Remarkably, despite this variety of tuning changes across neurons, the tuning of any given neuron for any particular loading condition was quite stable, even across sessions. We found no evidence of the memory cells described earlier. Only a small minority of M1 neurons had tuning changes that mimicked the time course of the adaptive behavioral changes. Our results indicate that if M1 neurons do comprise an inverse model, the model appears to be stable in the face of the behavioral adaptation that occurs on exposure to altered movement dynamics. Our evidence would suggest that the neuronal changes mediating this adaptation occurred upstream of the neurons we recorded in M1. The dynamics between M1 and muscle activity appear to have remained largely fixed.
METHODS
Tasks and training.
Two monkeys (AR and FZ) were trained to sit in a primate chair, with the upper arm and forearm constrained largely to a horizontal plane, and grasp the handle of a two-link planar manipulandum. The handle moved within a 20 × 20-cm workspace, and its position was displayed as a circular cursor, ∼1 cm in diameter, on a computer screen in front of the monkey (Fig. 1). The monkeys were trained on a visually guided, random-target task that was used for most of the analyses in this study. A series of 2 × 2-cm square targets appeared anywhere within the workspace, and the monkeys had 0.85–1.10 s to acquire each target. A typical trial sequence consisted of four targets. The monkey acquired the initial target by moving the manipulandum and immediately after acquisition was presented with the next target. After four targets were successfully acquired, the monkey was given a fluid reward. After a short intertrial interval of 1.75–2.00 s, the monkey was presented with the next sequence of targets. The trajectories shown in Fig. 1 represent an actual sequence of movements spanning 40 s.
Fig. 1.

Schematic representation of the fields experiment. In counterclockwise (CCW) and clockwise (CW) velocity-dependent force fields, the purple curve represents a typical 20-s hand path. Arrows represent the orientation of the fields, 80° for the CCW field and −45° for CW field. Monkeys moved the manipulandum handle in a horizontal plane to control movement of the cursor (yellow circle) on a vertical monitor. Red square denotes the target location.
Monkey FZ was also trained on a standard center-out paradigm. In this task, all trials began with the acquisition of a center target, 2.3 cm on a side. The monkey was required to hold within this target for 0.5–1.0 s. After this hold period, a peripheral target was displayed 10 cm away in 1 of 8 directions, equally spaced at 45° intervals. The monkey had 1.25 s to acquire the outer target, which had to be held for at least 0.1 s.
The random-target task encouraged the monkey to move quickly, with minimal pauses in movement between presentations of individual targets. The monkeys typically executed 600–700 movements during the exposure to any given field condition, many more than was typical of the center-out paradigm. Figure 2A shows a typical series of four targeted movements comprising a single trial, beginning with the movement to the initial target in the lower right corner. The speed profile corresponding to this sequence is displayed in Fig. 2B. In many cases (for example, target 2) the monkey passed rapidly through the target and then slowed before accelerating to the next target. The large number of faster movements increased the precision with which we could determine preferred directions (described below) and may also have caused more rapid adaptation.
Fig. 2.

Example trajectory of a single trial in the random-target task. A: position plot of a single 4-target sequence within the full 20-cm2 workspace. Arrows indicate direction of movement, and squares denote the target locations. Curvature (k) of each movement segment between targets is indicated. B: speed profile through the course of the trial. Open squares denote the time at which the monkey entered a given target.
We studied the signals encoded by M1 discharge while a force was applied to the handle. The magnitude of the force (F) was proportional to the hand speed (V) (F = β·V; β = 0.07 Ns/cm), and its direction was either −45° or 80° from the direction of motion for clockwise (CW) and counterclockwise (CCW) fields, respectively. We chose not to use forces orientated 90° from the direction of motion, because the handle tended to become unstable. We used the combination of two oppositely directed curl fields to increase the relative magnitude of the forces applied to the hand to a level that the monkeys would have been unwilling to work against had it been a single field compared with null. This made the field-related changes in electromyography (EMG) and neural discharge much larger and increased the statistical power of our analyses. Each monkey was first exposed only to the CCW field until it was well learned over many sessions, at which point alternating exposure to the two fields was begun.
Surgery.
Once a monkey was able to perform the tasks satisfactorily, we performed a surgery to implant a 100-electrode intracortical array with 1.5-mm electrodes (Blackrock Microsystems). We made a craniotomy centered above the arm area of M1, ∼15 mm from the midline and 14 mm anterior to the intra-aural line. After opening the dura, we identified an area on the crown of the precentral gyrus, just medial to the spur of the arcuate sulcus. We stimulated within this area using a ball electrode (50-Hz, 100-μs pulse width biphasic pulses, <5 mA). We identified the location that elicited proximal arm movements and inserted the array with a pneumatic inserter. The dura was closed over the array, with a piece of artificial pericardium (Preclude ePTFE membrane; Gore and Associates) under the dura to prevent the back of the array from adhering to the dura. Another piece of Preclude was placed over the dura. The original bone flap was replaced, and the skin was closed over the craniotomy. All leads from the array were routed to a percutaneous connector secured to the skull of the subject.
In a separate procedure performed 30–45 days later, we implanted epimysial electrodes on the clavicular head of pectoralis, latissimus dorsi, the anterior, medial, and posterior heads of deltoid, biceps, the lateral head of triceps, and brachioradialis. We identified muscles intraoperatively with reference to photographs of previous dissections and by observing the twitches produced by electrical stimulation (20–30-Hz, 200-μs pulse width at <10 mA). Electrode leads were routed to a connector surgically mounted in the skin of the monkey's back (Miller et al. 1993). All surgical and experimental procedures were approved by the Institutional Animal Care and Use Committee of Northwestern University.
Data acquisition and recording.
After recovery from the second surgical procedure, experiments were begun when each monkey was able to perform at least 300 three-movement sequences correctly. A typical session required 40–60 min. The monkey performed three 10- to 15-min blocks of random-target trials. The first block was under the CCW field (CCW1), followed by the CW field and ending with the CCW field (CCW2). We collected additional behavioral data from one of the monkeys (FZ) during the center-out task in the null field.
After each session, we sorted the data offline using the Offline Sorter software package from Plexon. Neurons were projected into principal components (PC) space, and we typically used the magnitude of first and second PCs to identify individual neurons. We also examined histograms of interspike interval (ISI) to verify the presence of a refractory period. We considered the occurrence of fewer than 1% of intervals shorter than 1 ms as evidence that the spikes came from a single neuron. We identified neurons that were recorded stably across experimental sessions (days) by examining their ISI distributions and action potential waveforms (Rebesco et al. 2010). First, a null distribution of Kolmogorov-Smirnov (KS) statistics was computed from the pairwise comparison of neurons known to be distinct because they were recorded from separate electrodes. Next, the KS statistics for potential pairs of neurons thought to be the same were compared with this null distribution. Analysis of waveforms was done similarly to produce a set of empirical P values. If the P values for any prospective match were <0.05 across all 4 days, we considered the pair to represent a single neuron and analyzed the corresponding tuning changes across time. These classifications were verified by inspection.
Data analysis: EMG and neuronal tuning curves.
We used two different methods to calculate tuning curves: one based on average discharge computed after binning movements according to their direction, and the other based on a generalized linear model (GLM) used to fit the discharge to the random-target trajectory (McCullagh and Nelder 1989; Truccolo et al. 2005). The methods were applied to both EMG and neuronal discharge signals. It is important to note that both of these methods were based on regressing the discharge or EMG signals against the actual direction of hand motion at an appropriate time lag, not simply the intended target position.
In the first method, individual movements were parsed from the random-target task and separated into 45°-wide bins according to the movement direction. The mean EMG activity corresponding to each movement was measured in a 200-ms window centered 50 ms before peak movement velocity. The grand average plotted as a function of direction defined the tuning curve of each muscle. We fitted a sinusoid to these points of the form y = b0 + c1cos(θ − θ0), the quality of which was expressed as R2, and PD was defined as θ0. We calculated tuning curves for neurons in a similar fashion, measuring activity in a 200-ms window centered 100 ms before peak movement velocity.
We computed 95% confidence bounds on these tuning curve estimates using a bootstrapping procedure with 1,000 iterations (Davison and Hinkley 1997; Efron and Tibshirani 1997). Bootstrapping consists of repeatedly resampling the original data with replacement, to generate a distribution of tuning curve parameters from which confidence intervals can be estimated by counting the number of times any given parameter falls outside a given range. To test whether there was a significant change in the PD between conditions, we fitted sinusoids to each sample and examined the distribution of PD differences for the two conditions. If the 95% confidence interval for this distribution did not contain 0, we concluded that the difference was significant at the 5% level (Churchland and Shenoy 2007; Stevenson et al. 2011). We used similar methods to test for changing levels of co-contraction. The offset term, b0, would be expected to increase with cocontraction, whereas the depth of tuning, c1, would decrease. In addition to the individual terms, we computed the ratio of these terms, b0/c1, as a summary measure of cocontraction for each muscle.
To classify the field dependence of a given neuron (or muscle), we determined whether the PDs differed across the three sequential field presentations. Neurons whose tuning did not change (at the 5% confidence level) for any of the three blocks were classified as “kinematic” (designated AAA). At the other extreme, neurons whose tuning differed for all three blocks were designated ABC. “Dynamic” cells (ABA) were those having the same PD for the CCW1 and CCW2 fields, both of which differed from that of the CW field. Differing CCW1 and CCW2 PDs were the hallmark of the two types of memory cells (ABB and AAB), which were distinguished by comparing the two CCW fields with the CW field. Finally, a type ABC neuron might more nearly resemble the ABA classification or either of the two memory types, depending on the actual angle between each of the PDs. To quantify this effect, we computed a memory index by dividing the distance between the CCW2 and CCW1 PDs by the minimum distance between the CCW and CW PDs:
| (1) |
Memory index values <1.0 were more like ABA, whereas values >1.0 were more like memory cells.
The GLM provided a second, independent means to determine tuning curves without the need to bin individual movements. To compute the GLM, we assumed that the number of spikes within a time interval dt = 10 ms was drawn from a Poisson distribution,
| (2) |
and described the instantaneous firing rate of the neuron, λ, conditional on the instantaneous direction of hand velocity, as
| (3) |
where θt is the velocity at time t and Δt = −100 ms is the time lag between movement and neural activity. We estimated the parameters b0, b1, and b2 by maximizing the log-likelihood. From the fitted parameters, we computed an amplitude, G, and a preferred direction, Ψ, to give
| (4) |
Across all neurons, the two methods of determining PDs agreed almost perfectly, with a correlation of 0.94. Unless otherwise noted, the results reported in this article are derived from the tuning curves based on the first method, the more common vector sum of binned firing rates.
Data analysis: movement and adaptation.
We examined the trajectories for evidence of behavioral adaptation to the effects of the force fields by noting changes in movement curvature. This is fairly straightforward for the center-out task, with its approximately straight movements. Determining curvature in the random-target task was more complex and considerably noisier. We divided the continuous movements into a series of 2-min segments. Within each segment, we examined the movement trajectories between targets. To identify individual movements, we looked for peaks in the hand speed that exceeded 3.2 cm/s, which worked well to isolate movements between targets. Once individual movements were identified, we computed curvature at each point along the movement path using the following equation:
| (5) |
It is worth noting that this measure is the inverse of the radius of curvature. The average curvature (k) for each of the three movement segments is shown on Fig. 2A. Positive values are associated with CCW curvature, whereas CW curvature is negative.
During the random target task, we computed the average curvature within 2-min segments. To test for significant changes as a result of adaptation during the CW field presentation, we fitted a line to the curvature data of each monkey. We used bootstrapping (1,000 samples with replacement) to determine a P value for the null hypothesis that the slope of the linear regression was 0. We used the same approach to determine whether there were significant changes in PD (ΔPD) across a number of different subpopulations of neurons during the CW block.
Finally, we tested the significance of the relation between the PDs and trajectory curvature during the period of adaptation to the CW field using the following model:
| (6) |
where ε is zero mean noise. Using bootstrapping to compute a confidence interval for Δcurvature/ΔPD, we tested whether k differed significantly from 0, and hence whether there was a significant linear relation between the two measures.
RESULTS
Effect of the curl force fields on movement and muscle activity.
We collected data during four sessions with each monkey. We have described the effect of the force fields on EMG activity and kinematics at greater length elsewhere (Cherian et al. 2011). In brief, there were no differences in the distribution of positions for either monkey. However, the root mean square (RMS) velocity was ∼10% higher during the CCW field for both monkeys. Seven of the 8 muscles also had significantly higher overall activation in the CCW field (ANOVA, P < 0.01). Although there were small, field-dependent changes for several muscles in our measures of cocontraction, they were not consistent across muscles or monkeys. More importantly, among the 100 comparisons across all 3 metrics, there was a single comparison (for B0) with P = 0.01 and another with P = 0.02, roughly the level that would have been expected by chance. P values for the other comparisons were all >0.1.
When the field direction changed, the tuning curves of all muscles rotated in the direction of the field by an amount that differed across muscles. Figure 3A shows the distribution of PDs for all recorded muscles across all of the sessions for both monkeys. The origin of each line on the inner circle indicates the PD of a given muscle during CCW1, whereas the end of the line on the outer ring indicates its CW PD. The general clockwise rotation can easily be seen.
Fig. 3.
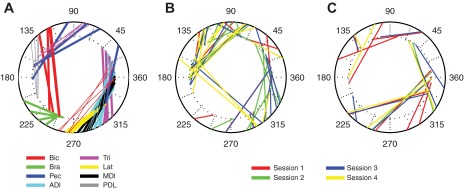
Distribution of the preferred directions in the initial CCW field (CCW1; inner ring) and the CW field (outer ring). A: muscle preferred directions (PDs) for all sessions for monkey AR (thick lines) and monkey FZ (thin lines). Line color indicates the muscle: Bic, biceps; Bra, brachioradialis; Pec, the clavicular head of pectoralis; ADl, MDl, and PDl, anterior, medial, and posterior heads of deltoid; Tri, lateral head of triceps; Lat, latissimus dorsi. B and C: neuronal PDs for monkey AR and monkey FZ, respectively. Only neurons with sinusoidal tuning fits of R2 > 0.60 for all 3 field conditions were included. Line color represents the 4 different sessions.
The average rotation across all muscles between CCW1 and the CW field was −77 ± 36° (all measures are means ± SD unless otherwise indicated). The average rotation from CW to CCW2 was essentially identical but of the opposite sign: 77 ± 35°. Nearly 88% of the EMG tuning curves had PDs that could be estimated with 95% confidence bounds narrower than ±15°, and 60% were narrower than ±7.5°. Figure 3, B and C, indicate the responses of individual neurons, described in greater detail below. To determine the time course of these changes, we computed PDs in 2-min segments, the shortest length that yielded adequate precision. We compared the PD of each muscle in the last 2-min segment of the CCW1 field with that in the first segment of the CW field. The vast majority of these comparisons (40 of 44 across all sessions, muscles, and monkeys) was significant (bootstrap comparison, P < 0.05). We also compared the first CW segment to the last CW segment. Of these, 37 comparisons were not significantly different. We conclude that the muscle PDs changed immediately with the change in field direction.
Based on bootstrap analysis of the significance of PD differences across all muscles and sessions, 27 EMG PD shifts were classified as type ABA, 14 as type ABC, and 1 as type ABB. The ABB classification was for a single triceps recording in which the tuning curve in the final CCW field appeared to be bimodal, with a 180° confidence interval, making it impossible to determine the PD with any precision. The median of the memory index (see methods for details) distribution for the type ABC EMGs was 0.10. Thus there appeared to be essentially no history effect of the fields on EMG activity, but rather that the muscles simply responded to the applied fields.
Evidence of behavioral adaptation during the random target task.
Despite its numerous advantages, seeing evidence of behavioral adaptation during the random target task was considerably more difficult than with the more traditional center-out task. We used two approaches to identify possible adaptation. For both monkeys, we measured the curvature during the random-target task directly. Because this measure proved to be somewhat noisy, for one monkey we also measured the size of the null field aftereffects in the center-out task immediately following exposure to the field during both the random-target and center-out tasks.
Figure 2A illustrates the highly curved paths that depended on the relative locations of the upcoming targets as well as the recent history of the movement. This complex history effect makes any additional curvature due to adaptation to the fields difficult to see. To examine the change in curvature across time on exposure to the fields, we computed the average curvature of the same 2-min segments of data used to study the time course of PD changes. Each colored line of Fig. 4 represents the data from one of four sessions, collected on sequential days. Both monkeys (AR, A; FZ, B) had a slightly negative curvature during the CCW1 field, monkey FZ more so than monkey AR. On exposure to the CW field, the curvature increased immediately to a positive value, reflecting the mechanical effect of the field. Both this change and the subsequent one at the end of the CW block were significant for both monkeys (paired t-test; AR: P < 0.01 and FZ: P < 0.05 for Fig. 4, A and B, respectively). During the CW block the curvature decreased slowly toward zero, presumably as the monkey adapted to the effects of the field. This slow change in curvature was also significant for both monkeys (AR: P = 0.001 and FZ: P = 0.04; bootstrap of first and last 2-min segment, see methods for details). If there were aftereffects caused by exposure to the CW field, we would expect to find a different curvature at the end of the initial CCW field (CCW1) and the beginning of CCW2, which were otherwise identical conditions. For monkey AZ, the average curvature of all the movements in all four sessions occurring within the final minute of CCW1 was significantly different from those of the initial minute of CCW2 (−0.003 and −0.041 respectively; ANOVA, P < 10−4). The difference for monkey FZ was not significant (ANOVA, P = 0.4), perhaps because of an anomalous point at the beginning of the CCW2 block of the session indicated by the red curve.
Fig. 4.

Average curvature of 2-min segments throughout 4 experimental sessions for both monkeys. A: data for monkey AR. Note that during the session with the anomalous curvature indicated in red, unlike other sessions, the monkey had worked in the CW field before exposure to the CCW1 field. B: data for monkey FZ. Data for return to the CCW field (CCW2) are not plotted for session 2 (green line), which was ended after only 6 min as a result of the monkey's poor behavior. This may also explain the anomalous curvatures earlier in the session.
Because of the noise inherent in this approach, as a second test for monkey FZ we also measured the aftereffects that occurred under null field, center-out conditions immediately after 10 min of exposure to the CW field during either the random-target or center-out tasks (Fig. 5). Figure 5A depicts the first minute of center-out movements within the CW field. The initial trajectories tended to have a clockwise displacement caused by the field. The monkey's corrective movements resulted in a CCW (positive) curvature. After 10 min we abruptly turned off the field. Figure 5B displays the resultant aftereffects as the monkey continued to perform the center-out task within the null field. We recorded two sessions from monkey FZ under these conditions. If there were aftereffects caused by the preceding field, we would expect them to disappear during the subsequent washout period. Across the two sessions, the average deviation from a straight line during the first and last minutes of the null field was 0.99 and −0.03 cm, respectively. These numbers differed significantly (ANOVA, P = 0.02) and indicate the early presence of aftereffects in the trajectory that were eliminated following several minutes of washout in the null field.
Fig. 5.

Comparison of aftereffects induced by center-out and random-target tasks. A: 1 min of movements in the center-out task in the presence of a CW field (initial CO). Negative numbers indicate CW deviations; positive numbers indicate CCW deviations. B: initial minute of movements in the center-out task immediately following 10 min of movements in the CW field of the previous center-out task (null field - final CO). C: 1 min of movements in the random-target task in the presence of a CW field (RW). D: initial minute of movements in the center-out task immediately following 10 min of movements in the CW field of the random-target task (null field - CO). Note hooked movements, very similar to those in B, indicating adaptation to the preceding CW field. The peak deviation of each trajectory is listed for each movement.
In two additional sessions, the same monkey performed the random-target task for 10 min under the CW field. The first minute of these movements for one session is plotted in Fig. 5C. Immediately after this 10 min exposure, the monkey switched to the null field center-out task, the same conditions as in Fig. 5B. Figure 5D depicts the aftereffects in one of these sessions. The first- and last-minute deviations in this case were 1.28 and 0.02 cm, respectively. This difference was also significant (ANOVA, P = 0.006). Although the aftereffects caused by the random-target task were larger than those following the center-out task, the difference was not significant (ANOVA, P = 0.55). These results, coupled with the changes in curvature shown in Fig. 4, demonstrate that learning and adaptation occurred during the random-target task.
Effect of the curl force fields on example neurons.
We analyzed 253 neural recordings from the 4 sequential sessions from the 2 monkeys (177 from AR and 76 from FZ). It should be recognized that the 253 recordings were not all unique neurons. Sessions from monkey AR typically included 40–50 well-discriminated neurons, whereas those from monkey FZ included 17–20 neurons. The sequential sessions allowed us to track 32 individual cells (20 from monkey AR, 12 from monkey FZ) with high reliability and thereby compare their responses over the 4-day period. This retention percentage is well below the 70% average 4-day retention reported by Dickey et al. (2009), but it represents a rather conservative estimate. Using the less conservative estimate based on the results from Dickey et al., it is likely that we recorded ∼85 neurons. This number represents the 65 neurons we recorded on typical sessions with the 2 monkeys, plus 30% of 65 (the turnover expected between the first and last sessions).
We computed the quality of the sinusoidal fit to reach direction for each neuron. Fifty-two neurons for monkey AR had fits with R2 > 0.60 for all three field conditions, whereas for monkey FZ there were 23. Figure 3, B and C, shows how the PDs were distributed across angular space for neurons across all sessions. The plots include only those neurons with sinusoidal tuning R2 > 0.60. For both monkeys, these PDs were approximately uniformly distributed in both fields, and the qualitative similarity in their clockwise rotation to that of the muscles (Fig. 3A) can be readily appreciated.
Several examples of individual tuning curve rotations are presented in Fig. 6. The PD rotation in Fig. 6A (AR1:27; i.e., the 27th neuron in data set AR1) was slightly larger than the average rotation we found across the population of neurons. On transition from the CCW1 field to the CW field, the tuning curve (blue curve) retained its shape but rotated −84° as measured by the change in PD. On return to the CCW field (CCW2), the PD returned to within 4° of its initial direction. These analysis methods assume that the neuron's discharge is a sinusoidal function of movement direction. For this example neuron, all three tuning curves had R2 > 0.70. The green lines represent the 95% confidence bounds on our estimate of the preferred direction. The confidence bounds estimated under each of these conditions were quite small, making the PD for the CW field highly significantly different from that of the CCW1 field. However, the smaller 4° difference between the PDs measured in CCW1 and CCW2 fields was not significant. Hence this neuron was classified as type ABA.
Fig. 6.

Examples of force field-related tuning changes for 2 typical neurons (A and B) in primary motor cortex. The average activity in each 45° bin is represented by the points along the blue line. Magnitude of discharge (pps) corresponding to the outer ring is indicated by the smaller number within the ring near 45°. The red line is the vector sum of the blue points, and the green triangles represent 95% confidence bounds.
Figure 6B represents another cell (neuron AR1:10) from the same data set. The minimum sinusoidal R2 value across all fields was 0.58. The PD rotated −69° between the CCW1 and CW fields and −11° between the CCW1 and CCW2 fields. As in Fig. 6A, the PDs in CCW1 and CW fields were significantly different (5% significance level). Unlike the previous example, the difference between the PDs in the CCW1 and CCW2 fields was also significant. Consistent with these statistical measures, this neuron was classified as type ABC. Nonetheless, it should be noted that the final PD was much closer to the initial PD than it was to the PD during the CW field, with a memory index of only 0.16.
The consistency of these responses was further underscored by recordings from 32 neurons that we tracked across 4 successive days of experiments, two examples of which are shown in Fig. 7. Aside from the tuning of the neuron in Fig. 7B during the CW field on the first day, the PDs of both neurons were quite stable. Each day, both neurons rotated in a predictable manner when exposed to the different fields. There was an average ΔPD between CCW1 and CW of −84° and −94° for the two neurons, respectively. Both neurons consistently returned to their initial PD during the CCW2 field (not shown). Figure 8 summarizes the overall stability of the PDs for all 32 neurons within the CCW1 field across all 4 experimental days. We computed all combinations of ΔPDs across the four sessions for each neuron. The average, unsigned ΔPD was only 9 ± 6°.
Fig. 7.

Stability of tuning changes across 4 consecutive experimental days for 2 neurons (A and B). In both A and B, top row represents the tuning in the CCW1 field and bottom row represents the tuning in the CW field. The average activity in each 45° bin is represented by the blue line, whereas the red line is the vector sum of the blue averages. Green triangles represent 95% confidence bounds.
Fig. 8.

Histogram of the average PD change for 32 cells followed across 4 sequential experimental days. PD changes were computed for each neuron during the CCW1 for each session. These changes across sessions were then averaged for each neuron.
Although the majority of neurons had ΔPDs roughly approximating those shown above, there were a number of neurons with much larger or smaller ΔPDs. Figure 9A illustrates a neuron (AR1:11) with a −165° rotation. Importantly, despite this very large rotation, the cell returned to its initial PD on return to the CCW field, with a very small but significant difference of 6°. Consequently, it was also classified as ABC. However, the shape of the tuning curve during the CW field was substantially different from that of the two CCW fields, taking on a more elongated, somewhat bimodal shape (R2 value for CW was 0.47). This cell defied easy categorization. It clearly was not kinematic, nor was it in any sense a memory cell. However, although it might be labeled “kinetic,” it was not obviously “muscle-like” in its responses to the force fields.
Fig. 9.

Extreme tuning changes of 2 neurons in primary motor cortex. A: neuron with larger than average rotation between the CCW1 and CW fields. B: neuron with smaller than average rotation between the CCW1 and CW fields.
Figure 9B (AR1:36) represents another outlier neuron that was only slightly affected by the fields, rotating just −9° between the CCW1 and CW fields and only 1° between the CCW1 and CCW2 fields. Because of the very small confidence bounds for this neuron, the small difference between CCW1 and CW was significant, although the difference between CCW1 and CCW2 was not. The neuron was thus classified type ABA, with a minimum R2 value across the three fields of 0.70. This cell, too, could not be easily categorized. It responded reliably to the changing fields and was therefore not really a kinematic cell, and it was clearly not a memory cell. Like cell AR1:11, it might be considered kinetic, but not muscle-like.
Summary of the field effects on neuronal PDs.
These examples span essentially the full range of rotations that occurred between exposure to the CCW1 and CW fields, which is summarized in Fig. 10. Although there appeared to be a small cluster of neurons with a large, anomalous PD change of ∼150°, the great majority of neurons were within a single mode. The average ΔPD across all neurons was −50 ± 59°, smaller than the corresponding 77° ΔPD for muscles. Ninety-one percent of these PD changes were significant at 5%. In stark contrast, the average difference in PD between the two CCW fields was only 1 ± 22°. The minimum tuning curve R2 value across the three fields is indicated for the neurons in Fig. 10 by the color code. With increasing R2, ΔPD between the CCW1 and CW fields converged roughly to a range between −120° and −15°, whereas the difference between CCW1 and CCW2 approached zero. These results suggest that well-fit neurons, in particular, have a behavior very much like that of muscles.
Fig. 10.

PD changes across fields. Scatter plot and histograms show changes in PD across the population of neurons in the 2nd and 3rd blocks relative to that of the 1st block. Color scale indicates the R2 of a sinusoidal fit to the bootstrapped samples for each neuron, with the symbol type indicating the monkey. Numbered arrows indicate the location of example neurons from Figs. 6, 9, and 11. Gray bars indicate those neurons for which the minimum R2 value across all field conditions was >0.60. Red bars in top left histogram show the corresponding shifts in muscle tuning curves.
With the use of a definition based on the significance of either or both of the two ΔPDs (see methods), 44% of the 253 neurons were classified as ABA (n = 106) and another 44% as ABC (n = 107). Of the remaining cells, 4.5% were either AAB or ABB, the classes corresponding to a memory cell response, whereas 4.9% were classified as kinematic. Approximately 2% of the cells defied simple classification because of inconsistencies in the pairs of comparisons. When we considered only those cells for which all three tuning curves fit a sinusoid with R2 > 0.6, the statistical classification yielded only a single memory cell and no kinematic cells. Furthermore, for those neurons classified as ABC, the memory index was strongly skewed toward small (more muscle-like) values, with a median of 0.22. Virtually all neurons (97%) were thus either classified ABA or were closer to the ABA classification than to either of the two memory types or the kinematic classification.
Detailed examination of putative memory cells.
Because of the striking difference between our statistical classification and those described earlier, we looked more carefully at several candidate memory cells. Memory cells would be found near the diagonal in either quadrant 1 or 3 (an initial rotation that was not eliminated on return to the CCW field) or displaced from zero along the vertical axis (rotation only in response to the transition from CW to the CCW2 field). The single neuron (AR3:36) with R2 > 0.6 that was classified as a memory cell (type ABB) had very small PD shifts, although it was well modulated and had very small confidence intervals (Fig. 11A). It cannot be seen clearly on Fig. 10 because it is so close to the origin: coordinates (4, 5). Because its initial ΔPD was positive (the direction opposite to that of the mechanical effect of the field), it is really not consistent with the memory cell model. Likewise, the two very large outliers in quadrant 1 (AR1:41 and AR3:10) are poor candidates, given their large initial rotation opposite to the effect of the fields, unless they are considered to have rotated more than 180° in the direction of the field. More importantly, both neurons underwent rather large shape changes and were very poorly fit by a sinusoid (minimum R2 = 0.00 and 0.20, respectively), making any PD classification inappropriate.
Fig. 11.

Examples of force field-related tuning changes for 3 putative memory neurons. A: the single neuron with a tuning curve that was well fitted by a sinusoid and classified as a memory cell. B and C: outlier examples that appeared to have memory characteristics as a result of nonsinusoidal tuning curves and poor PD confidence.
Two other possible candidate memory cells within quadrant 3 are the neurons AR3:37 and AR3:25, located at (−6, −51) and (−39, −62) in the Fig. 10 scatter plot. The first of these neurons (Fig. 11B) was bimodal for all three fields, with a nearly 360° total confidence interval during CCW2 caused by the near symmetry of its tuning curve. It had a minimum R2 value across all three fields of only 0.06. The second of these neurons (Fig. 11C) had a rather strongly directional tuning curve during the CW field but a more elongated, bimodal shape during the two CCW fields. While the CCW1 and CCW2 curves appear, by eye, to have very similar orientation, small shape differences caused the large difference in measured PD. Although the tuning curve for CCW2 was particularly nonsinusoidal (R2 = 0.07), the confidence interval was nonetheless only ±43°. These two neurons were classified as type AAB and ABB, respectively, but because of the nonsinusoidal shape and the very large confidence intervals, the classification seems to be not terribly meaningful.
Across all neurons, the median confidence interval for tuning curves with R2 > 0.33 was ±6.5°. For R2 < 0.33, the confidence interval distribution increased dramatically, but surprisingly, half of these intervals remained smaller than ±30°. A strongly bimodal but asymmetric tuning curve can have a small computed confidence interval even though it fails to meet the basic assumptions of the analytical approach. These observations underscore the importance that the tuning curves meet the essential assumptions of the PD and bootstrap calculations. Thus, whether by strict statistical analysis or by eye, among those neurons that meet the basic assumptions of sinusoidal tuning, we found essentially no evidence for memory cells.
Population-level examination of putative memory cells.
In addition to closely examining individual neurons that had been automatically classified as memory cells, we examined the entire population of neurons for more subtle changes in neuronal tuning that might coincide with the time course of the observed behavioral adaptation that occurred during exposure to a given field. Figure 12 depicts the average change in tuning for eight example neurons chosen to illustrate both the typical and extreme properties within our data set. The time scale is the same as that of the trajectory curvature plots in Fig. 4, and the data are from the first session with monkey AR (red line in Fig. 4A). The confidence intervals of these examples were narrow enough (average full width of 21 ± 9°) to allow us to determine that each of these neurons changed their tuning within the initial 2-min exposure to the field (bootstrap comparison). Seven of these eight neurons maintained this tuning throughout the duration of exposure to a given field. The remaining neuron (red circles) drifted back toward zero curvature. To test whether such PD changes across the population of neurons could account for the curvature change during the CW block, we compared the PD change within the first 4 min of the field with that of the last 4 min. The mean signed difference was 0 ± 27°. Twenty-five percent of the changes were significant at 5%, substantially more than would be expected by chance (bootstrap test of PD differences). Although there were numerous neurons with small but significant ΔPDs, the direction of these changes appeared to be random, rather than with a systematic bias that might have supported an adaptation mechanism. However, it is possible that only a subset of neurons was responsible for the adaptation and that their changes were masked in the global average by other neurons with opposite changes.
Fig. 12.

Repeated tuning estimates for 9 sample neurons from monkey FZ using 2-min segments of data. Solid lines represent averages; dotted lines represent confidence bounds for neurons following separation into those with initially positive and negative rotations between the CCW1 and CW fields, respectively. Of these sample neurons, only one had a change in PD that drifted toward zero during the CW field, during the time when the change in trajectory curvature was also reduced. However, across the neuronal population, there were no systematic drifts that could account for the curvature change.
Consequently, we looked specifically at those cells classified as ABA with an initially negative rotation. This is the group whose response is most like that expected to mediate adaptation and included 38 neurons from monkey AR and 30 from FZ. Within this group, there was no tendency for PDs to return toward their original direction during the CW block (i.e., to become more kinematic; P = 0.58 for AR and P = 0.42 for FZ). In contrast, the trajectory curvature changed significantly toward zero during this same period for both monkeys (Fig. 4). There was no statistical relation between the PD and curvature changes (AR: P = 0.5; FZ P = 0.4; bootstrapping, see Eq. 6).
We also separated neurons having initially positive ΔPD (AR: 53, FZ: 18) from those with negative ΔPD (AR: 124, FZ: 58, respectively). The purple lines on Fig. 12 indicate the means for these two groups, bounded by 95% confidence limits. Neither of these changes in preferred direction during the CW block was significant for either monkey, across all sessions (bootstrap, P values all >0.7). We also tested the 25% of neurons that individually had a significantly changed PD within the CW block, looking at the entire group as well as those with initially either positive or negative ΔPDs. None of these two groups for either monkey had a slope that was significantly different from zero. All but one of these six comparisons had P > 0.4. A single comparison (all neurons of monkey AR that changed their PD within the CW block) had P = 0.085. Thus the slow behavioral adaptation that occurred on the transition between fields did not appear to be related to systematic changes in the discharge of M1 neurons.
DISCUSSION
Summary.
To test the role of M1 neurons during adaptation to altered movement dynamics, we examined the behavioral and neuronal responses to different velocity-dependent force fields during reaching. On transition between fields, the tuning curves of the great majority of M1 neurons rotated in the direction of the field, with a range of angles that largely, but not completely, overlapped the corresponding EMG rotations. Fully 95% of neurons had statistically significant rotation responses to the applied fields. Furthermore, like muscles, virtually every neuron returned to its original direction upon return to the original condition, with no evidence of the memory cells reported earlier (Gandolfo et al. 2000; Li et al. 2001).
When the fields were changed, there was an immediate, corresponding change in the sign of the trajectory curvature. The curvature magnitude subsequently decreased progressively toward zero with continued exposure to the field. This changing curvature is evidence of an ongoing behavioral adaptation similar to that reported for center-out movements during exposure to curl field forces. Importantly, the time course of neuronal PD rotation did not resemble this slow trajectory adaptation. Within the limit of our time resolution, the tuning changes in response to the field transitions were immediate (as they were for muscles), and across the population of neurons there was no tendency for the ΔPD to drift toward zero during the period when trajectory curvature was approaching zero. Thus our analysis strongly suggests that the ongoing adaptation was not a result of changes within or downstream of the neurons we recorded in M1, which continued to reflect the dynamics of the load. Instead, the behavioral changes appeared to be mediated by alterations in the inputs to these cells, from some upstream area. If M1 does embody an inverse dynamic model of the limb, it appears that it is not modified under the conditions of our experiment.
Effect of force fields on muscle activity and neuronal tuning.
Measurement of the discharge of single neurons as a function of hand movement direction has become a mainstay of single-unit research in motor control. Among these experiments are a number in which external force fields are imposed on the hand, changing the relation between muscle activity and limb motion. A pair of important studies compared the spatial tuning of neurons during reaching in null field with that of curl field conditions (Gandolfo et al. 2000; Li et al. 2001). In those studies, 34% of the tuning curves did not rotate in response to the field (“kinematic” cells). Only 22% were designated “dynamic” cells, reflecting the fact that they rotated in much the same manner as did muscle activity. Most of the remainder were called “memory cells” because their responses were a product of the history of field exposure, as well as the current field. A more recent study from the same laboratory reached similar conclusions (Richardson et al. 2012).
There are several factors that may account for this fundamental difference from our study. Rather than comparing a single curl field with a null field, we compared two oppositely directed curl fields. Rather than the center-out task, we used a random-target task that resulted in a larger number of more rapid movements. Importantly, unlike those studies and most others using center-out movements, we regressed neural discharge to the actual direction of motion, rather than the direction of the intended target. Finally, we used chronically implanted electrode arrays rather than moveable single electrodes. We will consider each of these differences here.
There is a greater density of neurons within the central sulcus than on its exposed bank that have direct projections to motor neurons (Rathelot and Strick 2006). Had we been able to record from these deeper neurons, we might have expected to find discharge that was even more closely related to that of the muscles. However, data from the one monkey we examined had no tendency for neurons with more muscle-like characteristics to be found on the caudal edge of the array. Likewise, neither of the related studies from the Bizzi laboratory (Gandolfo et al. 2000; Li et al. 2001) reported such an observation.
In a curl field experiment, prior to any adaptive response, the unchanged muscle activity combined with the effect of the perturbing force field would cause the hand to be pushed off course in the direction of the field. Despite the altered relation between neural discharge and hand movement, PDs defined with respect to the intended target will remain unchanged, and hence, “kinematic”. However, in practice, adaptive changes occur that progressively bring the movement back in the direction of the target. These changes dictate that PD measurements should be made only when the system has reached steady state. It has been noted before that PD measurements made during incomplete adaptation will cause neurons to appear to shift in a direction opposite to the field (Padoa-Schioppa et al. 2004; Richardson et al. 2012), specifically, we would add, by an amount equal to the mismatch between the target and actual movement directions. The incomplete adaptation in the Bizzi studies revealed by the intertrial correlation analysis of movement trajectories (Fig. 1B in Gandolfo et al. 2000 and Fig. 2A in Li et al. 2001) could have caused classification to be biased toward kinematic-type cells.
Measuring PDs with respect to actual movement, as we have done, should eliminate this bias and allow us to measure meaningful PDs during any state of adaptation. Our analysis does make the assumption that PDs are stable during the measurement period, averaging across any changes that do occur. The PD of a kinematic neuron would, by definition, remain stable throughout the process of adaptation, having a fixed relation to the direction of motion. On the other hand, a muscle's PD would be expected to rotate instantaneously as the applied field changes the relation between its activity and the direction of motion. The size of this rotation would depend on the relative contributions it and other muscles make relative to the externally applied force. The same argument would be true of a dynamic neuron whose activity mimicked that of the muscles.
Instead of comparing curl field with null field, we compared CW and CCW curl fields. There is important, although not completely consistent literature addressing both “negative transfer” of learning to a second task and “retrograde interference” of the consolidation of learning of the first task that has been demonstrated for a range of motor tasks, including oppositely directed curl force fields (Brashers-Krug et al. 1996; Caithness et al. 2004; Krakauer and Shadmehr 2006). Essentially, when there is limited time for washout or consolidation between two task conditions, the first and second tasks may be relatively poorly learned or retained, respectively. However, these effects may also be dependent on contextual differences in the two settings, as well as the frequency with which the fields are alternated and the total length of exposure (Osu et al. 2004). Our monkeys were well trained on the CCW task before the (alternating) exposure to the CW field. If the latter field were not as well learned, we would expect the time course of curvature changes following the transition from CCW1 to CW to have been different from that of CW to CCW2. This was not, however, the case. None of the studies of which we are aware tested the extensive, daily training over 1–2 mo that our monkeys received, although the successful learning of opposing fields in the study by Osu and colleagues spanned 10 consecutive days. Perhaps the long training period for our monkeys allowed them to learn both fields equally well.
The advantage of the oppositely directed fields was the greater difference this provided between the two dynamic conditions. Each field was ∼15% greater in magnitude than in the related studies from Bizzi's group. Furthermore, the mean speed during the random-target task was ∼75% greater than during center-out movements. Consistent with these differences, the average muscle rotation was 80° in our study but only 20° in the earlier studies. On average, the neurons in our study rotated 65% as much as the muscles, very nearly the same as the roughly 75% reported by Li et al. (2001). Although it would be reasonable to expect that task-related muscles should have dynamics related directly to the applied load, it should be noted that only 50% of the muscle recordings in that study were actually classified as dynamic. Two were classified as kinematic, one as memory, and three as “other.” The smaller force perturbations in that study may have made small rotations harder to detect reliably in both EMG and neural activity.
Behavioral adaptation in response to altered musculoskeletal dynamics.
Many studies have now shown that with repeated movements during exposure to curl fields or other dynamic perturbations, trajectories gradually return to their intended direction (Lackner and Dizio 1994; Malfait et al. 2005; Scheidt et al. 2005; Shadmehr and Mussa-Ivaldi 1994). Cocontraction used to stiffen the limb is one possible mechanism to minimize such dynamic disturbances, but it is energetically inefficient. Instead, the mirror-image aftereffects that are expressed on return to the original conditions have been interpreted as an indication of the adaptation of an internal model that compensates for the altered dynamics of movement (Lackner and Dizio 1994; Shadmehr and Mussa-Ivaldi 1994).
Because of the more complex dynamics of our random target task, we were concerned that a possible explanation for some of our observations might be that adaptation did not occur as readily for the random-target task as during the center-out task. However, the size and persistence of the center-out aftereffects we measured were the same whether they had been generated by exposure to the curl field during the random-target task or the center-out task. Nonetheless, perhaps some of the seemingly adaptive changes in trajectory curvature were instead due to progressively increasing cocontraction, We found no evidence of such changes. It is also important to note that the original experiments of Shadmehr and Mussa-Ivaldi (1994) demonstrating learning-related aftereffects in human subjects did so with a random-walk task much like ours. In that experiment, subjects made movements of fixed length in one of eight directions, but each movement began from the endpoint of the previous movement.
In an effort to track adaptation directly within the random-target task, we measured the average trajectory curvature for short segments of data. Even in the absence of velocity-dependent force fields, these movements are quite curved, because the monkeys trace continuous paths between sequential, randomly placed targets (e.g., Figs. 1 and 2A). However, the mean trajectory curvature changed abruptly when the force field changed and then adapted toward straighter trajectories during the 10- to 15-min exposure (which typically included 600–700 movements) to a given force field. It is likely that our monkeys failed to adapt completely within the 15 min that they were exposed to a single field. As noted above, the same was true of the Bizzi studies that included only 150–200 trials for a given field condition.
If the monkey simply re-aimed in the CCW direction when initially presented with the CW field, his hand would have been pushed smoothly off course to the correct target, resulting in a negative curvature (note that the sign of the curvature and path deviation measures are opposite to each other). Instead, we found positive curvature in the CW field (Fig. 4). This presumably means there was an initial CW deviation caused by the field that the monkey subsequently corrected, causing the equivalent of the positive curvature (negative deviation) “hooks” in Fig. 5A. The subsequent, gradual change in curvature toward zero during the CW block presumably reflects less initial error and less correction, consistent with an adapted inverse dynamic model. This gradual change during the CW field was significant in both monkeys. The curvature difference indicating the presence of aftereffects on return to the CCW field (CCW2) was significant only for one monkey. An anomalous point in one of the CCW2 sessions may have caused the comparison to fail to reach significance. In that monkey, however, we demonstrated aftereffects directly in two sessions by following the random-target curl field with the standard center-out null field condition (Fig. 5D).
Neural mechanisms of behavioral adaptation.
There are several neural mechanisms by which the adaptive response to altered limb dynamics might be brought about. Circuitry downstream from the recorded neurons might transform the kinematic signal into the muscle activity necessary to effect the movement in the face of altered limb dynamics (Georgopoulos 1986). This would appear as an unaltered kinematic tuning curve.
In contrast, if the neurons' effects on muscle activity remained fixed, their tuning curves would rotate in the direction of the applied force field, as described above. In this case, a new set of cortical neurons (e.g., those having tuning curves resembling those of the original neurons) might be recruited to effect the necessary changes in muscle activity to drive adaptation. Although this might initially be accomplished by a strategic change (e.g., by aiming at a mentally rotated target), it is likely ultimately to be accomplished by an automatic, subconscious process. These two processes have been shown psychophysically to operate independently as subjects learn a visual rotation task and can even be put in conflict with each other (Mazzoni and Krakauer 2006).
A recent experiment used the brain-machine interface (BMI) framework to study the mechanism of motor learning by rotating the preferred directions of subsets of the neurons used to control cursor movement about a common axis, evoking what the authors described as the equivalent of a “global visuomotor rotation” (Jarosiewicz et al. 2008). The authors described three types of changes expressed by the network of neurons in compensation for the imposed change in downstream dynamics. They referred to these changes as re-mapping, re-aiming, and re-weighting. These three neuronal compensations may correspond to the mechanisms described above. Re-aiming is the conscious choice of a different target that would be expected to affect all neurons equally; re-weighting and re-aiming correspond to the presumably subconscious adoption of altered discharge patterns across a subset of neurons. Under normal conditions, compensatory changes could also occur downstream, but that mechanism is not possible in the BMI context, in which output effects are fully determined by the decoder.
Gain modulation, not partial dynamic transformation, may explain partial neuron PD rotation.
Despite the qualitatively muscle-like behavior of the majority of the neurons we recorded, the distribution of neural PD changes was broader than that of muscles and its average magnitude was smaller. How do we account for these observations? In our studies there were at least six to seven shoulder muscles, some with rather complex actions, that were not monitored. It would be surprising if, with the inclusion of these additional muscles, the distribution of muscle PD changes would not have broadened. However, missing muscles are unlikely to explain the bias toward smaller neural PD rotations in our study or the large number of kinematic cells in the Bizzi studies.
This variety of neural responses may be what one would expect of an inverse dynamics model implementing a kinematic-to-kinetic transformation (Fetz 1992). There is some indication that kinematics are preferentially represented in premotor cortex, whereas movement dynamics are preferentially represented in M1 (Alexander and Crutcher 1990; Johnson et al. 1996; Kakei et al. 2003; Padoa-Schioppa et al. 2002). A more recent study that compared M1 discharge with that of spinal interneurons and muscles during isometric wrist movements found the interneuronal activity to be more like that of the muscles than was the relatively phasic discharge of M1, suggesting that further dynamic processing occurs in the spinal cord (Yanai et al. 2008).
If behavioral adaptation occurred as a result of changes to an inverse dynamics model within or downstream of M1, initially dynamic cells would have become more kinematic over time, i.e., drifted toward 0 ΔPD. Although the PDs of most neurons remained stable throughout exposure to the CW field, a significant minority drifted, either to smaller or larger ΔPD, in approximately equal numbers. However, there were no systematic changes across neurons that would account for the behavioral adaptation.
Alternatively, upstream gain modulation (Ajemian et al. 2001; Salinas and Thier 2000; Sergio and Kalaska 2003), implementing the re-aiming or re-weighting mechanisms, might account for the behavioral adaptation. Gain modulation was tested in simulation to describe the effects of forearm rotation on M1 modulation (Shah et al. 2004). The recording study on which it was based found two groups of neurons, one with tuning curves like those of muscles and another that remained fixed in space (Kakei et al. 1999). Even with neurons that projected directly to muscles, the simulation could replicate the fixed tuning curves, provided the strength of recruitment of the neurons was allowed to change between conditions.
The Shah simulation indicates that less-than-complete PD rotation remains consistent with fixed-weight effects on muscles. The unimodal ΔPD distribution and the similarity of the time course of the neural and muscle rotations that we found suggests this may be the case. However, the presence of some cells with either very large or very small PD rotations implies additional complexity in the response to the changing fields. It is intriguing that even these outlier PD rotations were entirely determined by the current applied field and were highly consistent across sessions. Ultimately, the subsequent slow adaptation of behavior appears to have been mediated entirely through the upstream gain modulation mechanism, whereas the relation between M1 discharge and muscle activity remained fixed.
M1 has no memory of prior force fields.
The simple categories of neural response to the curl fields break down for those cells with very small but reliable responses to the fields. Whether or not they should be considered kinematic is open to debate. However, it can be asserted without ambiguity that cells like AR1:36 did not have a memory-like response. A very recent study that tracked neurons across sessions using chronically implanted electrodes has further reinforced the puzzle of the memory cells missing from our study (Richardson et al. 2012). Not only did that study find memory cells, but there were progressive changes in both the null field and curl field PDs over sessions that made the change in PD become smaller. A potentially important difference from our study was the fact that their monkeys were never exposed to the curl fields until the beginning of recordings. Presumably for that reason, performance also improved over sessions, which did not occur in our study. As a further consequence, their monkeys were clearly not fully adapted at the end of either the curl field or washout blocks, although the state of adaptation increased with performance gain over sessions. However, the mechanism of PD bias through incomplete adaptation would have led to progressively greater, not lesser, PD rotation over sessions.
Noise in PD estimation given the relatively small curl field perturbations may have been a factor. Estimates of neuronal tuning curves are determined by counting action potentials within some time window. Because of the stochastic nature of the spike generation process, this count is approximately Poisson and sets a floor on the measurement error. There will be less error for cells having very deep directional tuning and for estimates based on greater numbers of spikes. Recently, these effects were quantified, using both simulated data and data taken from published studies (Stevenson et al. 2011). That analysis, applied to the memory cells shown in Figs. 3 and 4 of Gandolfo et al. (2000) suggests that the average 95% confidence bounds were likely to have been approximately ±10°, only slightly smaller than the median 11° PD change reported by Li et al. (2001). It is possible that randomly distributed errors of this magnitude could have been misinterpreted as the two classes of memory cells. This explanation is more difficult to apply to the results of Arce et al. (2010). In that study, nearly all the memory effects corresponded to the class 1 cells of the Bizzi study, rather than being equally distributed between the two complementary classes.
There is an alternate and potentially more interesting explanation. Visuomotor perturbations appear to cause distinct early and late phases of learning. Whereas activity changes in SMA correlated with the early phase, changes in M1 correlated only with the later phase (Paz et al. 2005). There is evidence that the early phase is error driven and potentially cerebellar dependent, whereas the later phase may be cortical and rely on simpler use-dependent plasticity requiring frequent repetition (Butefisch et al. 2004; Orban de Xivry et al. 2011). If the M1 mechanism is dependent on highly repetitive behavior, it could explain the lack of an adaptive component of M1 discharge in our random-target task. It is worth noting that the random-target task seems much more representative of typical motor behaviors than the highly repetitive center-out task.
Implications for future BMI work.
In addition to the importance of these results for an understanding of adaptation and dynamical transformations in M1, they may also have implications for the development of BMIs. With few exceptions (Carmena et al. 2003; Ethier et al. 2012; Fagg et al. 2009; Pohlmeyer et al. 2009), virtually all BMIs have been used to control kinematics (Hochberg et al. 2006; Kennedy and Bakay 1998; Kim et al. 2006; Koike et al. 2006; Serruya et al. 2003; Stark and Abeles 2007; Taylor et al. 2002; Wu et al. 2006; Yu et al. 2007). Even among the few studies of nonkinematic BMIs, none has tested performance across varied dynamics, beyond the transition from hand to brain control itself. As the dynamic environment changed in our experiments, the kinematic tuning of nearly all neurons changed. Significant error would result if these neurons were used to drive a kinematic BMI, the equivalent of an aftereffect resulting from an inaccurate internal model. There is evidence that BMI users can gradually adapt their motor commands and improve their performance through a process that may be very much like normal motor learning (Ganguly and Carmena 2009; Taylor et al. 2002). However, to the extent that a BMI exploits the natural dynamics of M1, this process of adaptation is likely to be faster and more automatic.
GRANTS
This work was supported in part by National Institute of Neurological Disorders and Stroke Grant NS048845, with further support from the Chicago Community Trust through the Searle Program for Neurological Restoration. H. L. Fernandes was supported by the PhD Program in Computational Biology of the Instituto Gulbenkian de Ciência, Portugal (sponsored by Fundação Calouste Gulbenkian, Siemens, and Fundação para a Ciência e Tecnologia; SFRH/BD/33525/2008).
DISCLOSURES
No conflicts of interest, financial or otherwise, are declared by the authors.
AUTHOR CONTRIBUTIONS
A.C. and L.E.M. conception and design of research; A.C. performed experiments; A.C., H.L.F., and L.E.M. analyzed data; A.C., H.L.F., and L.E.M. interpreted results of experiments; A.C., H.L.F., and L.E.M. prepared figures; A.C. drafted manuscript; A.C., H.L.F., and L.E.M. edited and revised manuscript; A.C., H.L.F., and L.E.M. approved final version of manuscript.
ACKNOWLEDGMENTS
We gratefully acknowledge the many helpful discussions with Drs. Konrad Kording, Ferdinando Mussa-Ivaldi, and Sara Solla.
REFERENCES
- Ajemian R, Bullock D, Grossberg S. A model of movement coordinates in the motor cortex: posture-dependent changes in the gain and direction of single cell tuning curves. Cereb Cortex 11: 1124–1135, 2001 [DOI] [PubMed] [Google Scholar]
- Alexander GE, Crutcher MD. Preparation for movement: neural representations of intended direction in three motor areas of the monkey. J Neurophysiol 64: 133–150, 1990 [DOI] [PubMed] [Google Scholar]
- Arce F, Novick I, Mandelblat-Cerf Y, Vaadia E. Neuronal correlates of memory formation in motor cortex after adaptation to force field. J Neurosci 30: 9189–9198, 2010 [DOI] [PMC free article] [PubMed] [Google Scholar]
- Bhushan N, Shadmehr R. Computational nature of human adaptive control during learning of reaching movements in force fields. Biol Cybern 81: 39–60, 1999 [DOI] [PubMed] [Google Scholar]
- Brashers-Krug T, Shadmehr R, Bizzi E. Consolidation in human motor memory. Nature 382: 252–255, 1996 [DOI] [PubMed] [Google Scholar]
- Buneo CA, Boline J, Soechting JF, Poppele RE. On the form of the internal model for reaching. Exp Brain Res 104: 467–479, 1995 [DOI] [PubMed] [Google Scholar]
- Butefisch CM, Khurana V, Kopylev L, Cohen LG. Enhancing encoding of a motor memory in the primary motor cortex by cortical stimulation. J Neurophysiol 91: 2110–2116, 2004 [DOI] [PubMed] [Google Scholar]
- Caithness G, Osu R, Bays P, Chase H, Klassen J, Kawato M, Wolpert DM, Flanagan JR. Failure to consolidate the consolidation theory of learning for sensorimotor adaptation tasks. J Neurosci 24: 8662–8671, 2004 [DOI] [PMC free article] [PubMed] [Google Scholar]
- Carmena JM, Lebedev MA, Crist RE, O'Doherty JE, Santucci DM, Dimitrov D, Patil PG, Henriquez CS, Nicolelis MA. Learning to control a brain-machine interface for reaching and grasping by primates. PLoS Biol 1: 193–208, 2003 [DOI] [PMC free article] [PubMed] [Google Scholar]
- Cherian A, Krucoff MO, Miller LE. Motor cortical prediction of EMG: evidence that a kinetic brain-machine interface may be robust across altered movement dynamics. J Neurophysiol 106: 564–575, 2011 [DOI] [PMC free article] [PubMed] [Google Scholar]
- Churchland MM, Shenoy KV. Temporal complexity and heterogeneity of single-neuron activity in premotor and motor cortex. J Neurophysiol 97: 4235–4257, 2007 [DOI] [PubMed] [Google Scholar]
- Davison AC, Hinkley DV. Reviews of Bootstrap Methods and Their Application. Cambridge, MA: Cambridge University Press, 1997 [Google Scholar]
- Dickey AS, Suminski A, Amit Y, Hatsopoulos NG. Single-unit stability using chronically implanted multielectrode arrays. J Neurophysiol 102: 1331–1339, 2009 [DOI] [PMC free article] [PubMed] [Google Scholar]
- Efron B, Tibshirani R. An Introduction to the Bootstrap. New York: Chapman & Hall, 1997 [Google Scholar]
- Ethier C, Oby ER, Bauman MJ, Miller LE. Restoration of grasp following paralysis through brain-controlled stimulation of muscles. Nature 485: 368–371, 2012 [DOI] [PMC free article] [PubMed] [Google Scholar]
- Fagg AH, Ojakangas GW, Miller LE, Hatsopoulos NG. Kinetic trajectory decoding using motor cortical ensembles. IEEE Trans Neural Syst Rehabil Eng 17: 487–496, 2009 [DOI] [PubMed] [Google Scholar]
- Fetz EE. Are movement parameters recognizably coded in activity of single neurons? Behav Brain Sci 15: 679–690, 1992 [Google Scholar]
- Flanagan JR, Wing AM. The role of internal models in motion planning and control: evidence from grip force adjustments during movements of hand-held loads. J Neurosci 17: 1519–1528, 1997 [DOI] [PMC free article] [PubMed] [Google Scholar]
- Flash T, Hogan N. The coordination of arm movements: an experimentally confirmed mathematical model. J Neurosci 7: 1688–1703, 1985 [DOI] [PMC free article] [PubMed] [Google Scholar]
- Gandolfo F, Li C, Benda BJ, Schioppa CP, Bizzi E. Cortical correlates of learning in monkeys adapting to a new dynamical environment. Proc Natl Acad Sci USA 97: 2259–2263, 2000 [DOI] [PMC free article] [PubMed] [Google Scholar]
- Ganguly K, Carmena JM. Emergence of a stable cortical map for neuroprosthetic control. PLoS Biol 7: e1000153, 2009 [DOI] [PMC free article] [PubMed] [Google Scholar]
- Georgopoulos AP. On reaching. Annu Rev Neurosci 9: 147–170, 1986 [DOI] [PubMed] [Google Scholar]
- Hatsopoulos N, Joshi J, O'Leary JG. Decoding continuous and discrete motor behaviors using motor and premotor cortical ensembles. J Neurophysiol 92: 1165–1174, 2004 [DOI] [PubMed] [Google Scholar]
- Hochberg LR, Serruya MD, Friehs GM, Mukand JA, Saleh M, Caplan AH, Branner A, Chen D, Penn RD, Donoghue JP. Neuronal ensemble control of prosthetic devices by a human with tetraplegia. Nature 442: 164–171, 2006 [DOI] [PubMed] [Google Scholar]
- Hollerbach JM. Computers, brains and the control of movement. Trends Neurosci 5: 189–192, 1982 [Google Scholar]
- Jarosiewicz B, Chase SM, Fraser GW, Velliste M, Kass RE, Schwartz AB. Functional network reorganization during learning in a brain-computer interface paradigm. Proc Natl Acad Sci USA 105: 19486–19491, 2008 [DOI] [PMC free article] [PubMed] [Google Scholar]
- Johnson PB, Ferraina S, Bianchi L, Caminiti R. Cortical networks for visual reaching: physiological and anatomical organization of frontal and parietal lobe arm regions. Cereb Cortex 6: 102–119, 1996 [DOI] [PubMed] [Google Scholar]
- Kakei S, Hoffman DS, Strick PL. Direction of action is represented in the ventral premotor cortex. Nat Neurosci 4: 1020–1025, 2001 [DOI] [PubMed] [Google Scholar]
- Kakei S, Hoffman DS, Strick PL. Muscle and movement representations in the primary motor cortex. Science 285: 2136–2139, 1999 [DOI] [PubMed] [Google Scholar]
- Kakei S, Hoffman DS, Strick PL. Sensorimotor transformations in cortical motor areas. Neurosci Res 46: 1–10, 2003 [DOI] [PubMed] [Google Scholar]
- Kalaska JF, Crammond DJ. Cerebral cortical mechanisms of reaching movements. Science 255: 1517–1523, 1992 [DOI] [PubMed] [Google Scholar]
- Kawato M. Internal models for motor control and trajectory planning. Curr Opin Neurobiol 9: 718–727, 1999 [DOI] [PubMed] [Google Scholar]
- Kennedy PR, Bakay RA. Restoration of neural output from a paralyzed patient by a direct brain connection. Neuroreport 9: 1707–1711, 1998 [DOI] [PubMed] [Google Scholar]
- Kim SP, Sanchez JC, Rao YN, Erdogmus D, Carmena JM, Lebedev MA, Nicolelis MA, Principe JC. A comparison of optimal MIMO linear and nonlinear models for brain-machine interfaces. J Neural Eng 3: 145–161, 2006 [DOI] [PubMed] [Google Scholar]
- Koike Y, Hirose H, Sakurai Y, Iijima T. Prediction of arm trajectory from a small number of neuron activities in the primary motor cortex. Neurosci Res 55: 146–153, 2006 [DOI] [PubMed] [Google Scholar]
- Krakauer JW, Shadmehr R. Consolidation of motor memory. Trends Neurosci 29: 58–64, 2006 [DOI] [PMC free article] [PubMed] [Google Scholar]
- Lackner JR, Dizio P. Rapid adaptation to Coriolis force perturbations of arm trajectory. J Neurophysiol 72: 299–313, 1994 [DOI] [PubMed] [Google Scholar]
- Li CSR, Padoa-Schioppa C, Bizzi E. Neuronal correlates of motor performance and motor learning in the primary motor cortex of monkeys adapting to an external force field. Neuron 30: 593–607, 2001 [DOI] [PubMed] [Google Scholar]
- Loeb GE, Brown IE, Cheng EJ. A hierarchical foundation for models of sensorimotor control. Exp Brain Res 126: 1–18, 1999 [DOI] [PubMed] [Google Scholar]
- Malfait N, Gribble PL, Ostry DJ. Generalization of motor learning based on multiple field exposures and local adaptation. J Neurophysiol 93: 3327–3338, 2005 [DOI] [PubMed] [Google Scholar]
- Mazzoni P, Krakauer JW. An implicit plan overrides an explicit strategy during visuomotor adaptation. J Neurosci 26: 3642–3645, 2006 [DOI] [PMC free article] [PubMed] [Google Scholar]
- McCullagh P, Nelder JA. Generalized Linear Models. Boca Raton, FL: CRC, 1989 [Google Scholar]
- Miall RC, Wolpert DM. Forward models for physiological motor control. Neural Netw 9: 1265–1279, 1996 [DOI] [PubMed] [Google Scholar]
- Miller LE, van Kan PLE, Sinkjaer T, Andersen T, Harris GD, Houk JC. Correlation of primate red nucleus discharge with muscle activity during free-form arm movements. J Physiol 469: 213–243, 1993 [DOI] [PMC free article] [PubMed] [Google Scholar]
- Muellbacher W, Ziemann U, Wissel J, Dang N, Kofler M, Facchini S, Boroojerdi B, Poewe W, Hallett M. Early consolidation in human primary motor cortex. Nature 415: 640–644, 2002 [DOI] [PubMed] [Google Scholar]
- Orban de Xivry JJ, Criscimagna-Hemminger SE, Shadmehr R. Contributions of the motor cortex to adaptive control of reaching depend on the perturbation schedule. Cereb Cortex 21: 1475–1484, 2011 [DOI] [PMC free article] [PubMed] [Google Scholar]
- Osu R, Hirai S, Yoshioka T, Kawato M. Random presentation enables subjects to adapt to two opposing forces on the hand. Nat Neurosci 7: 111–112, 2004 [DOI] [PubMed] [Google Scholar]
- Overduin SA, Richardson AG, Bizzi E. Cortical processing during dynamic motor adaptation. Adv Exp Med Biol 629: 423–438, 2009 [DOI] [PubMed] [Google Scholar]
- Padoa-Schioppa C, Li CS, Bizzi E. Neuronal activity in the supplementary motor area of monkeys adapting to a new dynamic environment. J Neurophysiol 91: 449–473, 2004 [DOI] [PubMed] [Google Scholar]
- Padoa-Schioppa C, Li CS, Bizzi E. Neuronal correlates of kinematics-to-dynamics transformation in the supplementary motor area. Neuron 36: 751–765, 2002 [DOI] [PubMed] [Google Scholar]
- Paz R, Natan C, Boraud T, Bergman H, Vaadia E. Emerging patterns of neuronal responses in supplementary and primary motor areas during sensorimotor adaptation. J Neurosci 25: 10941–10951, 2005 [DOI] [PMC free article] [PubMed] [Google Scholar]
- Paz R, Vaadia E. Learning from learning: what can visuomotor adaptations tell us about the neuronal representation of movement? Adv Exp Med Biol 629: 221–242, 2009 [DOI] [PubMed] [Google Scholar]
- Pohlmeyer EA, Oby ER, Perreault EJ, Solla SA, Kilgore KL, Kirsch RF, Miller LE. Toward the restoration of hand use to a paralyzed monkey: brain-controlled functional electrical stimulation of forearm muscles. PLoS One 4: e5924, 2009 [DOI] [PMC free article] [PubMed] [Google Scholar]
- Rathelot JA, Strick PL. Muscle representation in the macaque motor cortex: an anatomical perspective. Proc Natl Acad Sci USA 103: 8257–8262, 2006 [DOI] [PMC free article] [PubMed] [Google Scholar]
- Rebesco JM, Stevenson IH, Kording K, Solla SA, Miller LE. Rewiring neural interactions by micro-stimulation. Front Syst Neurosci 4: 39, 2010 [DOI] [PMC free article] [PubMed] [Google Scholar]
- Richardson AG, Borghi T, Bizzi E. Activity of the same motor cortex neurons during repeated experience with perturbed movement dynamics. J Neurophysiol 107: 3144–3154, 2012 [DOI] [PMC free article] [PubMed] [Google Scholar]
- Salinas E, Thier P. Gain modulation: a major computational principle of the central nervous system. Neuron 27: 15–21, 2000 [DOI] [PubMed] [Google Scholar]
- Scheidt RA, Conditt MA, Secco EL, Mussa-Ivaldi FA. Interaction of visual and proprioceptive feedback during adaptation of human reaching movements. J Neurophysiol 93: 3200–3213, 2005 [DOI] [PubMed] [Google Scholar]
- Schweighofer N, Arbib MA, Kawato M. Role of the cerebellum in reaching movements in humans. I. Distributed inverse dynamics control. Eur J Neurosci 10: 86–94, 1998 [DOI] [PubMed] [Google Scholar]
- Sergio LE, Kalaska JF. Systematic changes in motor cortex cell activity with arm posture during directional isometric force generation. J Neurophysiol 89: 212–228, 2003 [DOI] [PubMed] [Google Scholar]
- Serruya M, Hatsopoulos N, Fellows M, Paninski L, Donoghue J. Robustness of neuroprosthetic decoding algorithms. Biol Cybern 88: 219–228, 2003 [DOI] [PubMed] [Google Scholar]
- Shadmehr R, Mussa-Ivaldi FA. Adaptive representation of dynamics during learning of a motor task. J Neurosci 14: 3208–3224, 1994 [DOI] [PMC free article] [PubMed] [Google Scholar]
- Shadmehr R, Smith MA, Krakauer JW. Error correction, sensory prediction, and adaptation in motor control. Annu Rev Neurosci 33: 89–108, 2010 [DOI] [PubMed] [Google Scholar]
- Shah A, Fagg AH, Barto AG. Cortical involvement in the recruitment of wrist muscles. J Neurophysiol 91: 2445–2456, 2004 [DOI] [PubMed] [Google Scholar]
- Stark E, Abeles M. Predicting movement from multiunit activity. J Neurosci 27: 8387–8394, 2007 [DOI] [PMC free article] [PubMed] [Google Scholar]
- Stevenson IH, Cherian A, London BM, Sachs NA, Lindberg E, Reimer J, Slutzky MW, Hatsopoulos NG, Miller LE, Kording KP. Statistical assessment of the stability of neural movement representations. J Neurophysiol 106: 764–774, 2011 [DOI] [PMC free article] [PubMed] [Google Scholar]
- Taylor DM, Tillery SI, Schwartz AB. Direct cortical control of 3D neuroprosthetic devices. Science 296: 1829–1832, 2002 [DOI] [PubMed] [Google Scholar]
- Truccolo W, Eden UT, Fellows MR, Donoghue JP, Brown EN. A point process framework for relating neural spiking activity to spiking history, neural ensemble, and extrinsic covariate effects. J Neurophysiol 93: 1074–1089, 2005 [DOI] [PubMed] [Google Scholar]
- Wise SP, Moody SL, Blomstrom KJ, Mitz AR. Changes in motor cortical activity during visuomotor adaptation. Exp Brain Res 121: 285–299, 1998 [DOI] [PubMed] [Google Scholar]
- Wu W, Gao Y, Bienenstock E, Donoghue JP, Black MJ. Bayesian population decoding of motor cortical activity using a Kalman filter. Neural Comput 18: 80–118, 2006 [DOI] [PubMed] [Google Scholar]
- Yanai Y, Adamit N, Israel Z, Harel R, Prut Y. Coordinate transformation is first completed downstream of primary motor cortex. J Neurosci 28: 1728–1732, 2008 [DOI] [PMC free article] [PubMed] [Google Scholar]
- Yu BM, Kemere C, Santhanam G, Afshar A, Ryu SI, Meng TH, Sahani M, Shenoy KV. Mixture of trajectory models for neural decoding of goal-directed movements. J Neurophysiol 97: 3763–3780, 2007 [DOI] [PubMed] [Google Scholar]