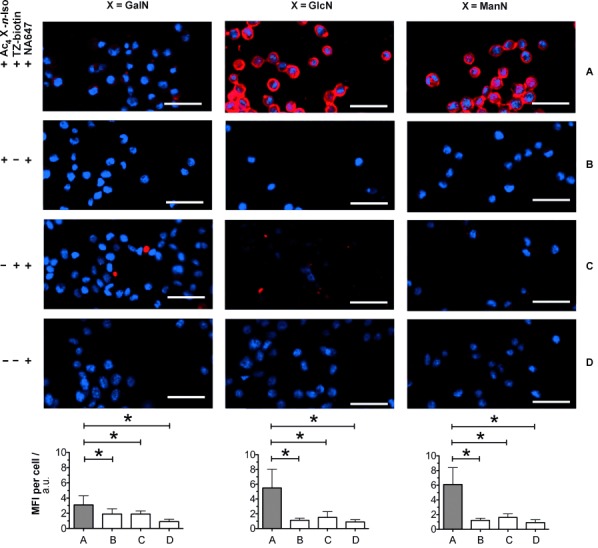
Figure 2.

Fluorescence imaging and cytometry of LL2 cells metabolically labelled with isonitrile sugars. Cells were incubated with 200 μm of each of the isonitrile sugars (Ac4Gal-n-Iso, Ac4Glc-n-Iso or Ac4Man-n-Iso) or with vehicle for 24 h at 37 °C, then with Tz–biotin (300 μm) or vehicle for 30 min at 37 °C and then with NA647 (50 μg mL−l) and DAPI nuclear stain for 15 min at RT. Red: NA647, Blue: DAPI. Scale bars: 100 μm. Images were analysed by quantitative imaging cytometry, and the MFI (bottom) was calculated for each experimental group (A to D) corresponding to the different combinations of the three reagents used. Values plotted in the charts are mean±SD (3500–5000 events counted per cell culture well). *P<0.0005, differences between groups were significant, two-tailed t-test.
