

Abstract
β-Cell mass (BCM) influences the total amount of insulin secreted, varies by individual and by the degree of insulin resistance, and is affected by physiologic and pathologic conditions. The islets of Langerhans, however, appear to have a reserve capacity of insulin secretion and, overall, assessments of insulin and blood glucose levels remain poor measures of BCM, β-cell function and progression of diabetes. Thus, novel noninvasive determinations of BCM are needed to provide a quantitative endpoint for novel therapies of diabetes, islet regeneration and transplantation. Built on previous gene expression studies, we tested the hypothesis that the targeting of vesicular monoamine transporter 2 (VMAT2), which is expressed by β cells, with [11C]dihydrotetrabenazine ([11C]DTBZ), a radioligand specific for VMAT2, and the use of positron emission tomography (PET) can provide a measure of BCM. In this report, we demonstrate decreased radioligand uptake within the pancreas of Lewis rats with streptozotocin-induced diabetes relative to their euglycemic historical controls. These studies suggest that quantitation of VMAT2 expression in β cells with the use of [11C]DTBZ and PET represents a method for noninvasive longitudinal estimates of changes in BCM that may be useful in the study and treatment of diabetes.
Keywords: Diabetes, VMAT2, [11C]DTBZ
1. Introduction
β-Cell mass (BCM) in the pancreas is a key factor in determining how much insulin can be secreted for the maintenance of normal blood glucose concentrations. At present, information regarding BCM is inferred from blood measurements of stimulated insulin production. Such measurements, however, are insensitive to certain types of β-cell dysfunction due to metabolic stress, as well as to changes in BCM that occur early in diabetic disease and affect the reserve capacity of β-cell function. Histological assessment of BCM in humans has been limited to autopsy studies [1], as the pancreas is not an ideal organ for biopsy. Noninvasive BCM measurements, based on targets other than insulin, have the potential to provide real-time information on the progression and treatment of diabetes.
Type 1 diabetes (T1D) is a result of the autoimmune destruction of the insulin-producing β cells of the islets of Langerhans—the endocrine component of the pancreas [2]. This disease has an insipid beginning and may take years before it can be recognized as clinical hyperglycemia. While it is traditionally thought that the majority of BCM is destroyed at the time of presentation with diabetes, several recent studies have suggested that there may be significant residual insulin-secretory capacity on diagnosis [3]. Moreover, there is a long preclinical period during which an immunologic assault is believed to occur on the islets of Langerhans and that hyperglycemia only develops when a critical mass of β cells is lost and insulin requirement increases.
The natural history of T1D is progression to complete elimination of insulin-secretory capacity and dependence on exogenous insulin for survival. However, it has not been possible to accurately determine the BCM that is present in individuals with diabetes and, therefore, conclusions about the natural history, as well as the effects, of new treatments on this process are based on indirect evidence. Similarly, a number of abnormalities in the insulin-producing capacity of the pancreas have been described for patients with Type 2 diabetes (T2D) [4], but there is currently no method of measuring BCM that differentiates functional versus anatomical defects in insulin secretion in this form of the disease.
A variety of experimental treatments have been developed to treat T1D, including immunotherapy, stem cell therapy and islet transplantation. The treatment of T2D has been largely empirical due to the lack of understanding of the basic mechanisms that are at work in the disease. An understanding of how BCM changes during the various phases of diabetes may provide important information on the development of new therapies for intervention strategies in both T1D and T2D.
Progress towards imaging the diseases of the endocrine pancreas has been described in several studies. Clark et al. [5] demonstrated that the body of the pancreas can be imaged with fluorine-18 4-fluorobenzyltrozamicol, a radioligand that binds to specific neuroreceptors (vesicular acetylcholine transporters) that are present on presynaptic vesicles in neurons innervating the pancreas. Similarly, taking advantage of bicarbonate and/or organic anion transporters expressed by pancreatic acinar cells, [11C]acetate has been used to visualize the exocrine pancreas [6,7]. In addition, animal studies show that 2-[18F]fluoro-2-deoxy-D-glucose may be useful in imaging recently transplanted islets [8]. Markmann et al. [9] recently reported that transplanted cadaveric islets, 14 months posttransplantation, induce peri-islet cell mass fat deposits that are visible by chemical shift gradient-echo magnetic resonance imaging (MRI). A possible problem with this approach is that peri-islet steatosis is likely to persist, at least for a few days, following islet allograft rejection, and the method is not suitable for imaging islets in situ.
Other previous attempts to image β cells and T1D-related pathology include studies by Moore et al. [10–12]. Using a β-cell-specific anti-IC2 monoclonal antibody (mAb) modified with a radioisotope chelator, normal and diabetic rodent pancreata were imaged ex vivo. Radioimmunoscintigraphy showed major differences in the pancreatic uptake of mAb between normal and diabetic rodents [10], but it was unclear if the method was suitable for in vivo imaging. Radioimmunoscintigraphy with antiganglioside mAbs has been less promising [13].
In other studies, the uptake 6-deoxy-6-[125I]iodo-D-glucose by pancreata from normal versus streptozotocin (STZ)-injected rats has been compared. Although islets and acinar tissues showed differential uptake of the radioligand and although β-cell-depleted pancreata showed decreased uptake, the clinical utility of this approach is unclear because of the broad specificity of radioligand binding and high uptake in the liver [14]. The pancreatic uptake of a tracer [2-(14)C]alloxan has been studied in normal and STZ-treated rodents. The preferential uptake of radiotracers in a normal pancreas versus a diabetic pancreas has been demonstrated. Alloxan, however, is a well-known diabetogenic agent itself; thus, the clinical utility of this approach remains unproven [15]. Dithizone and sulfonylurea receptor ligands (e.g., 3H glibenclamide) have been studied as possible imaging agents [16], but some show broad tissue distributions of uptake contraindicating feasibility [17–20].
The use of MRI has been explored in experimental insulitis. Moore et al., using superparamagnetic-particle-labeled T cells (via a CLIO-Tat peptide or major histocompatibility complex tetramer peptide complexes), were able to clearly demonstrate the presence of infiltrating T cells during the evolution of β-cell destruction [10,11]. MRI has also been used to visualize peri-islet vascular leakage due to insulitis using superparamagnetic nanobeads [21].
Despite different embryological origins, β cells of the endocrine pancreas and neurons share expression of a large number of gene products and display many functional similarities. Previous studies, at both protein and nucleic acid levels, have shown the underlying physiochemical basis for this functional similarity [22–24]. Our gene expression mapping studies have led us to focus on one such shared gene product, vesicular monoamine transporter 2 (VMAT2; also known as SLC18A2), which is expressed by β cells but is absent from the exocrine pancreas and in a variety of abdominal organs [25]. A specific ligand for VMAT2, dihydrotetrabenazine (DTBZ), is already in clinical use for the positron emission tomography (PET) imaging of central nervous system (CNS) disorders [26]. We studied the binding of [3H]DTBZ to total membrane fractions prepared from purified human islets and purified exocrine pancreas tissues. We found that [3H]DTBZ specifically bound to islet membranes but not to membranes from the exocrine pancreas. Immunohistochemistry further showed that anti-VMAT2 and insulin immunoreactivity colocalized in islet β cells [20,27–30]. In this study, we tested whether [11C]DTBZ could be used to image the endocrine pancreas in vivo and whether PET imaging with this radioligand could discriminate euglycemic rats from rats with diabetes induced by STZ.
2. Materials and methods
2.1. Chemistry
The stereochemically resolved (+)-9-O-desmethyl-α-dihydrotetrabenazine precursor of [11C]DTBZ was obtained from ABX Advanced Biochemical Compounds (Radeberg, Germany). Tritiated DTBZ was purchased from American Radiolabeled Chemicals (St. Louis, MO). α-2-[3H]DTBZ was labeled to a specific activity of 10–20 Ci/mmol. (+)-α[11C]DTBZ was synthesized by the [11C]methylation of an appropriate precursor and a product purified by high-performance liquid chromatography [31,32]. The purity of [11C]DTBZ preparations varied from 98.5% to 99.9% of the desired (+) product. Specific activities of carbon-11-labeled radiotracers were >2000 mCi/μmol at the time of injection. Biodistribution studies of [11C]DTBZ or [3H]DTBZ in Lewis rats were performed as previously described [33]. Briefly, normal rats were injected via the tail vein with 0.5 μCi/g [3H]DTBZ in saline. Groups of three animals were sacrificed at 2, 30 and 60 min postinjection. The liver, spleen, kidney, lungs, heart, blood, pancreas, thymus and adrenals were removed and weighed. Tissue radioactivity was measured near or following the dispersal of weighed tissue samples in scintillation cocktail with an automated counter, and percent injected dose per gram of tissue (% ID/g) was calculated by the comparison of samples to standard dilutions of the initial dose.
2.2. Diabetes induced by STZ
All animal studies were reviewed and approved by the Institutional Animal Care and Use Committee (IACUC) at the Columbia University Medical School (New York, NY). All experiments were performed in accordance with IACUC-approved procedures. Diabetes mellitus was induced by a single intraperitoneal injection of 50 mg/kg STZ (Sigma Aldrich, St. Louis, MO) in Lewis rats (250–350 g; Taconic, Germantown, NY) that had been fasted for 4 h to enhance the effectiveness of STZ treatment. STZ solution was prepared fresh by dissolving it in 0.1 M citrate buffer (pH 5.5) and was terminally sterile-filtered.
2.3. Blood glucose and intraperitoneal glucose tolerance tests (IPGTTs)
Blood samples were collected from the rat tail vein. The blood glucose levels of the rats were monitored daily with an Accu-Check blood glucose monitoring system (Roche Diagnostics, Sommerville, NJ). IPGTTs were performed in fasting unanesthetized animals, as previously described [34]. After baseline blood glucose measurements, animals received an intraperitoneal injection of 1 g glucose/kg body weight. Blood glucose concentrations were measured again 0, 30, 60, 90 and 120 min later. Animals were considered diabetic when four consecutive blood glucose values were above 300 mg/dl and when they displayed abnormal IPGTT responses.
2.4. Pancreatic histology
Rat pancreata were dissected and fixed in 10% buffered formalin, processed and embedded in paraffin. Five-micron sections were cut and stained routinely with hematoxylin and eosin (H&E). Ten-micron sections were also stained with guinea pig antibovine insulin or VMAT2 (Sigma-Aldrich, St. Louis, MO) antibodies and developed by standard indirect immunohistochemistry methods. Sections were viewed with an optical Leica DME Microscope (Heidelberg, Germany) adapted with a digital photographic camera.
2.5. Quantitation of VMAT2 and proinsulin transcript abundance in the pancreata of STZ-treated rodents
Lewis rats were treated with up to two daily low doses (25 mg/kg), a single high dose of STZ (50 mg/kg) or the citrate vehicle alone. On the sixth day, 6-h fasting blood glucose measurements were performed, the animals were euthanized and their pancreas were harvested. Total pancreatic RNA was isolated, and specific transcript abundance was measured by real-time quantitative reverse transcription polymerase chain reaction (PCR), as previously described [25]. The conditions used were as follows; one cycle at 95°C for 900 s, followed by 45 cycles of amplification (94°C for 15 s, 55°C for 20 s and 72°C for 20 s). Oligonucleotides were synthesized by Invitrogen. The primer sequences are as follows:
5′-TCA TGA AGT GTG ACG TTG ACA TCC GT-3′ (β-ACT-5′)
5′-CCT AGA AGC ATT TGC GGT GCA CGA TG-3′ (β-ACT-3′)
5′-GCC CTG CCC ATC TGG ATG AT-3′ (VMAT2-5′); and
5′-CTT TGC AAT AGC ACC ACC AGC AG-3′ (VMAT2-3′)
5′-CCT GTG GAT CCG CTT CCT GCC -3′ (proinsulin-5′)
5′-GTT GCA GTA GTT CTC CAG TTG G -3′ (proinsulin-3′).
The relative amount of mRNA was calculated by the comparative cycle threshold (CT) method given by Livak et al. [35] and was normalized by β-actin expression.
2.6. PET scan study protocol
Baseline PET scans were performed on five normal euglycemic adult rat subjects. Following baseline scan, diabetes was induced with STZ and was confirmed by blood glucose concentration testing. A second PET scan was performed on diabetic rats. Prior to imaging, the animals were anesthetized with intraperitoneal injections of ketamine and xylazine. After a whole-body transmission scan had been obtained (used to perform attenuation correction of emission data), the radioligand was taken up in a sterile saline vehicle and [11C]DTBZ was administered (1 μCi/g) in a bolus injection via the penile vein. PET scans of the animals were acquired dynamically 60 min postinjection on a Concorde microPET-R4 (CTI Molecular Imaging, Knoxville, TN, USA). The scanner provided a 100×80-mm field of view with a reconstructed resolution of 2.25 mm in the central 40 mm of the field of view. PET data were processed using an attenuation correction matrix obtained by transmission scans, and images were reconstructed using Fourier rebinning, followed by two-dimensional filtered backprojection.
2.7. Data analysis and interpretation
Region(s)-of-interest (ROI) analysis and image reconstruction were performed with AsiPro and microPET manager software (Concorde Microsystems, Knoxville, TN). Visual analysis was performed by individuals experienced in PET interpretation using coronal, transverse and sagittal reconstructions. Reconstructed PET images with a slice thickness of 5 mm were used to identify and measure radioligand activity within each organ of interest. ROI were manually placed across image planes for the determination of time–activity curves. The ROI in STZ-induced diabetic rats was drawn using known landmarks, any remaining [11C]DTBZ avidity in the pancreas of diabetic STZ-treated animal and the original pattern of [11C]DTBZ uptake seen in the pancreas of animals prior to treatment with STZ. Time–activity measurements in tissues of interest [pancreas, liver (right lobe), kidney (right and left cortices) and abdominal wall] were based on the sampling of equal volumes at baseline and then in diabetic animals.
The comparison of [11C]DTBZ uptake among the pancreata of all animals studied was performed by calculating the specific binding index (SBI), which relates uptake concentration in the object of interest Cp (i.e., pancreas) to a reference region Cr (e.g., kidney), as discussed by Fleming et al. [36]. Unlike standardized uptake volume, the SBI requires that nonspecific contribution be subtracted from the total uptake. In these studies, nonspecific contribution was estimated from uptake measurements in ROI placed in the abdominal wall. Total and nonspecific uptake concentrations where estimated from areas under the curve of time–activity curves during the last half of the dynamic scan period (1350–3450 s). The SBI of [11C]DTBZ uptake in the pancreas relative to the kidney was then calculated as SBI=Cp/Cr.
3. Results and discussion
Previous studies have shown that DTBZ specifically targets the VMAT2 [37–40]. Using in situ hybridization, immunohistochemistry and confocal microscopy, Weihe et al. [20], Maffei et al. [25] and Anlauf et al. [27] have shown that VMAT2 immunoreactivity colocalizes with insulin or is expressed with other β-cell markers and is absent from human islet cells stained with antiglucagon, somatostatin and pancreatic polypeptides. In the context of PET scanning with DTBZ, VMAT2 expression (as determined by immunohistochemistry in rodent tissues and by our studies using quantitative real-time PCR) is restricted to specific areas of the CNS, focal staining in the enteric nervous system, enterochromaffin cells, chromaffin cells of the adrenal medulla and β cells of the endocrine pancreas [30]. The in vivo biodistribution of DTBZ (Table 1) shows a higher uptake of DTBZ in the pancreas relative to many other abdominal organs. The neuropharmacology and neurofunctional anatomy of VMAT2 have been reviewed in detail [30,41].
Table 1.
Biodistribution of radiolabeled DTBZ in tissues
| Organs | % ID/g (total organ weight) |
|---|---|
| Brain | 0.44±0.12 |
| Eyes | 0.18±0.11 |
| Heart | 0.68±0.052 |
| Lung | 0.51±0.12 |
| Pancreas | 5.43±0.19 |
| Spleen | 0.74±0.21 |
| Kidney | 2.73±0.058 |
| Liver | 3.28±0.41 |
| Stomach | 1.38±0.043 |
| Small intestine | 1.63±0.24 |
| Cecum | 0.66±0.13 |
| Large intestine | 0.86±0.042 |
| Testes | 0.34±0.012 |
| % ID | |
|
| |
| Organs | 30 |
| Urine | 16 |
| Carcass | ~46 |
| Recovery | ~92 |
Results are shown as percent injected dose per total organ wet weight (g)±S.D., obtained at 30 min postinjection of [3H]DTBZ.
To model human T1D, we selected an STZ-treated Lewis rat model. STZ is widely used to induce experimental diabetes in rodents [42]. Previous studies have shown that STZ enters β cells via glucose transporter 2 and induces a series of intracellular changes, including formation of free radicals and liberation of nitric oxide, that result in β-cell death by necrosis [43]. Following STZ treatment, the majority Lewis rats used in these studies became stably hyperglycemic.
We next targeted VMAT2 expressed by the β cells of the endocrine pancreas with [11C]DTBZ, a radioligand suitable for PET scanning. Quantitative measurements of [11C]DTBZ uptake allowed us to estimate target abundance in the anatomical space occupied by the pancreas and to indirectly (since VMAT2 is expressed only in the β cells of the pancreas) obtain a measure of BCM. PET imaging of the abdomen of STZ-induced diabetic rats showed differences both in the pattern and in the density of DTBZ uptake in the area of the pancreas compared to baseline studies in euglycemic animals (Fig. 1, left panel; Fig. 2).
Fig. 1.
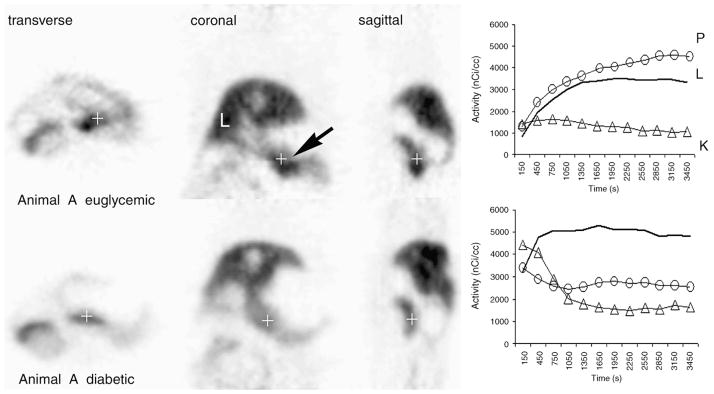
Serial PET images of transverse, coronal and sagittal abdominal planes of a Lewis rat before and after the induction of diabetes with STZ. The pancreas is identified by an arrow. Approximately 300 μCi of (+)-α-[11C]DTBZ was used for imaging. Euglycemic Lewis rats were imaged to establish baseline data and then treated with STZ. Once stable hyperglycemia had been established, diabetic rats were imaged again, at least 2 weeks after STZ treatment. Blood glucose concentrations of untreated 4-h-fasted animals imaged ranged from 90 to 125 mg/dl. The blood glucose levels of 4-h-fasted diabetic animals were usually >450 mg/dl in all diabetic animals studied. Reconstructed images represent the summed data of the entire scanning period. The quantitation of activity within the pancreas, liver and kidney ROI during the scan period is shown in time–activity curves in the right panel. The amount of [11C]DTBZ (in nCi/ml) versus the duration of the PET scan (in s) is plotted on the y and x axes, respectively. Solid lines (−) represent activity in the liver; open triangles (△) represent activity in the cortex of kidneys; open circles (○) represent activity in ROI in the pancreas (P, pancreas; K, kidneys; L, liver).
Fig. 2.
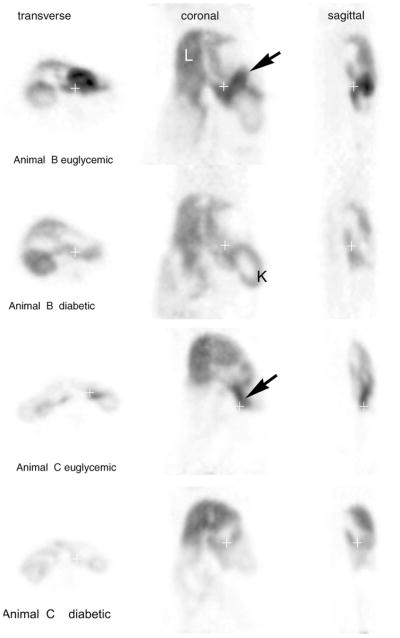
Concordant PET imaging studies with [11C]DTBZ in normal and STZ-induced diabetic rats. Pancreata are identified by arrows. The left lobes of the liver (L) and the kidney (K) are also identified. The blood glucose levels of 4-h-fasted diabetic animals (Animals B and C) were 494 and 453 mg/dl, respectively.
Quantitative measurements of radioligand uptake in ROI placed in the right lobe of the liver, in the cortex of kidneys and in the pancreas were obtained (Fig. 1, right panel). DTBZ is removed from the bloodstream by both the liver and the kidney. In the liver, [11C]DTBZ is catabolized and excreted into bile, seen radiographically as a steady accumulation of activity over the scanning period. Pancreatic DTBZ uptake usually increased monotonically from 1 min to about 40 min postinjection during the imaging period. Via the kidneys, [11C]DTBZ passes from the bloodstream, via urine, to the bladder. In healthy animals, the renal cortex does not accumulate the radioligand and provides a convenient reference organ for DTBZ uptake. In all euglycemic animals studied, the uptake of DTBZ by the pancreas was similar to, or exceeded, its accumulation in the liver. Following induction of diabetes, the uptake of DTBZ in the pancreas dropped significantly (P <.05) to levels approaching the activity measured in the renal cortex. Quantitative analysis of images reconstructed from the [11C]DTBZ PET scans suggests that the VMAT2 abundance in pancreata was reduced, but not completely ablated, in some of the diabetic animals induced with STZ treatment relative to their pretreatment levels and other control animals.
Reduced [11C]DTBZ uptake in the pancreas of STZ-induced diabetic rats is consistent with the diabetogenic action of STZ, their abnormal IPGTTs and the micro-anatomical findings obtained from a review of sections of the pancreas obtained from rodents following imaging with [11C]DTBZ. Immunohistochemistry and H&E staining of sections of the pancreata from STZ-induced diabetic rats showed reduced islet areas and frequencies compared to sections from control rodents (Fig. 3, panels A–D). The frequency of cells with anti-insulin and anti-VMAT2 immunoreactivity within islets was also reduced in the pancreata from STZ-induced diabetic rats relative to those of controls (Fig. 3, panels E–H). The loss of VMAT2 and proinsulin expression throughout STZ-treated pancreata was confirmed by parallel studies using real-time quantitative PCR measurements of specific transcript abundance (Fig. 4). While STZ-induced loss of proinsulin transcripts paralleled the loss of VMAT2 transcripts, no inference in the amounts of insulin message relative to VMAT2 message, however, could be drawn due to differences in the efficiencies of separate PCRs.
Fig. 3.
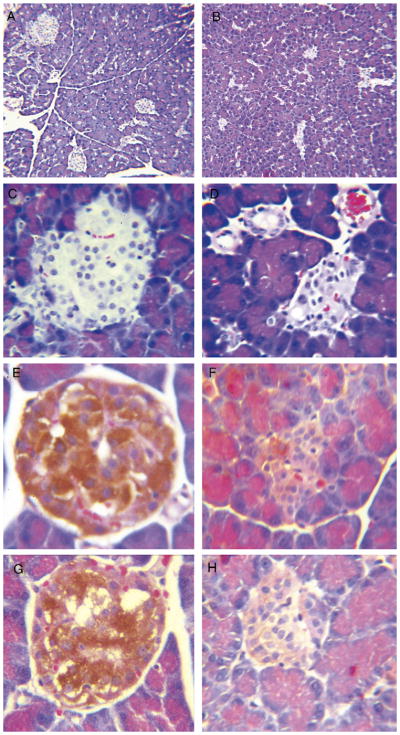
Immunohistochemistry of pancreata from euglycemic controls (left panel) and STZ-induced diabetic Lewis rats (right panel) following imaging. Paraffin-embedded sections from control and STZ-treated rat pancreata were stained by H&E (panels A–D) or processed for immunohistochemistry with anti-insulin antibodies (panels E and F) or antibodies to VMAT2 (panels G and H). Sections in the right panel originated from the body of the pancreas of diabetic rats where loss of DTBZ binding was observed. Indirect staining of slides was performed with horseradish-peroxidase-conjugated antigoat or guinea pig immunoglobulins and developed with 3c3-diaminobenzidine HCl. Panels A and B are photomicrographs at ×100 magnification; all other panels were taken at × 400 magnification.
Fig. 4.

VMAT2 and proinsulin transcript abundance in whole pancreata from control and STZ-treated Lewis rats. Total RNA from whole pancreata obtained from STZ-treated and untreated rats were prepared and probed for the expression of specific transcripts for β actin, VMAT2 and proinsulin. Transcript abundance in each sample was normalized to the amount of β-actin transcript present in the total RNA pool and then compared and normalized to the amount VMAT2 or proinsulin transcript present in untreated control rat pancreata. Median values are plotted, and error bars show the range of values obtained from three samples.
STZ, at the dose used in these studies, induces transient diabetes in 100% of the population. By 2 weeks, the majority of animals develop stable hyperglycemia (blood glucose >300 mg/dl). Occasionally, animals recover to show normal or nearly normal fasting blood glucose levels. One such animal (Animal D), along with the other study animals, is presented in Fig. 5 using the SBI of [11C]DTBZ in the pancreas, relative to the kidney and fasting blood glucose levels, as a metric of the effects of STZ-induced β-cell damage. Compared to animals that developed stable diabetes after STZ treatment, the change in SBI following STZ treatment in Animal D was modest (22% vs. 60–90% measured in Animals A–C). While the exact relationship between SBI and BCM, as determined by morphometric and histological methods, is under study in our laboratory, the 22% drop in SBI measured in an STZ-treated latently diabetic animal is consistent with previous reports of changes in β cells preceding overt hyperglycemia [44]. The observed spread of SBI values in control animals is probably caused by a variety of measurement errors (e.g., reproducible ROI placement in small animals, dose injection differences and variations in the acquisition of emission data) as well as yet poorly understood biological differences.
Fig. 5.

SBI of [11C]DTBZ in rat pancreata and fasting blood glucose levels. Specific binding indices of [11C]DTBZ in rat pancreata from a longitudinal study. Uptake measurements performed before (A, B, C and D) and after STZ treatment (A STZ, B STZ, C STZ and D STZ) versus 4-h fasting blood glucose measurements taken directly before PET imaging were fitted to a power function with the following characteristics: at infinitely high specific binding indices, the curve became asymptotic to the line y =95 mg/dl and, at infinite values of blood glucose concentration, specific binding indices approached the line x =0. The goodness of fit was estimated by linear regression.
At least three important questions are left unanswered but are underscored by our studies. First, what purpose do VMAT2 molecules serve in β cells? Clues to the role of VMAT2 in islet function can be garnered from studies showing that purified islets (with little or no contamination from surrounding nervous tissue) are rich sources of mono-amines such as epinephrine and dopamine [45], as well as from studies demonstrating the presence of biosynthetic apparatus for these neurotransmitters in β cells [46,47]. The role of these neurotransmitters as paracrine agents active in the entrainment of secretory activity in islets is still largely speculative, but it has been shown that these neurotransmitters affect islet cell function [48–51]. In the context of disease, loss of VMAT2 immunoreactivity within nerve fibers of the pancreas has been reported as an early lesion in the development of autoimmune diabetes in a rat model [28]. These observations support a hypothesis that VMAT2 may be a “neuronal” autoantigen similar to GAD65 [52].
Second, on a per-β-cell basis, does VMAT2 expression change during progression of T1D and T2D? Such data will be important in the final interpretation of quantitative data obtained from PET scans of prediabetic and diabetic individuals. The expression of VMAT2 protein in PC12 and cultured chromaffin cells can be regulated by lithium ions [53] and high extracellular concentrations of potassium ions [54] and gastrin [55], respectively. In a broader context, the density of VMAT2 expression in the CNS (as determined by PET and [11C]DTBZ) is reduced in Parkinson’s disease [56] and is increased in Tourette’s syndrome and bipolar disorders [57,58]. In ex vivo experiments, using purified human islets, we found that glucose stimulation of islets did not affect the binding of [3H]DTBZ to membrane preparations (data not shown). In in vivo experiments, we inadvertently imaged nonfasting control animals and again could not readily detect differences in [11C]DTBZ uptake in the pancreas between fasting and nonfasting animals (data not shown). Preliminary data also show that DTBZ uptake in vivo in the pancreas is not effected by tolbutamide (50 mg/kg) given 1 h earlier. As there are multiple factors responsible for the regulation of VMAT-2, the quantitative changes in [11C]DTBZ uptake in euglycemic versus diabetic animals reported here must be viewed appropriately. Furthermore, it was not possible to precisely define the entire pancreas in many diabetic animals. The future use of computerized tomography images in register with PET images may be required to accurately define the area of the pancreas and to enable more precise measurements of possible changes in BCM.
Lastly, given the sensitivity and resolution of current PET methods and the VMAT2 density in the β-cell component of the endocrine pancreas, what will be the minimum detectable loss of BCM? In autopsy studies, it has been observed that BCM varies widely among individuals [59]; thus, it is likely that the full value of this potential noninvasive method of measuring BCM will be realized in longitudinal studies. In human and animal models, a loss of >65% of the original BCM (as measured by histological techniques) results in abnormal glucose tolerance [60,61]. Via PET, we were able to detect changes in [11C]DTBZ uptake that were not associated with the development of hyperglycemia. Our current studies in a spontaneous diabetes model suggest that changes in [11C]DTBZ uptake precede the development of hyperglycemia.
4. Conclusions
We find that the use of PET and [11C]DTBZ provides a means to visualize the BCM of the endocrine pancreas and to discriminate differences in radioligand uptake among euglycemic rodents and those with chemically induced diabetes. This method may find future use in the management and diagnosis of diabetes.
Acknowledgments
This work was supported by grants from the Diabetes Endocrinology Research Center and Public Health Service of Columbia University, and the National Institute of Diabetes and Digestive and Kidney Diseases of the National Institutes of Health [5 P30 DK063608-02, 1 U42 RR016629-04 and 2 RO1 DK63567-03 (P.E.H.)].
References
- 1.Butler AE, et al. Beta-cell deficit and increased beta-cell apoptosis in humans with type 2 diabetes. Diabetes. 2003;52:102–10. doi: 10.2337/diabetes.52.1.102. [DOI] [PubMed] [Google Scholar]
- 2.Weir GC, et al. Islet mass and function in diabetes and transplantation. Diabetes. 1990;39:401–5. doi: 10.2337/diab.39.4.401. [DOI] [PubMed] [Google Scholar]
- 3.Steele C, et al. Insulin secretion in type 1 diabetes. Diabetes. 2004;53:426–33. doi: 10.2337/diabetes.53.2.426. [DOI] [PubMed] [Google Scholar]
- 4.Bernard-Kargar C, et al. Endocrine pancreas plasticity under physiological and pathological conditions. Diabetes. 2001;50(Suppl 1):S30–5. doi: 10.2337/diabetes.50.2007.s30. [DOI] [PubMed] [Google Scholar]
- 5.Clark PB, et al. Neurofunctional imaging of the pancreas utilizing the cholinergic PET radioligand [(18)F]4-fluorobenzyltrozamicol. Eur J Nucl Med Mol Imaging. 2003:258–60. doi: 10.1007/s00259-003-1350-7. [DOI] [PubMed] [Google Scholar]
- 6.Seltzer MA, et al. Radiation dose estimates in humans for (11)C-acetate whole-body PET. J Nucl Med. 2004;45:1233–6. [PubMed] [Google Scholar]
- 7.Shreve PD, et al. Imaging of the pancreas and related diseases with PET carbon-11-acetate. J Nucl Med. 1997;38:1305–10. [PubMed] [Google Scholar]
- 8.Toso C, et al. Positron-emission tomography imaging of early events after transplantation of islets of Langerhans. Transplantation. 2005;79:353–5. doi: 10.1097/01.tp.0000149501.50870.9d. [DOI] [PubMed] [Google Scholar]
- 9.Markmann JF, et al. Magnetic resonance-defined periportal steatosis following intraportal islet transplantation: a functional footprint of islet graft survival? Diabetes. 2003;52:1591–4. doi: 10.2337/diabetes.52.7.1591. [DOI] [PubMed] [Google Scholar]
- 10.Moore A, et al. Noninvasive in vivo measurement of beta-cell mass in mouse model of diabetes. Diabetes. 2001;50:2231–6. doi: 10.2337/diabetes.50.10.2231. [DOI] [PubMed] [Google Scholar]
- 11.Moore A, et al. Tracking the recruitment of diabetogenic CD8+ T-cells to the pancreas in real time. Diabetes. 2004;53:1459–66. doi: 10.2337/diabetes.53.6.1459. [DOI] [PubMed] [Google Scholar]
- 12.Moore A, et al. MRI of insulitis in autoimmune diabetes. Magn Reson Med. 2002;47:751–8. doi: 10.1002/mrm.10110. [DOI] [PubMed] [Google Scholar]
- 13.Ladriere L, et al. Pancreatic fate of a (125)I-labelled mouse monoclonal antibody directed against pancreatic B-cell surface ganglioside(s) in control and diabetic rats. Cell Biochem Funct. 2001;19:107–15. doi: 10.1002/cbf.903. [DOI] [PubMed] [Google Scholar]
- 14.Malaisse WJ, et al. Pancreatic fate of 6-deoxy-6-[125I]iodo-D-glucose: in vitro experiments. Endocrine. 2000;13:89–94. doi: 10.1385/ENDO:13:1:89. [DOI] [PubMed] [Google Scholar]
- 15.Malaisse WJ, et al. Pancreatic uptake of [2-(14)C]alloxan. Int J Mol Med. 2001;7:311–5. [PubMed] [Google Scholar]
- 16.Wangler B, et al. Synthesis and in vitro evaluation of (S)-2-([11C]methoxy)-4-[3-methyl-1-(2-piperidine-1-yl-phenyl)-butyl-carbam oyl]-benzoic acid ([11C]methoxy-repaglinide): a potential beta-cell imaging agent. Bioorg Med Chem Lett. 2004;14:5205–9. doi: 10.1016/j.bmcl.2004.07.059. [DOI] [PubMed] [Google Scholar]
- 17.Garnuszek P, et al. Identification of transplanted pancreatic islet cells by radioactive dithizone–[131I]-histamine conjugate. Preliminary report. Nucl Med Rev Cent East Eur. 2000;3:61–3. [PubMed] [Google Scholar]
- 18.Ladriere L, et al. Uptake of tritiated glibenclamide by endocrine and exocrine pancreas. Endocrine. 2000;13:133–6. doi: 10.1385/ENDO:13:1:133. [DOI] [PubMed] [Google Scholar]
- 19.Sweet IR, et al. Systematic screening of potential beta-cell imaging agents. Biochem Biophys Res Commun. 2004;314:976–83. doi: 10.1016/j.bbrc.2003.12.182. [DOI] [PubMed] [Google Scholar]
- 20.Weihe E, et al. Localization of vesicular monoamine transporter isoforms (VMAT1 and VMAT2) to endocrine cells and neurons in rat. J Mol Neurosci. 1994;5:149–64. doi: 10.1007/BF02736730. [DOI] [PubMed] [Google Scholar]
- 21.Denis MC, et al. Imaging inflammation of the pancreatic islets in type 1 diabetes. Proc Natl Acad Sci U S A. 2004;101:12634–9. doi: 10.1073/pnas.0404307101. [DOI] [PMC free article] [PubMed] [Google Scholar]
- 22.Atouf F, et al. Expression of neuronal traits in pancreatic beta cells. Implication of neuron-restrictive silencing factor/repressor element silencing transcription factor, a neuron-restrictive silencer. J Biol Chem. 1997;272:1929–34. doi: 10.1074/jbc.272.3.1929. [DOI] [PubMed] [Google Scholar]
- 23.Bernal-Mizrachi E, et al. Gene expression profiling in islet biology and diabetes research. Diabetes Metab Res Rev. 2003;19:32–42. doi: 10.1002/dmrr.331. [DOI] [PubMed] [Google Scholar]
- 24.Scharfmann R, et al. Differentiation and growth of pancreatic beta cells. Diabetes Metab. 1996;22:223–8. [PubMed] [Google Scholar]
- 25.Maffei A, et al. Identification of tissue-restricted transcripts in human islets. Endocrinology. 2004;145:4513–21. doi: 10.1210/en.2004-0691. [DOI] [PubMed] [Google Scholar]
- 26.Vander Borght TM, et al. In vivo imaging of the brain vesicular monoamine transporter. J Nucl Med. 1995;36:2252–60. [PubMed] [Google Scholar]
- 27.Anlauf M, et al. Expression of the two isoforms of the vesicular monoamine transporter (VMAT1 and VMAT2) in the endocrine pancreas and pancreatic endocrine tumors. J Histochem Cytochem. 2003;51:1027–40. doi: 10.1177/002215540305100806. [DOI] [PubMed] [Google Scholar]
- 28.Mei Q, et al. Early, selective, and marked loss of sympathetic nerves from the islets of BioBreeder diabetic rats. Diabetes. 2002;51:2997–3002. doi: 10.2337/diabetes.51.10.2997. [DOI] [PubMed] [Google Scholar]
- 29.Van Gompel J, et al. Comparison of in situ hybridization and immunocytochemistry for the detection of residual beta cells in the pancreas of streptozotocin-treated diabetic rats. Acta Diabetol. 1993;30:118–22. doi: 10.1007/BF00572853. [DOI] [PubMed] [Google Scholar]
- 30.Weihe E, et al. Chemical neuroanatomy of the vesicular amine transporters. FASEB J. 2000;14:2435–49. doi: 10.1096/fj.00-0202rev. [DOI] [PubMed] [Google Scholar]
- 31.Jewett DM, et al. A simple synthesis of [11C]dihydrotetrabenazine (DTBZ) Nucl Med Biol. 1997;24:197–9. doi: 10.1016/s0969-8051(96)00213-2. [DOI] [PubMed] [Google Scholar]
- 32.Kilbourn M, et al. Binding of alpha-dihydrotetrabenazine to the vesicular monoamine transporter is stereospecific. Eur J Pharmacol. 1995;278:249–52. doi: 10.1016/0014-2999(95)00162-e. [DOI] [PubMed] [Google Scholar]
- 33.DaSilva JN, et al. Characterization of [11C]tetrabenazine as an in vivo radioligand for the vesicular monoamine transporter. Nucl Med Biol. 1994;21:151–6. doi: 10.1016/0969-8051(94)90003-5. [DOI] [PubMed] [Google Scholar]
- 34.Weksler-Zangen S, et al. The newly inbred Cohen diabetic rat: a nonobese normolipidemic genetic model of diet-induced type 2 diabetes expressing sex differences. Diabetes. 2001;50:2521–9. doi: 10.2337/diabetes.50.11.2521. [DOI] [PubMed] [Google Scholar]
- 35.Livak KJ, et al. Analysis of relative gene expression data using real-time quantitative PCR and the 2(-Delta Delta C(T)) method. Methods. 2001;25:402–8. doi: 10.1006/meth.2001.1262. [DOI] [PubMed] [Google Scholar]
- 36.Fleming JS, et al. The specific uptake size index for quantifying radiopharmaceutical uptake. Phys Med Biol. 2004;49:N227–34. doi: 10.1088/0031-9155/49/14/n03. [DOI] [PubMed] [Google Scholar]
- 37.Scherman D. Dihydrotetrabenazine binding and monoamine uptake in mouse brain regions. J Neurochem. 1986;47:331–9. doi: 10.1111/j.1471-4159.1986.tb04506.x. [DOI] [PubMed] [Google Scholar]
- 38.Scherman D, et al. Effect of drugs on the ATP-induced and pH-gradient-driven monoamine transport by bovine chromaffin granules. Biochem Pharmacol. 1980;29:1883–90. doi: 10.1016/0006-2952(80)90098-2. [DOI] [PubMed] [Google Scholar]
- 39.Scherman D, et al. The catecholamine carrier of bovine chromaffin granules. Form of the bound amine Mol Pharmacol. 1983;23:431–6. [PubMed] [Google Scholar]
- 40.Scherman D, et al. Characterization of the monoamine carrier of chromaffin granule membrane by binding of [2–3H]dihydrotetrabenazine. Proc Natl Acad Sci U S A. 1983;80:584–8. doi: 10.1073/pnas.80.2.584. [DOI] [PMC free article] [PubMed] [Google Scholar]
- 41.Henry JP, et al. The vesicular monoamine transporter: from chromaffin granule to brain. Neurochem Int. 1998;32:227–46. doi: 10.1016/s0197-0186(97)00092-2. [DOI] [PubMed] [Google Scholar]
- 42.Wilson GL, et al. Streptozotocin interactions with pancreatic beta cells and the induction of insulin-dependent diabetes. Curr Top Microbiol Immunol. 1990;156:27–54. doi: 10.1007/978-3-642-75239-1_3. [DOI] [PubMed] [Google Scholar]
- 43.Szkudelski T. The mechanism of alloxan and streptozotocin action in B cells of the rat pancreas. Physiol Res. 2001;50:537–46. [PubMed] [Google Scholar]
- 44.Rossi GL, et al. Morphometric studies of pancreatic islets and retinal vessels of rats with streptozotocin-induced latent diabetes. Diabete Metab. 1981;7:77–86. [PubMed] [Google Scholar]
- 45.Lundquist I, et al. Monoamines in pancreatic islets of guinea pig, hamster, rat, and mouse determined by high performance liquid chromatography. Pancreas. 1989;4:662–7. doi: 10.1097/00006676-198912000-00002. [DOI] [PubMed] [Google Scholar]
- 46.Borelli MI, et al. Presence of DOPA decarboxylase and its localisation in adult rat pancreatic islet cells. Diabetes Metab. 1997;23:161–3. [PubMed] [Google Scholar]
- 47.Iturriza FC, et al. Immunohistochemical investigation of tyrosine-hydroxylase in the islets of Langerhans of adult mice, rats and guinea pigs. Neuroendocrinology. 1993;57:476–80. doi: 10.1159/000126394. [DOI] [PubMed] [Google Scholar]
- 48.Ishihara H, et al. Islet beta-cell secretion determines glucagon release from neighbouring alpha-cells. Nat Cell Biol. 2003;5:330–5. doi: 10.1038/ncb951. [DOI] [PubMed] [Google Scholar]
- 49.Satin LS, et al. Neurotransmitters and their receptors in the islets of Langerhans of the pancreas: what messages do acetylcholine, glutamate, and GABA transmit? Endocrine. 1998;8:213–23. doi: 10.1385/ENDO:8:3:213. [DOI] [PubMed] [Google Scholar]
- 50.Sharp GW, et al. Studies on the mechanism of insulin release. Fed Proc. 1975;34:1537–48. [PubMed] [Google Scholar]
- 51.Ste Marie L, et al. Norepinephrine and epinephrine-deficient mice are hyperinsulinemic and have lower blood glucose. Endocrinology. 2003;144:4427–32. doi: 10.1210/en.2003-0561. [DOI] [PubMed] [Google Scholar]
- 52.Pearce DA, et al. Glutamic acid decarboxylase autoimmunity in Batten disease and other disorders. Neurology. 2004;63:2001–5. doi: 10.1212/01.wnl.0000145836.72059.3b. [DOI] [PubMed] [Google Scholar]
- 53.Cordeiro ML, et al. Lithium ions modulate the expression of VMAT2 in rat brain. Brain Res. 2002;953:189–94. doi: 10.1016/s0006-8993(02)03284-5. [DOI] [PubMed] [Google Scholar]
- 54.Desnos C, et al. Long term stimulation changes the vesicular monoamine transporter content of chromaffin granules. J Biol Chem. 1995;270:16030–8. doi: 10.1074/jbc.270.27.16030. [DOI] [PubMed] [Google Scholar]
- 55.Hocker M. Molecular mechanisms of gastrin-dependent gene regulation. Ann N Y Acad Sci. 2004;1014:97–109. doi: 10.1196/annals.1294.010. [DOI] [PubMed] [Google Scholar]
- 56.Frey KA, et al. Presynaptic monoaminergic vesicles in Parkinson’s disease and normal aging. Ann Neurol. 1996;40:873–84. doi: 10.1002/ana.410400609. [DOI] [PubMed] [Google Scholar]
- 57.Albin RL, et al. Increased ventral striatal monoaminergic innervation in Tourette syndrome. Neurology. 2003;61:310–5. doi: 10.1212/01.wnl.0000076181.39162.fc. [DOI] [PubMed] [Google Scholar]
- 58.Zubieta JK, et al. High vesicular monoamine transporter binding in asymptomatic bipolar I disorder: sex differences and cognitive correlates. Am J Psychiatry. 2000;157:1619–28. doi: 10.1176/appi.ajp.157.10.1619. [DOI] [PubMed] [Google Scholar]
- 59.Ritzel RA, et al. Relationship between beta-cell mass and fasting blood glucose concentration in humans. Diabetes Care. 2006;29:717–8. doi: 10.2337/diacare.29.03.06.dc05-1538. [DOI] [PubMed] [Google Scholar]
- 60.Gepts W. Pathologic anatomy of the pancreas in juvenile diabetes mellitus. Diabetes. 1965;14:619–33. doi: 10.2337/diab.14.10.619. [DOI] [PubMed] [Google Scholar]
- 61.McCulloch DK, et al. Correlations of in vivo beta-cell function tests with beta-cell mass and pancreatic insulin content in streptozotocin-administered baboons. Diabetes. 1991;40:673–9. doi: 10.2337/diab.40.6.673. [DOI] [PubMed] [Google Scholar]