Abstract
The expression of CD5 increases progressively as thymocytes mature. We have shown that CD5 expression is controlled by a tissue-specific regulatory promoter located upstream of the CD5 translation start sites. Deletion of this regulatory promoter, which contains three potential transcription factor binding sites (CCAAT, κE2, and ets) reduces the promoter activity to basal level. Of these sites, only ets proved essential for CD5 expression in T cell lines. Here, we introduce a role for the E47 transcription factor and the CD5 promoter κE2 site in regulating CD5 expression during thymocyte development. Using T cell lines, we show that (i) mutation of the κE2 site in the CD5 regulatory promoter results in a significant elevation of CD5 promoter activity; (ii) the E47 transcription factor binds to the κE2 site; and (iii) overexpression of E47 inhibits CD5 expression. We then show, in high-dimensional fluorescence-activated cell sorting studies with primary thymocytes at successive developmental stages, that (i) intracellular E47 levels decrease as surface CD5 expression increases; (ii) E47 expression is down-regulated and CD5 expression is correspondingly up-regulated in DN3 thymocytes in RAG-2-deficient mice injected with anti-CD3 to mimic pre-T cell receptor stimulation; and (iii) E47 expression is down-regulated and CD5 expression is up-regulated when double positive thymocytes are stimulated in vitro with anti-CD3. Based on these data, we propose that E47 negatively regulates CD5 expression by interacting with the κE2 site in the CD5 regulatory promoter and that decreases in E47 in response to developmental signals are critical to the progressive increase in CD5 expression as thymocytes mature.
CD5 (Ly-1) encodes a 67-kDa transmembrane glycoprotein and is expressed at a characteristic level on developmentally and functionally distinct lymphocyte populations both in human and mouse. CD5 is expressed at relatively high levels on all T lineage cells, at low levels on B-1a cells, and is below detectable levels on B-2 cells (1-3). Importantly for studies presented here, CD5 is expressed on thymocytes and increases progressively as thymocytes mature from the double negative (DN) to the double positive (DP) stage and beyond (4).
In the thymus, CD5 expression has been shown to be up-regulated in response to pre-T cell receptor (TCR) engagement during β selection at the DN stage. It is further up-regulated in response to TCR engagement during positive/negative selection at the DP stage. These changes in surface CD5 expression reflect the functional roles demonstrated for CD5, which participates in the fine tuning of the TCR repertoire by negatively regulating TCR signaling during thymocyte development and similarly participates in regulating TCR in mature lymphocytes (5-8). Thus, the regulatory mechanisms that control CD5 expression are key to lymphocyte development and function.
In studies comparing surface CD5 expression levels with CD5 mRNA levels, we have shown that surface CD5 correlates very closely with CD5 mRNA across a 30-fold range in lymphocyte subsets (9), suggesting that surface CD5 levels are largely regulated at the transcriptional level. We and others (3, 10, 11) then cloned the mouse CD5 promoter and showed that this 3-kb promoter contains all of the elements necessary to control cell type-specific CD5 expression. Next, in studies with the EL4 T cell line, we identified the CD5 regulatory promoter as a 215-bp segment within the 3-kb promoter region and showed that deletion of a 43-bp segment within this regulatory promoter reduces the promoter activity to basal level. This 43-bp region contains three potential transcription factor binding sites: CCAAT, κE2, and ets. All are conserved between human and mouse. Finally, we showed by mutagenesis analysis that the ets site in the CD5 regulatory promoter is essential for promoter activity in EL4 and that Ets-1, an Ets transcription factor family member, activates CD5 transcription by binding to this site (3).
These mutagenesis studies failed to reveal a role for the κE2 (GGCAGGTGG) site, an E box motif located next to ets. However, studies presented here surprisingly reveal a key role for this site in regulating CD5 expression during thymocyte development.
The sequence of the κE2 site in the CD5 regulatory promoter is identical to the sequence of κE2 in the Ig-κ light chain enhancer, which has been shown to be the optimal binding site for the E47/E12 proteins. These proteins are alternate splice products of the E2A gene, which belongs to the class I basic helix-loop-helix transcriptional factor family, and have been shown to be essential regulators for both B and T lymphocyte development (12-14).
Here, we demonstrate that the binding of E47 to the κE2 site in the CD5 regulatory promoter negatively regulates CD5 expression. In addition, in fluorescence-activated cell sorting (FACS) studies with primary thymocytes, we show that intracellular E47 levels are negatively correlated with surface CD5 expression at successive stages of thymocyte development and that anti-CD3 stimulation of thymocytes arrested at the DN3 stage in RAG-2 deficient mice, or anti-CD3 stimulation of DP thymocytes in normal mice, concomitantly down-regulates E47 expression and up-regulates CD5. Thus, we propose that E47 negatively regulates CD5 expression by interacting with the κE2 site in the CD5 regulatory promoter in developing thymocytes, and that relief of this inhibitory binding in response to developmental signals is critical to induce CD5 expression as thymocytes progress toward maturity.
Materials and Methods
Mouse Strains. BALB/c, C57BL/6, and FVB mice were obtained from The Jackson Laboratory, and RAG2-deficient (C57BL/6 RAG2-/-) mice were obtained from the Weissman laboratory at Stanford. All mice were bred and maintained at Stanford.
Cell Lines and Plasmids. Murine EL4 and 6780 cells were grown in RPMI medium 1640 as described (3). The CD5 regulatory promoters, WT or mutagenized at the κE2 or ets site, were cloned into pGL3 luciferase reporter plasmid. pRL-TK was obtained from Promega. E47 expression construct (pHBAPneo-E47) was a gift from Cornelis Murre (University of California, San Diego).
Generation of CD5 Promoter-Luciferase Transgenic (Tg) Mice. A DNA construct containing the firefly luciferase gene (plus a marginally active GFP gene) driven by the 3-kb CD5 promoter segment was microinjected into fertilized FVB pronuclei, which were then implanted into pseudopregnant mice by the Stanford Transgenic Facility. Tg founder lines were identified by bioluminescence imaging (BLI) by using an IVIS imaging system and living image software (Xenogen, Alameda, CA) (15, 16).
Transfection, Luciferase Reporter Assay, and Luciferase Bioluminescence Imaging. Reporter constructs were transfected into EL4 and 6780 cells in Lipofectamine 2000 (Invitrogen). To control for transfection efficiency, 0.1 μg of pRL-TK construct was cotransfected in each sample, and firefly luciferase activity was normalized to Renilla luciferase activity from pRL-TK. In cotransfections with E47 expression plasmid, a promoterless plasmid was added to keep total transfected DNA constant. Transfected cells were cultured for 40 h, and luciferase activity was determined by bulk luciferase assay (Dual-Luciferase Reporter Assay System, Promega) or in live-cell assays by using BLI as described (15, 16).
Electrophesis Mobility-Shift Assay (EMSA). Preparation of cell extracts and EMSAs were performed as described (3). The sequences of oligonucleotides used in EMSA were: κE2, 5′-TCGAGGGGCAGGTGGTTTCAGCT-3′; μE5, 5′-TCGA-AGAACACCTGCAGCAGCT-3′; κE2(M), 5′-TCGAGG-GGCTTTTTGTTTCAGCT-3′; and ets, 5′-ACAGGGAGGAAGTTGACAG-3′. In antibody-supershift assays, extracts were preincubated with 1 μg anti-E47 (G127-32) mAb or anti-c-Myc (9E10) mAb (Pharmingen).
Chromatin Immunoprecipitation (ChIP) Assay. The ChIP assay was performed as described (17). The sequences of PCR primer pairs spanning the κE2 site in the CD5 regulatory promoter are: κE2 sense, 5′-CATCCCACAAGACACCTGGTTCTGCCCAGC-3′; and κE2 antisense, 5′-GGGGAAGCAGGCAGTGTGGGCCTGTGTCAC-3′.
High-Dimensional (Hi-D) (11-Color) FACS Analysis and Cell Sorting. Single-cell suspensions from adult thymus and spleen were stained with cocktails of fluorochrome-conjugated antibodies [CD3ε (2C11), TCRβ (H57), CD8a (53-6.7), CD4 (GK1.5), CD5 (53-7), CD25 (7D4), CD44 (IM7), and E47 (G127-32)], prepared at Stanford University or obtained from Pharmingen. Surface and intercellular staining were performed as described (see General Surface-Staining Protocol and Intracellular Cytokine FACS-Staining Protocol, which are published as supporting information on the PNAS web site). “Fluorescence-minus-one” controls were included to determine the level of nonspecific staining and autofluorescence associated with subsets of cells in each fluorescence channel. For surface staining, propidium iodide was added to all samples before data collection to identify dead cells. For intercellular staining, ethidium monoazide was used before the fixation step to exclude cells dead at this point. Hi-D FACS data were collected on a modified triple-laser FACS instrument. flowjo (TreeStar, San Carlos, CA) software was used for fluorescence compensation and analysis. Hi-D FACS was also used to sort cells, which were reanalyzed immediately after sorting; purities were >99%.
In Vivo Anti-CD3 mAb Treatment. Eight- to 10-week-old RAG2-/- mice, three per group, were injected i.p. with 0, 0.5, 2.5, and 10 μg anti-CD3ε mAb (145-2C11)/g of body weight per group. Single-cell suspensions were prepared from thymus and analyzed by Hi-D FACS on day 3.
In Vitro Anti-CD3 mAb Treatment. Four million sorted DP CD5loTCRlo CD5-luc Tg thymocytes were plated in 2 ml of RPMI in wells coated with increasing doses of anti-CD3 mAb and incubated for 18 h at 37°C. Luciferase activity in the well was then measured by BLI, the substrate was washed away, and the cells were harvested for Hi-D FACS analysis.
Results
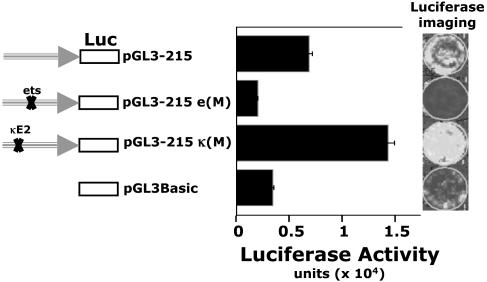
CD5 Expression Is Inhibited by Means of a Functional κE2 Site in CD5 Regulatory Promoter. In transfection studies with a CD5-luc, a CD5 promoter-luciferase reporter construct, we have shown that the ets motif in the CD5 regulatory promoter is essential for CD5 expression in the EL4 T cell line (3). Mutating this motif similarly abrogates CD5 expression in an immature thymocyte DP (CD4+CD8+) cell line (18, 19) (6780 cells, Fig. 1). In contrast, mutating κE2, an E-box motif 10 bp upstream of the ets site, elevates CD5 promoter activity in this cell line (Fig. 1).
Fig. 1.
Mutation of the κE2 element on the CD5 regulatory promoter increases CD5 promoter activity in an early thymocyte (DN/DP) T cell line. The 215-bp CD5 promoter in a WT configuration (pGL3-215), mutated at the κE2 site [pGL3-215 κ(m)], or mutated at the ets site [pGL3-215 e(m)], was cloned into a promoterless pGL3 basic luciferase (firefly) reporter vector. An early thymic T cell line (6780) arrested at the DN/DP transition (17, 18) was transiently transfected with each of the reporter constructs. A cotransfected Renilla luciferase reporter construct (pTK-RL) is used as an internal control for normalization. Luciferase imaging (Right) and computed intensities (Left) are shown.
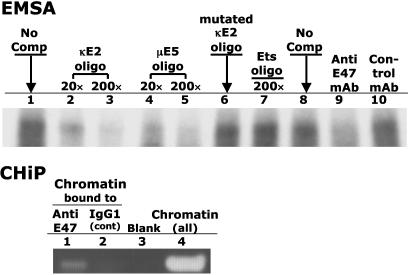
CD5 Expression Is Inhibited by E47 Binding to the CD5 Promoter κE2 Site. The κE2 (GGCAGGTGG) motif was originally identified in the Ig-κ light chain enhancer and was shown to be the preferred binding site for E47 protein (20). We have found an identical κE2 site in the CD5 regulatory promoter. EMSA and ChIP show that E47 also binds to this site (Fig. 2). This binding is specific because (i) incubating anti-E47 mAb with cell extract before adding the DNA probe eliminates complex formation; and (ii) addition of excess unlabeled κE2 or μE5 (another E47 binding site) oligonucleotides (20) inhibit binding in a dose-dependent manner, whereas addition of mutated κE2 oligonucleotides does not (Fig. 2).
Fig. 2.
E47 protein binds to the κE2 site on the CD5 regulatory promoter. (Upper) EMSA. Aliquots (10 μg protein) of cell extract from 6780 cells were incubated with labeled 32P-labeled κE2 oligo in the absence of competitor (lanes 1 and 8) or in the presence of unlabeled competitor. Lanes 2 and 3 contain 20-fold and 200-fold molar-excess unlabeled κE2 oligo, respectively; lanes 4 and 5 contain 20-fold and 200-fold molar-excess unlabeled μE5 oligo; lane 6 contains 200-fold molar-excess unlabeled, mutated κE2 oligo; lane 7 contains 200-fold molar-excess unlabeled ets oligo; and lanes 9 and 10 contain 1 μg of anti-E47 mAb and control Ab, respectively. (Lower) ChIP assay. The 6780 chromatin was precipitated with anti-E47 mAb (lane 1) or IgG1 isotype control Ab (lane 2) and analyzed by PCR using primers spanning the κE2 site in the CD5 promoter. Lane 4 contains PCR products from unprecipitated chromatin. Lane 3 contains PCR “products” obtained in the absence of chromatin.
In the ChIP assay, we immunoprecipitated 6780 cells to chromatin with anti-E47 mAb and did PCR analysis with the immunoprecipitated chromatin by using primers spanning the CD5 κE2 site. The PCR product was the expected size when we immunoprecipitated with anti-E47 but not with an isotype control antibody (Fig. 2). Therefore, the κE2 site in CD5 regulatory promoter is occupied by E47 protein in 6780 cells.
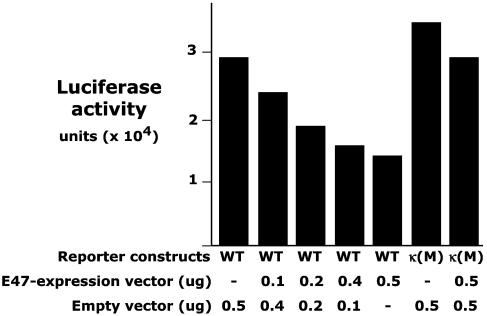
Similar studies with EL4 indicate that EL4, which expresses high level of CD5, has very little E47 (data not shown). Cotransfecting EL4 with CD5-luc and increasing amounts of an E47-expression construct decreases CD5 regulatory promoter activity in a dose-dependent manner (Fig. 3). However, this E47 expression construct is ineffective when cotransfected with a CD5-luc construct in which the κE2 site in the CD5 regulatory promoter is mutated (Fig. 3). Taken together, these findings demonstrate that E47 interacts with the κE2 site in the CD5 regulatory promoter to inhibit CD5 expression in T cell lines.
Fig. 3.
Ectopic expression of E47 protein decreases CD5 promoter activity. EL4 cells were transiently cotransfected with increasing amounts of E47-expression vector and either the WT or κE2-mutated (κM) CD5 regulatory promoter reporter construct. Luciferase reporter activity was measured by imaging.
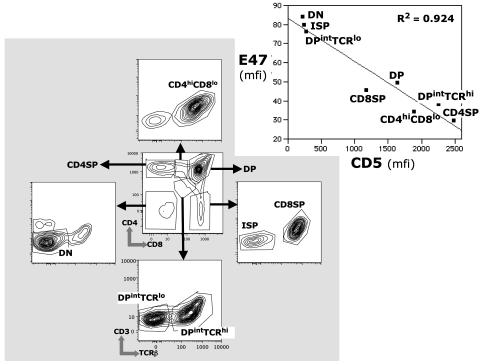
During Thymocyte Development in Intact Animals Intracellular E47 Decreases as Surface CD5 Expression Increases. CD5 expression increases progressively as developing thymocytes mature through DN to DP to single positive stages (4). E47, which regulates several aspects of the intrathymic T cell development program, decreases progressively as the thymocytes pass through these stages (13, 14). Consistent with these findings, Hi-D flow cytometry (Hi-D FACS) measurements of surface CD5 and intracellular E47 for cells in the developmental subsets show that the decrease in intracellular E47 expression as differentiation proceeds is accompanied by a corresponding increase in surface CD5 expression (Fig. 4).
Fig. 4.
Inverse relationship between surface CD5 and intracellular E47 in primary thymocyte and T cell subsets. Expression levels for CD5 and E47 were measured by Hi-D FACS in the indicated subsets. (Inset) Black squares indicate median E47 and CD5 fluorescence intensities (mfi) for each subset. The bottom plot shows the axes for the plots that are not identified.
The up-regulation of surface CD5 as thymocytes pass through the DP developmental stage is commonly used as an indicator of TCR engagement during positive selection (4, 21, 22). TCRβ and CD3 expression on DP cells resolves two DP subsets at successive stages of differentiation: one containing cells that are ready to be selected by TCR engagement; and, a second containing cells that have received TCR-mediated signal (DPintTCRlo and DPintTCRhi, respectively, Fig. 4). CD5 increases and, as predicted, E47 decreases as cells pass through these TCR-mediated checkpoints (Fig. 4 Inset).
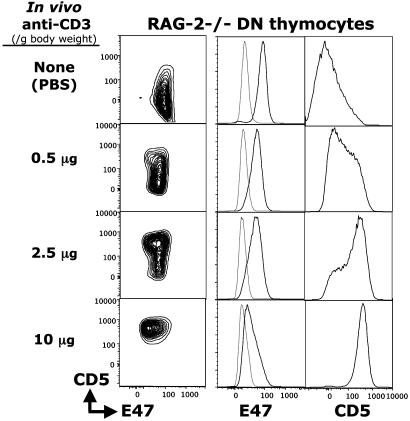
CD5 expression has also been shown to be up-regulated at early DN stages of thymocyte development in response to pre-TCR signaling (4). In Rag2-/- mice, where development is arrested at the CD25+CD44- DN3 stage because of the failure of rearrangement at the TCRβ gene locus, injecting anti-CD3 mAb to mimic the pre-TCR signaling at this stage overcomes this block and allows DN3 thymocytes to differentiate to the CD25-CD44- DN4 stage and then further to the DP stage (23, 24). Our in vivo anti-CD3 stimulation studies with RAG-2-/- mice show that CD5 is up-regulated in a dose-dependent manner (in DN3 and DN4, data not shown) and that CD5 is up-regulated and intracellular E47 is down-regulated in the RAG-2-/- DN thymocytes (Fig. 5).
Fig. 5.
Anti-CD3 treatment up-regulates CD5 and down-regulates E47 in a dose-dependent manner during differentiation. Rag2-/- mice were injected with increasing doses of anti-CD3 mAb. Three days later, thymocytes were prepared, and FACS analysis was performed. E47 and CD5 expression are shown for DN cells (CD4-, CD8-, TCR-).
Anti-CD3 Stimulates CD5 Promoter Activity in TCRloDP Thymocytes Sorted from CD5 Promoter-Reporting Tg Animals. TCR-mediated selection at the DP stage is the last critical checkpoint before development of single positives during thymocyte development. In normal mice (not RAG-2-/-), the TCRlo DP cells develop and differentiate to TCRhi DP in response to TCR-mediated signals as the TCR repertoire is selected for appropriate avidities. This transition is marked by a further increase in CD5 expression (4) and, as we show here, a further decrease in intracellular E47.
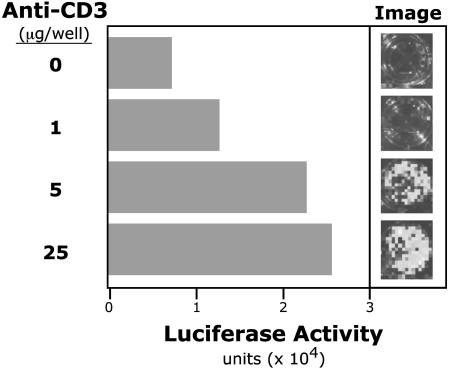
We recently generated a Tg mouse line (CD5-luc Tg) that expresses luciferase reporter gene under control of the 3-kb CD5 promoter region. Preliminary in vivo measurements of luciferase activity by using BLI (15) studies indicate that luciferase reporter expression in these mice resembles endogenous tissue and cell type-specific CD5 expression (data not shown). Whole body imaging with BLI enables sensitive detection of expression patterns in living animals (15, 16). In vitro anti-CD3 stimulation of sorted TCRloDP thymocytes from these mice activates the CD5 promoter in a dose-dependent manner (Fig. 6) and correspondingly increases surface CD5 expression (Table 1). In addition, this stimulation decreases intracellular E47 (Table 1). Thus, the increases in CD5 throughout thymocyte development expression reflect the progressive decrease in E47 that occurs in response to TCR-initiated and other signaling events.
Fig. 6.
Anti-CD3 treatment in vitro up-regulates CD5 promoter activity in FACS-sorted early DP thymocytes. Thymocytes from FVB CD5-luc Tg mice [expressing a luciferase reporter under the control of the full-length (3-kB) CD5 promoter] were harvested. Sorted DP (CD4+CD8+TCRloCD5lo) cells were treated in vitro for 18 h with anti-CD3. CD5 promoter activity is reported as luciferase activity detected by imaging.
Table 1. In vitro stimulation with anti-CD3 down-regulates E47 and up-regulates CD5 in sorted TCRlo DP thymocytes.
| Anti-CD3, μg | CD5, mfi | E47, mfi |
|---|---|---|
| 0 | 150 | 30 |
| 1 | 1,000 | 18 |
| 5 | 1,200 | 17 |
| 25 | 1,400 | 17 |
Sorted cells from CD5-luc Tg mice were cultured for 18 h in vitro with anti-CD3 as indicated and analyzed by Hi-D FACS. mfi, median fluorescence intensity.
Discussion
We have shown here that E47 binding to the κE2 site in the CD5 regulatory promoter inhibits the activity of the CD5 promoter in cell lines and that E47 decreases progressively as CD5 expression increases during thymocyte development. In addition, we have shown that the increase in CD5 expression that occurs when DP thymocytes are stimulated with anti-CD3 is regulated at the transcription level and is accompanied by a decrease in intracellular E47. Together, these findings strongly support the idea that signals that drive thymocyte development up-regulate surface CD5 expression by down-regulating intracellular E47, and that this is the major mechanism regulating CD5 expression on thymocytes.
In previous studies, we have interpreted the positive correlation between surface CD5 and Ets-1 expression levels in thymocytes and peripheral T cell subsets as an indication that Ets-1 plays a major role in controlling CD5 expression in T cells (3). Here, we argue that E47 negatively regulates CD5 expression. These two arguments are reconcilable on a quantitative basis, i.e., when E47 is high in immature thymocytes, Ets-1 tends to be low (25). The reverse is true in peripheral T cells. Thus, we suggest that E47 regulation predominates in immature thymocytes, whereas Ets-1 regulation predominates in peripheral T cells.
An NFAT (nuclear factor of activated T cells) binding site >2kb upstream of the CD5 transcription start has also been implicated in the up-regulation of CD5 expression, in this case in B-2 cells stimulated by anti-IgM to crosslink surface B cell receptor (26). To our knowledge, this site (which is distant from the regulatory promoter studied here) has not been shown to contribute to the regulation of CD5 expression in thymocytes or T cells.
Current functional studies cast CD5 as a key accessory molecule that negatively modulates TCR signaling in thymocytes. The progressive increase in CD5 expression as thymocyte differentiation progresses is seen as raising the antigen-dependent activation threshold of maturing T cells and thereby helping to fine-tune the TCR repertoire (5, 7). Thus, mechanisms defined here, which regulate CD5 expression in thymocytes, are likely to play a key role in determining the repertoire that is ultimately expressed in mature lymphocytes.
Supplementary Material
Acknowledgments
We thank Ometa Herman and Sue Sheppard for technical assistance and John Mantovani for editorial help. This work was supported in part by National Institutes of Health Grants HL06855, R33-CA88303 (to C.H.C. and Leonard A. Herzenberg), R24-CA92862 (to C.H.C. and Leonard A. Herzenberg), and R01-CA85610 (to D.F.); the Leukemia and Lymphoma Society; and the Damon Runyon Foundation.
Abbreviations: DN, double negative; DP, double positive; TCR, T cell receptor; FACS, fluorescence-activated cell sorting; EMSA, electrophesis mobility-shift assay; ChIP, chromatin immunoprecipitation; Hi-D, high-dimensional; BLI, bioluminescence imaging; Tg, transgenic.
References
- 1.Ledbetter, J. A., Evans, R. L., Lipinski, M., Cunningham-Rundles, C., Good, R. A. & Herzenberg, L. A. (1981) J. Exp. Med. 153, 310-323. [DOI] [PMC free article] [PubMed] [Google Scholar]
- 2.Herzenberg, L. A., Stall, A. M., Lalor, P. A., Sidman, C., Moore, W. A. & Parks, D. R. (1986) Immunol. Rev. 93, 81-102. [DOI] [PubMed] [Google Scholar]
- 3.Tung, J. W., Kunnavatana, S. S. & Herzenberg, L. A. (2001) BMC Mol. Biol. 2, 5. Available at www.biomedcentral.com. Accessed May 22, 2001. [DOI] [PMC free article] [PubMed]
- 4.Azzam, H. S., Grinberg, A., Lui, K., Shen, H., Shores, E. W. & Love, P. E. (1998) J. Exp. Med. 188, 2301-2311. [DOI] [PMC free article] [PubMed] [Google Scholar]
- 5.Tarakhovsky, A., Kanner, S. B., Hombach, J., Ledbetter, J. A., Muller, W., Killeen, N. & Rajewsky, K. (1995) Science 269, 535-537. [DOI] [PubMed] [Google Scholar]
- 6.Pena-Rossi, C., Zuckerman, L. A., Strong, J., Kwan, J., Ferris, W., Chan, S., Tarakhovsky, A., Beyers, A. D. & Killeen, N. (1999) J. Immunol. 163, 6494-6501. [PubMed] [Google Scholar]
- 7.Azzam, H. S., DeJarnette, J. B., Huang, K., Emmons, R., Park, C. S., Sommers, C. L., El-Khoury, D., Shores, E. W. & Love, P. E. (2001) J. Immunol. 166, 5464-5472. [DOI] [PubMed] [Google Scholar]
- 8.Bhandoola, A., Bosselut, R., Yu, Q., Cowan, M. L., Feigenbaum, L., Love, P. E. & Singer, A. (2002) Eur. J. Immunol. 32, 1811-1817. [DOI] [PubMed] [Google Scholar]
- 9.Tung, J. W. (1997) Ph.D. thesis (Stanford University, Stanford, CA).
- 10.Huang, H. J., Jones, N. H., Strominger, J. L. & Herzenberg, L. A. (1987) Proc. Natl. Acad. Sci. USA 84, 204-208. [DOI] [PMC free article] [PubMed] [Google Scholar]
- 11.Weichert, T. R. & Schwartz, R. C. (1995) J. Immunol. 154, 4603-4612. [PubMed] [Google Scholar]
- 12.Bain, G., Quong, M. W., Soloff, R. S., Hedrick, S. M. & Murre, C. (1999) J. Exp. Med. 190, 1605-1616. [DOI] [PMC free article] [PubMed] [Google Scholar]
- 13.Bain, G. & Murre, C. (1998) Semin. Immunol. 10, 143-153. [DOI] [PubMed] [Google Scholar]
- 14.Quong, M. W., Romanow, W. J. & Murre, C. (2002) Annu. Rev. Immunol. 20, 301-322. [DOI] [PubMed] [Google Scholar]
- 15.Zhang, W., Feng, J. Q., Harris, S. E., Contag, P. R., Stevenson, D. K. & Contag, C. H. (2001) Transgenic Res. 10, 423-434. [DOI] [PubMed] [Google Scholar]
- 16.Contag, C. H. & Bachmann, M. H. (2002) Annu. Rev. Biomed. Eng. 4, 235-260. [DOI] [PubMed] [Google Scholar]
- 17.Boyd, K. E., Wells, J., Gutman, J., Bartley, S. M. & Farnham, P. J. (1998) Proc. Natl. Acad. Sci. USA 95, 13887-13892. [DOI] [PMC free article] [PubMed] [Google Scholar]
- 18.Karlsson, A., Giuriato, S., Tang, F., Fung-Weier, J., Levan, G. & Felsher, D. W. (2003) Blood 101, 2797-2803. [DOI] [PubMed] [Google Scholar]
- 19.Felsher, D. W. & Bishop, J. M. (1999) Mol. Cell 4, 199-207. [DOI] [PubMed] [Google Scholar]
- 20.Murre, C., McCaw, P. S., Vaessin, H., Caudy, M., Jan, L. Y., Jan, Y. N., Cabrera, C. V., Buskin, J. N., Hauschka, S. D., Lassar, A. B., et al. (1989) Cell 58, 537-544. [DOI] [PubMed] [Google Scholar]
- 21.Kikuchi, K., Kawasaki, Y., Ishii, N., Sasaki, Y., Asao, H., Takeshita, T., Miyoshi, I., Kasai, N. & Sugamura, K. (2001) Int. Immunol. 13, 777-783. [DOI] [PubMed] [Google Scholar]
- 22.Sosinowski, T., Killeen, N. & Weiss, A. (2001) Immunity 15, 457-466. [DOI] [PubMed] [Google Scholar]
- 23.Shinkai, Y. & Alt, F. W. (1994) Int. Immunol. 6, 995-1001. [DOI] [PubMed] [Google Scholar]
- 24.Levelt, C. N., Mombaerts, P., Iglesias, A., Tonegawa, S. & Eichmann, K. (1993) Proc. Natl. Acad. Sci. USA 90, 11401-11405. [DOI] [PMC free article] [PubMed] [Google Scholar]
- 25.Bhat, N. K., Komschlies, K. L., Fujiwara, S., Fisher, R. J., Mathieson, B. J., Gregorio, T. A., Young, H. A., Kasik, J. W., Ozato, K. & Papas, T. S. (1989) J. Immunol. 142, 672-678. [PubMed] [Google Scholar]
- 26.Berland, R. & Wortis, H. H. (1998) J. Immunol. 161, 277-285. [PubMed] [Google Scholar]
Associated Data
This section collects any data citations, data availability statements, or supplementary materials included in this article.


