

Background: The collectin CL-L1 is a pattern recognition molecule of the innate immune system.
Results: Several biological parameters are established and furnish a basis for continued investigations.
Conclusion: CL-L1 has specificity similar to other collectins, is present as large oligomers in blood from birth, and is associated with MASPs.
Significance: A number of novel data supporting a biological role for CL-L1 are presented.
Keywords: Collectins, Complement System, Inflammation, Innate Immunity, Lectin
Abstract
Collectins are pattern recognition molecules of the innate immune system showing binding to carbohydrate structures on microorganisms in a calcium-dependent manner. Recently, three novel collectins, collectin liver 1 (CL-L1), collectin kidney 1 (CL-K1 and CL-11), and collectin placenta 1 (CL-P1), were discovered. The roles of these three collectins remain largely unknown. Here, we present a time-resolved immunofluorometric assay for quantification of CL-L1. The concentration of CL-L1 in donor plasma (n = 210) was distributed log-normally with a median value of 3.0 μg/ml (range 1.5–5.5 μg/ml). We observed on average 30% higher concentrations of CL-L1 in plasma as compared with serum. Size analysis by gel-permeation chromatography showed CL-L1 in serum to elute as large 700–800-kDa complexes and smaller 200–300-kDa complexes. CL-L1 showed specific binding to mannose-TSK beads in a Ca2+-dependent manner. This binding could be inhibited by mannose and glucose, but not galactose, indicating that CL-L1 binds via its carbohydrate-recognition domain and has ligand specificity similar to that of mannan-binding lectin. Western blot analysis of CL-L1 showed the presence of several oligomeric forms in serum. Ontogeny studies showed CL-L1 to be present at birth at near adult levels. CL-L1 levels exhibit low variation in healthy adults over a 1-year period. During acute-phase responses, the CL-L1 levels display only minor variations. In serum, CL-L1 was found in complexes with mannan-binding lectin-associated serine proteases, suggesting a role in the lectin pathway of complement activation. The presented data establish a basis for future studies on the biological role of CL-L1.
Introduction
Innate immune molecules are involved in the recognition, confinement, and clearance of invading microorganisms. Both soluble and membrane-bound pattern-recognition molecules (PRMs)2 are involved in the recognition of non-self structures, i.e. pathogen-associated molecular patterns on microorganisms as well as determinants presented by altered self. Collectins include a distinct group of C-type lectin PRMs. Collectins are composed of several subunits each consisting of three identical polypeptides with an N-terminal cross-linking region (CLR) followed by a collagen-like region, an α-helical coiled-coil neck region, and a C-terminal carbohydrate recognition domain (CRD). C-type lectins bind, in a calcium-dependent manner, to targets presenting ligands with adequately spaced terminal carbohydrate groups (1). Although the first collectin identified, conglutinin, was reported 100 years ago (2), the study of collectins only took broader interest with the identification in 1978 of mannan-binding lectin (MBL) (3), followed by surfactant protein A (4) and surfactant protein D (5). Three further collectins were more recently discovered by Wakamiya and co-workers, i.e. collectin liver 1 (CL-L1, also termed collectin 10) (6), collectin placenta 1 (CL-P1, also termed collectin 12) (7), and collectin kidney 1 (CL-K1, also termed collectin 11 or CL-11) (8). CL-P1 is a membrane protein resembling scavenger receptors (9). CL-K1 is a soluble protein found in serum at a median concentration of 284 ng/ml (9, 10). It was shown that CL-K1 associates with MASPs and might therefore be an activator of the lectin pathway (11). The same study also showed that CL-K1 was able to bind to some microorganisms as well as to apoptotic cells. It was later confirmed that recombinant CL-K1 and recombinant MASP-2 were able to form stable complexes in vitro and activate the lectin pathway upon binding to Candida albicans (12).
CL-L1 was discovered through the screening of expressed sequence tag databases, revealing a cDNA fragment with C-terminal sequence homology with collectins (6). The gene encoding CL-L1, now designated COLEC10, is located on chromosome 8 (q23-24.1) and spans 39,784 bp. The primary transcript includes six exons and a total of 1706 nucleotides. The first exon encodes the leader peptide, the N-terminal CLR, and the start of the collagen-like region. The next three exons encode the remaining collagen-like region, and the fifth and sixth exons encode the neck region and the CRD, respectively. The mRNA encodes an ORF of 277 amino acids, including a predicted leader peptide of 27 amino acids, resulting in a mature polypeptide chain of 250 amino acid residues comprising a CLR of 19 amino acids, a collagenous region of 72 amino acids, a neck region of 37 amino acids, and a CRD of 122 amino acids.
Only one paper has presented original data on characteristics of CL-L1 (6). CL-L1 was described as a cytoplasmic protein, and an initial description of a lectin activity of recombinant CRDs of CL-L1 was presented (6).
Extending the studies of CL-L1 in cytoplasm, we have analyzed for the presence of the protein in serum and plasma. In this study, we present an assay for the measurement of CL-L1, and we use this assay to establish the levels of the protein in serum, size, and composition of the complexes, ontogeny, and acute phase reaction, and we analyze the lectin activity of CL-L1.
EXPERIMENTAL PROCEDURES
Blood Samples
Serum and plasma samples were obtained from Danish blood donors after informed consent according to the Declaration of Helsinki. Fresh blood samples were also collected from some individuals and kept at room temperature (RT), 4 °C, and 37 °C for varying time periods. To further evaluate the stability of CL-L1, fresh serum and plasma samples were exposed to repeated freezing and thawing cycles (n = 10). Ontogeny samples (0–12 months) were obtained from the umbilical cord of 12 infants and subsequently after 6, 9, and 12 months (13). Samples collected from patients undergoing colorectal surgery were obtained just prior to operation and sequentially up to 5 days after surgery, with a 35-day follow-up (14).
Expression of Recombinant CL-L1 in HEK293F Cells
A cDNA clone (DNA Technology A/S, Denmark) encoding the full-length cDNA of human CL-L1 was introduced into the pCMV6XL4 transcription vector (OriGene, Technologies, Rockville, MD). The vector was transformed into One Shot® TOP10 Chemically Competent Escherichia coli (C4040-10, Invitrogen) according to the manufacturer's protocol. The DNA plasmid was purified with HiSpeed plasmid Maxi-Kit (12663, Qiagen) according to the manufacturer's protocol. FreestyleTM HEK293F cells (R79007, Invitrogen) were used for transient expression of recombinant CL-L1. The cell line has been adapted to grow in suspension in a serum-free medium (Freestyle Expression Medium, Invitrogen). The pCMV6XL4 CL-L1 expression construct was introduced into the cells using LipofectamineTM 2000 (Invitrogen) according to the manufacturer's protocol. After growth of the cells for 72 h, the culture supernatants were harvested after centrifugation at 10,000 rpm for 10 min and stored at 4 °C in the presence of 15 mm sodium azide.
Sample Preparation for Liquid Chromatography-Selected Reaction Monitoring-Mass Spectrometry (LC-SRM-MS)
A total of 100 μl of recombinant CL-L1 culture supernatant was lyophilized and re-dissolved in 40 μl of 0.2 m Tris-HCl, pH 8.3, containing 8 m urea, reduced, and alkylated by adding 1.2 μl of 0.5 m dithiothreitol (DTT, to 15 mm) followed by the addition of 2.6 μl of 0.5 m iodoacetamide (to 30 mm). Both reactions were allowed to continue for 1 h. The protein concentration of the sample was estimated by SDS-PAGE (data not shown) to be about 0.5 μg/μl. The sample was subsequently diluted 5-fold with 0.1 m Tris-HCl, pH 8.3, and digested using 1:50 w/w (i.e. ∼1 μg) sequencing grade modified trypsin (Sigma, T6567-1MG) at 37 °C for 16 h in a final volume of 225–229 μl. A total of 360 fmol of three stable isotope-labeled standard peptides (see below) were added to 24 μl of trypsin-digested sample, before desalting on C18 StageTips (Thermo Scientific, Hvidovre, Denmark). The sample was lyophilized and dissolved in 36 μl of 0.1% formic acid, and 5 μl was analyzed by LC-SRM-MS. This corresponds to loading 50 fmol of the stable isotope-labeled standard peptides on the column. All samples were handled in Protein LoBind Tubes (Eppendorf) to reduce protein loss.
Mass Spectrometry
LC-SRM-MS analyses were performed on an EASY-nLC II system (Thermo Scientific) connected to a Qtrap 5500 mass spectrometer (AB Sciex) equipped with a NanoSpray III source (AB Sciex) and operated under Analyst 1.6.1 control. The samples were injected, trapped, and desalted isocratically on a ReproSil-Pur C18-AQ column (5-μm beads, 2 cm × 100 μm inner diameter; Thermo Scientific) after which the peptides were eluted from the trap column and separated on a ReproSil-Pur C18-AQ capillary column (3-μm beads, 16 cm × 75 μm inner diameter) packed in-house in acetonitrile, connected directly to the mass spectrometer. The peptides were eluted using a 12-min gradient from 5 to 35% buffer B (0.1% formic acid and 90% acetonitrile) at 250 nl/min, followed by re-equilibration for 10 min back to the starting conditions. The Qtrap was in positive ion mode with 2500 V ion spray voltage, curtain gas setting of 30, ion source gas setting of 5, and an interface heater temperature of 150 °C. The eluted peptides were measured with a selected reaction monitoring assay using a 20-ms dwell time for all transitions (24 in total) and a target scan time of 0.6 s. The resolution in Q1 and Q3 was set to unit (0.7 atomic mass units full width of half-maximum).
Quantification of Recombinant CL-L1
The recombinant CL-L1 amount in the culture supernatant was determined by selected reaction monitoring mass spectrometry. The assay was developed using Skyline 1.4.0.4421 (15) based on the analysis of recombinant CL-L1. Briefly, an MS discovery analysis of the digested culture CL-L1 containing supernatant was performed, and four peptides were selected. The peptides and their associated fragment ions were processed in Skyline. After data acquisition on the QTrap 5500, the three peptides with the highest intensities were selected as follows: GLLGIPGEK, DEAANTLIADYVAK, and VFIGVNDLER. Finally, collision energy optimization was performed on fragment ions using seven steps of 1 V on each side of the calculated collision energy values, and the four most intense transitions were kept for each of the three peptides (supplemental Fig. 1). The three stable isotope-labeled standard peptides, SpikeTides_TQL, were produced for us by JPT Peptide Technologies GmbH, Germany.
Polyclonal Antibodies (pAb)
Two different pAb to CL-L1 were produced by contract by GenScript Inc. The general production protocol can be viewed on line. In brief, 5 mg of either synthetic peptides representing the 14 N-terminal (LDIDSRPTAEVCAT) or a 14-amino acid long stretch in the CRD (NEGEPSDPYGHEDC) was conjugated with keyhole limpet hemocyanin. The conjugates were emulsified in complete Freund's adjuvants and used as immunogen on two separate rabbits. The rabbits received a boost with the conjugate emulsified with incomplete Freund's adjuvant 14, 35, and 56 days after the primary immunization. Each dose contained 500 μg of conjugate. The sera were tested by ELISA for reactivity against the respective peptide coated onto microtiter wells. The anti-peptide antibodies were affinity-purified on peptide-derivatized high affinity iodoacetyl resin as described by the supplier, GenScript, and lyophilized. Twenty to 30 mg were supplied.
Monoclonal Antibodies (mAb)
Monoclonal antibodies were produced by GenScript. The general protocol for production can be viewed on line. In brief, BALB/c mice were immunized subcutaneously with 100 μg per animal of either of the above described two peptide-keyhole limpet hemocyanin conjugates emulsified first in Freund's complete adjuvants, followed by two injections with incomplete Freund's adjuvants and a final i.v. boost, each with 50 μg per animal. Four mice received the synthetic peptide representing 14 N-terminal amino acids, and six mice received the synthetic peptide representing CRD. Sera from all mice were tested for reactivity against the respective peptide coated directly onto microtiter wells. Mice exhibiting high titers were selected. Spleen cells from these mice were fused with myeloma cells (SP2/0), and selection was carried out on wells coated with the peptide used for immunization. After expansion, cloning, etc., the antibodies were purified by affinity chromatography on protein G beads and lyophilized.
Analysis by Western Blotting
The reactivities of the mAbs and the pAb were tested by Western blotting. Recombinant CL-L1 supernatant (0.5 ml) was mixed with 125 μl of SDS-PAGE sample buffer (30 mm Tris-HCl, 10% (v/v) glycerol, 8 m urea, 3% (w/v) SDS, 0.1% (w/v) bromphenol blue, pH 8.9) and separated by electrophoresis on XT-Criterion pre-cast 4–12% gradient BisTris polyacrylamide gel (Bio-Rad). DTT was added to disrupt disulfide bonds followed by iodoacetamide, and the samples were applied to a 10-cm broad trough. Separated proteins were blotted onto a nitrocellulose membrane (Hybond ECN, GE Healthcare) in transfer buffer (25 mm Tris, 0.192 m glycine, 20% v/v ethanol, 0.1% w/v SDS, pH 8.3) for 500 V-h. The membrane was blocked for 30 min in TBS, 0.1% Tw (10 mm Tris-HCl, 140 mm NaCl, 15 mm sodium azide, pH 7.4 (TBS), with 0.1% v/v Tween 20) and washed three times in TBS, 0.05% Tw (TBS/Tw) before it was cut into 3-mm wide strips. The strips were incubated in wells of Octatray (Octa 110, Pateof, Odense, Denmark) overnight on a rocking table with either 1 μg of pAb 187-7 and 187-110 or mAb 4F4 (from the antibody production described above) per ml of primary buffer (TBS/Tw, 1 mm EDTA, 1 mg of human serum albumin (HSA, Statens Serum Institut, Copenhagen, Denmark), and 100 μg of normal human IgG (hIgG, Beriglobin, CSL Bering, Marburg, Germany) per ml. As control for antibody, specificity strips were also incubated with normal rabbit (Dako, Glostrup, Denmark) or normal mouse IgG (Lampire® Biological Laboratories) in primary buffer. After washing three times in TBS/Tw, the strips were incubated with horseradish peroxidase-labeled rabbit anti-mouse antibody (Dako) or goat anti-rabbit antibody (Dako) diluted 4000-fold in secondary buffer (TBS/Tw without sodium azide, 1 mm EDTA, 100 μg of hIgG per ml) for 2 h on a rocking table followed by washing three times in TBS/Tw and developing with SuperSignal West Pico chemiluminescent substrate (Thermo Scientific). Images were analyzed with a CCD camera (Fuji, Vedbaek, Denmark, LAS-4000). Background reactivity from the secondary HRP-conjugated antibody was evaluated with the buffer control strips.
Biotinylation of Antibodies
Antibodies were biotinylated with 166 μg of biotinyl-N-hydroxysuccinimide (Sigma) per mg of antibody according to the method described by the supplier followed by dialysis against TBS.
Analytical Affinity Purification of CL-L1
FluoroNunc MaxiSorp (Thermo Scientific, 437958) microtiter wells were each coated with 0.5 μg of 187-10 anti-CL-L1 or with 0.5 μg of normal rabbit IgG (Dako) in 100 μl of PBS, overnight at room temperature (RT). Wells were blocked by incubation with TBS/Tw for 1 h, and subsequently washed with TBS/Tw. Twelve anti-CL-L1 wells and 12 control wells each received 100 μl of EDTA plasma diluted with an equal volume of “binding buffer” (TBS/Tw with 10 mm EDTA, 100 μg of heat-aggregated hIgG, and 10 μg of normal rabbit IgG (Dako) per ml). The heat-aggregated hIgG was prepared by incubation of hIgG (Beriglobin) at 1 mg/ml PBS at 60 °C for 30 min followed by centrifugation at 3000 × g for 10 min to remove large aggregates. Similarly, 12 antibody and 12 control IgG-coated wells received recombinant CL-L1 supernatant diluted with an equal volume of binding buffer. After incubation overnight, the microtiter wells were washed with TBS/Tw, and bound protein was eluted successively from 12 wells with 120 μl of SDS-PAGE sample buffer. The four eluates were subjected to SDS-PAGE followed by Western blotting (as above) using 1 μg of mAb anti-CL-L1 antibody 4F4 per ml in primary buffer.
Time-resolved Immunofluorometric Assay
The concentration of CL-L1 in serum was determined by TRIFMA involving capture with pAb 187-10 anti-CL-L1 and detection of bound CL-L1 with biotinylated pAb 187-7 anti-CL-L1, followed by incubation with Eu3+-labeled streptavidin (1244-360 PerkinElmer Life Sciences). FluoroNunc MaxiSorp microtiter plates were incubated with 0.5 μg of 187-10 in 100 μl of PBS overnight. Residual binding sites were blocked with 1 mg of HSA per ml of TBS, and the wells were washed with TBS/Tw, and samples diluted in sample buffer were added. The sample buffer was identical to the binding buffer described above. Heat-aggregated hIgG was included to prevent false-positive signals due to rheumatic factor, and normal rabbit IgG was added to prevent cross-linking between coating and developing antibodies by human anti-rabbit antibodies in the serum samples (16). A standard curve was constructed from a dilution of a standard plasma pool. This was initially diluted 10-fold followed by serial 2-fold dilutions. Test samples were diluted 40-fold. After incubation overnight at 4 °C, the wells were washed with TBS/Tw and incubated with 100 ng of biotin-conjugated 187-7 anti-CL-L1 antibody in 100 μl of TBS/Tw, 10 mm EDTA for 2 h at RT. After washing with TBS/Tw, the wells were incubated with 10 ng of Eu3+-labeled streptavidin in 100 μl of TBS/Tw, 25 μm EDTA for 1 h at RT. Following washing, the bound europium was quantified by adding 200 μl of enhancement solution (PerkinElmer Life Sciences) per well, and the fluorescence was read on a fluorometer (Victor3, PerkinElmer Life Sciences). Data were assessed using the WorkOut 2 software (PerkinElmer Life Sciences). In addition to the dilutions of plasma for the construction of a standard curve, three internal control plasma and a buffer control were also included. All samples were added in duplicate.
Specificity of Ligand Binding
Serum (500 μl) diluted with an equal volume TBS/Tw, 5 mm CaCl2 was incubated in the presence of increasing concentrations of potential inhibitors (0–100 mm) overnight on rotation at 4 °C with 100 μl of mannose-coupled TSK HW 75 beads. The TSK beads were activated with divinyl sulfone (17) and coupled to mannose as described previously (18). After centrifugation (100 × g for 5 min), the supernatants were collected; the beads were washed with TBS/Tw, 5 mm CaCl2, and bound CL-L1 was eluted with 250 μl of TBS/Tw, 5 mm CaCl2 containing 100 mm d-mannose. CL-L1 and MBL were subsequently measured in the eluates collected after centrifugation as above.
Calcium Dependence for Ligand Binding
Serum (500 μl) diluted with an equal volume of TBS/Tw + 5 mm CaCl or + 10 mm EDTA was incubated overnight on rotation at 4 °C with 100 μl of mannose-coupled TSK beads. d-Mannose (100 mm) was added to some samples to inhibit binding. The samples were centrifuged (100 × g, 5 min), and the supernatants were discharged. The beads were washed twice in TBS/Tw, 5 mm CaCl2, and bound material was eluted with 250 μl of TBS/Tw, 5 mm CaCl2 containing 100 mm d-mannose for 10 min on rotation at RT. The samples were centrifuged (100 × g, 5 min), and CL-L1 content of the supernatants was measured by TRIFMA. Samples incubated with unconjugated TSK beads were used as a negative control.
Gel-permeation Chromatography
Normal human serum and recombinant CL-L1 culture supernatants were subjected to gel-permeation chromatography on a Superose 6 HR 10/300 column (GE Healthcare). The column buffer was TBS, 5 mm CaCl2, or TBS, 10 mm EDTA. The column was run at a flow rate of 1 ml/min, and 250-μl fractions were collected in Tween 20-treated 96-well FluoroNunc MaxiSorp microtiter plates. Fractions were assayed for CL-L1 by the above described sandwich TRIFMA. The elution volume of IgM, MBL, H- and L-ficolin, purified IgG, and HSA on this column has previously been established (19).
CL-L1 Association with MASPs
Possible complexes between CL-L1 and MASPs in serum were analyzed by coating FluoroNunc microtiter wells with capture antibody for one component and then develop with biotinylated antibody against the other component. FluoroNunc microtiter plates were coated with 500 ng of pAb 187-10 anti-CL-L1 antibody or 200 ng mAb 5F5 in 100 μl of PBS. mAb 5F5 is directed against the CCP-1 domain common for MASP-1, MASP-3, and MAp44 (20) and shall be termed simply “anti-CCP-1 antibody.” As negative control, wells were coated with 500 ng of normal rabbit IgG (Dako) or 200 ng of normal mouse IgG (Lampire). After blocking in TBS/HSA and washing with TBS/Tw were added dilutions of serum in either TBS/Tw, 10 mm EDTA, or TBS/Tw, 10 mm EDTA with 1 m NaCl. In addition, the buffer contained 10 μg of normal mouse IgG (Lampire), 10 μg of normal rat IgG (Lampire), and 10 μg of cow IgG (Lampire) per ml (16). The plates were incubated overnight at 4 °C, washed with TBS/Tw, and incubated with either 100 ng of biotinylated pAb anti-CL-L1 187-7 or 100 ng of biotinylated mAb anti-CCP1 antibody per 100 μl of TBS/Tw, 10 mm EDTA for 2 h at RT. After washing with TBS/Tw, the wells were developed with europium-labeled streptavidin as described above.
Stability of CL-L1
Fresh EDTA plasma and serum from the same individual were left at RT, 4 °C, and 37 °C, and aliquots (200 μl) were taken at 1 and 5 h and 2, 5, 14, 41, and 54 days and stored at −80 °C until CL-L1 content was measured. Also, fresh EDTA plasma and serum samples collected from the same individual were subjected to repeated cycles (n = 10) of freezing (−80 °C) and thawing followed by measurement of CL-L1 levels. Sodium azide to 15 mm was added to all samples to prevent bacterial growth.
Variation of CL-L1 Levels during a 1-Year Period
EDTA plasma samples were obtained over a 1-year period from 10 apparently healthy individuals. The samples were collected on each day during the 1st week followed by weekly collections and finally monthly collections. The samples were stored at −80 °C, and CL-L1 levels were subsequently measured.
Ontogeny
CL-L1 levels were measured in serum samples obtained from a cohort of umbilical cord and infant blood (6, 9, and 12 months after birth) (12). Samples were kept at −80 °C.
Acute-phase Response
CL-L1 levels were measured in blood samples obtained from a previously described cohort of colorectal cancer patients undergoing surgery (13). Blood samples were collected from six patients prior to surgery and sequentially thereafter. CRP levels were determined previously (13).
Statistics
CL-L1 concentrations were given by the median and range. Normality of the distribution of the log-transformed values of CL-L1 levels was evaluated using the Kolmogorov-Smirnov normality test. Spearman nonparametric correlation was used to analyze the values obtained from measuring the 70 corresponding EDTA plasma and serum samples. All calculations were done using GraphPad Prism 5 (GraphPad software, La Jolla, CA.).
RESULTS
Anti-CL-L1 Antibodies
The specificity of pAb and mAb was examined by separating recombinant CL-L1 culture supernatants by SDS-PAGE under reducing and nonreducing conditions with subsequent analysis by Western blotting. Both mAbs and pAb were raised against two different synthetic peptides representing the N-terminal CLR and CRD of CL-L1 (Fig. 1A). We initially analyzed the reactivity of 12 antibodies, 5 of which were directed against the N terminus and 7 against the CRD. Of the mAb, only those raised against the CRD showed reactivity with CL-L1 (data not shown). On the Western blot illustrating the results obtained by staining of reduced recombinant CL-L1, all antibodies showed reaction with material migrating corresponding to ∼37 kDa (Fig. 1B). When the recombinant CL-L1 was subjected to SDS-PAGE without a reducing agent, blotting the same antibodies stained two bands corresponding to 70 and 75 kDa. When comparing the intensity of the staining of reduced and nonreduced CL-L1, it appeared that the antibodies reacted stronger with reduced rCL-L1, possibly because the immunogens were synthetic peptides.
FIGURE 1.

Analysis of antibodies against CL-L1. A, COLEC10 gene encoding CL-L1 is located on chromosome 8, q23-24.1 and spans 39,784 bp. The primary transcript is composed of six exons and a total of 1708 nucleotides. Gray areas indicate 5′ and 3′UTRs. Translation results in an immature protein of 277 amino acids, including a predicted (Signal-3L) signal peptide (amino acids 1–27), a mature protein of 250 amino acids, and a predicted molecular mass of 27.5 kDa. Predicted O- and N-linked glycosylation sites are indicated (predicted with online tools NetOGlyc and NetNGlyc). The overview of the COLEC10 gene and the primary transcript is based on comparison between the cDNA (NM_006438.3) and the sequence of the COLEC10 gene (NC_000008.10). Polyclonal anti-CL-L1 187-7 antibody (pAb) was raised against the 14 N-terminal amino acids, although both mAb 4F4- and pAb anti-CL-L1 187-10 antibodies were raised against a stretch of 14 amino acids in the CRD. The domain and the regions are presented in relation to their relative size. B, illustration of the reactivity of pAb anti-CL-L1 (187-7 and 187-10) and mAb anti-CL-L1 (4F4) on membrane strips from a blot of a crude recombinant CL-L1 culture supernatant separated under reducing (left panel) and nonreducing (right panel) conditions. Strips were incubated with normal rabbit and mouse IgG as controls for pAb and mAb, respectively. Molecular markers are indicated. C, plasma and recombinant CL-L1 was caught from plasma and recombinant culture supernatant in microtiter wells coated with rabbit pAb anti-CL-L1 187-10. As a control, incubations were carried out in wells coated with normal rabbit IgG antibody (right panel). Bound serum and recombinant CL-L1 were eluted with SDS-PAGE sample buffer, separated on SDS-PAGE under reducing and nonreducing conditions, and analyzed by Western blotting with 4F4 mouse mAb anti-CL-L1 antibody as detecting antibody. The positions of molecular size markers are indicated. The experiment was repeated three times with similar results. Same results were obtained with serum.
Affinity Purification of CL-L1
To evaluate the specificity of pAb anti-CL-L1 antibody 187-10 against native CL-L1, and at the same time to investigate if the antibody used for coating in our assay could capture native CL-L1 from a protein solution, we performed analytical affinity purification. Microtiter plates were coated with pAb anti-CL-L1 187-10 or control normal rabbit IgG and incubated with EDTA plasma or rCL-L1 culture supernatant. Bound proteins were eluted with SDS-PAGE sample buffer, separated by SDS-PAGE, and analyzed by Western blotting. As shown in Fig. 1C, protein bands originating from EDTA plasma and developed with 187-10 were seen under nonreducing conditions migrating with molecular masses of 165, 330, and 490 kDa, likely corresponding to dimeric, tetrameric, and hexameric forms of CL-L1 subunits. The nonreduced recombinant CL-L1 showed a mobility corresponding to a mass of 75 kDa, which likely represents a single subunit of three polypeptides. Under reducing conditions, plasma and recombinant CL-L1 migrated with a mobility corresponding to a molecular mass of 37 kDa. Similar results were seen when using the pAb anti-CL-L1 187-7 antibody, which was employed as developing antibody in our sandwich assay (data not shown).
Quantification of Recombinant CL-L1
The concentration of CL-L1 was determined by establishing the ratios of three stable isotope-labeled standard peptides (heavy) and the equivalent endogenous (light) peptides using the absolute quantification approach (21). The analytical performance of the assay was determined by generating response curves using increasing amounts of heavy peptide response in the 1–200 fmol range (supplemental Fig. 1). To account for trypsin digestion variability or sample loss during handling, three separate digests were performed, and each digest was analyzed five times by LC-SRM-MS (Fig. 2). The mean concentration of CL-L1 in the recombinant CL-L1 supernatant was determined to be 47 fmol/μl with a standard deviation of 2.7% (supplemental Fig. 1). This translated to a CL-L1 polypeptide concentration of 1.30 μg/ml in our recombinant culture supernatant, if assuming a molecular mass of 28 kDa.
FIGURE 2.
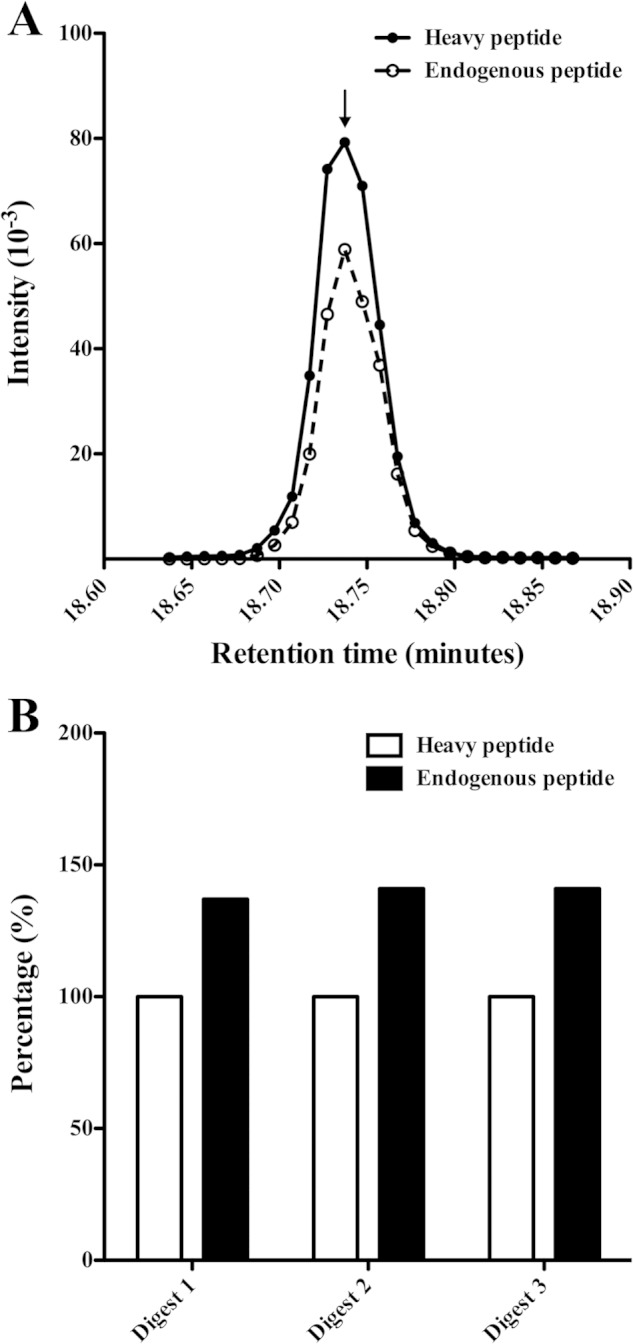
Quantification of CL-L1 using selected reaction monitoring. A, amount of CL-L1 was determined by measuring the ratio between three different CL-L1 stable isotope-labeled peptides of known concentration and the equivalent endogenous peptides using LC-SRM-MS. The ratio was calculated as the areas under the curves plotting the intensity signal for the heavy and the light peptide. The curves for the heavy and light DEAANTLIADYVAK peptides are shown as an example. B, three trypsin digestions were performed to account for variability in digestion or sample loss during sample handling, and each digest was analyzed five times by LC-SRM-MS. Average values of each peptide were summed to generate an intensity value for the endogenous CL-L1, which was normalized against the intensity of the known amount of heavy labeled peptides, which was 50 fmol (supplemental Fig. 1). The results obtained from three different trypsin digests are shown.
CL-L1 Assay
We initially screened the reactivity of 10 monoclonal and 2 polyclonal antibodies for their suitability in a solid-phase assay in terms of dose response and signal to noise ratio. Different buffers with low, neutral, and high pH, with low or high ionic strength, and with or without calcium ions present were assessed in combination with two concentrations (1 and 5 μg/ml) of the 12 anti-CL-L1 antibodies used for coating and developing with these as biotinylated in a matrix system. Based upon these preliminary results, we constructed a sandwich-based TRIFMA assay for CL-L1 with the following conditions: coating with 5 μg of anti-CL-L1 187-10 antibody per ml and developing with 1 μg of anti-CL-L1 187-7 antibody per ml. To further examine the suitability of the two different pAb anti-CL-L1 antibodies for an assay detecting native CL-L1 and their use in a solid-phase TRIFMA, we applied a dilution series of standard EDTA plasma and rCL-L1 culture supernatant onto wells coated with pAb anti-CL-L1 187-10, and subsequently developed with biotinylated anti-CL-L1 187-7 antibody. None of the monoclonal antibodies showed reactivity against native CL-L1 in this setup. Only the two pAb anti-CL-L1 antibodies exhibited reactivity toward native CL-L1. The results are shown in Fig. 3. This shows the standard curve obtained with a serial dilution of EDTA plasma and also the results when applying dilutions of rCL-L1. The dilution curves were parallel until the highest concentrations, indicating that the level of plasma CL-L1 could be estimated from the lower part of the curve obtained with rCL-L1. This leads to an estimated CL-L1 level of 2.6 μg/ml in our standard plasma pool. Other microtiter plates were simultaneously coated with nonspecific rabbit IgG and incubated with dilutions of EDTA plasma and rCL-L1 and were included as a control for antibody specificity (Fig. 3). The assay only worked in the presence of EDTA in the sample buffer (Fig. 3). This is presumably due to a different conformation of the C-terminal CRD domain of native folded CL-L1 with bound calcium ions, as compared with the synthetic linear peptides that were used as immunogens in the production of antibody. This could result in the production of antibodies recognizing a non-natural conformation of the CRD domain; thus, EDTA was necessary for the creation of a recognizable epitope. We found a dilution of 40-fold in most cases to be suitable for serum and plasma samples to be assayed for CL-L1. For routine analysis, three internal controls were added to each assay plate. The means and inter-assay coefficients of variation determined from 15 individual assays for the three internal controls were 2.7, 2.4, and 1.8 μg/ml and 18, 20, and 24%, respectively.
FIGURE 3.
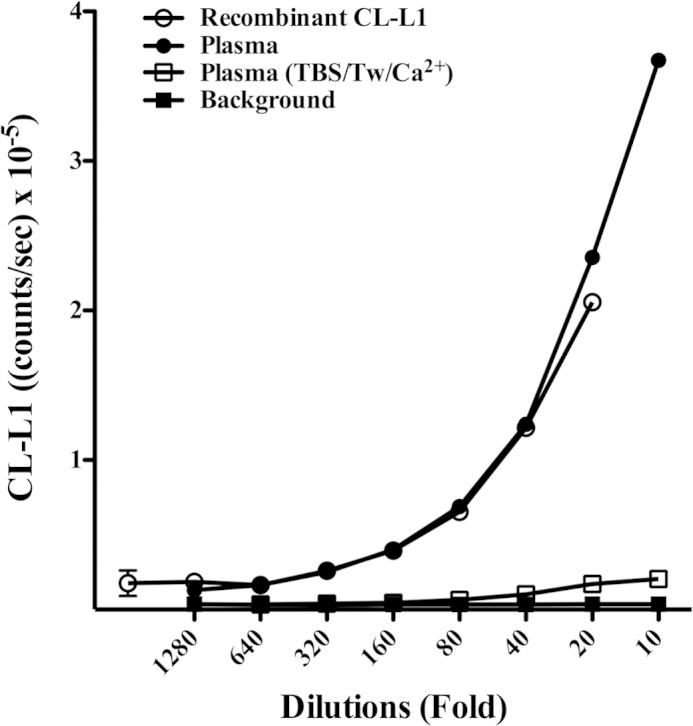
CL-L1 assay dilution curve. The response obtained in the CL-L1 assay when applying a dilution series of standard plasma, recombinant CL-L1 supernatant in EDTA-containing buffer, and Ca2+-containing buffer. Dilutions of plasma and recombinant CL-L1 (data not shown) in Ca2+-containing buffer resulted in marked reduced signal. Background controls were wells coated with normal rabbit IgG.
Ligand Selectivity of CL-L1
CL-L1 binds to mannose-derivatized TSK beads, and this binding could be inhibited by EDTA (Fig. 4A) as expected for a C-type lectin. The binding could be inhibited by mannose and glucose and also by l-fucose, N-acetylglucosamine (GlcNAc), and N-acetylmannosamine (ManNAc) but not by galactose (Fig. 4, B and C). The carbohydrate concentrations needed to inhibit 30% of the maximal signal (I30) for CL-L1 and MBL binding to mannose are given in Table 1. For comparison, we also show the results obtained in parallel for the inhibition of the binding of MBL to the mannose-TSK beads as estimated by the MBL TRIFMA described previously (22).
FIGURE 4.
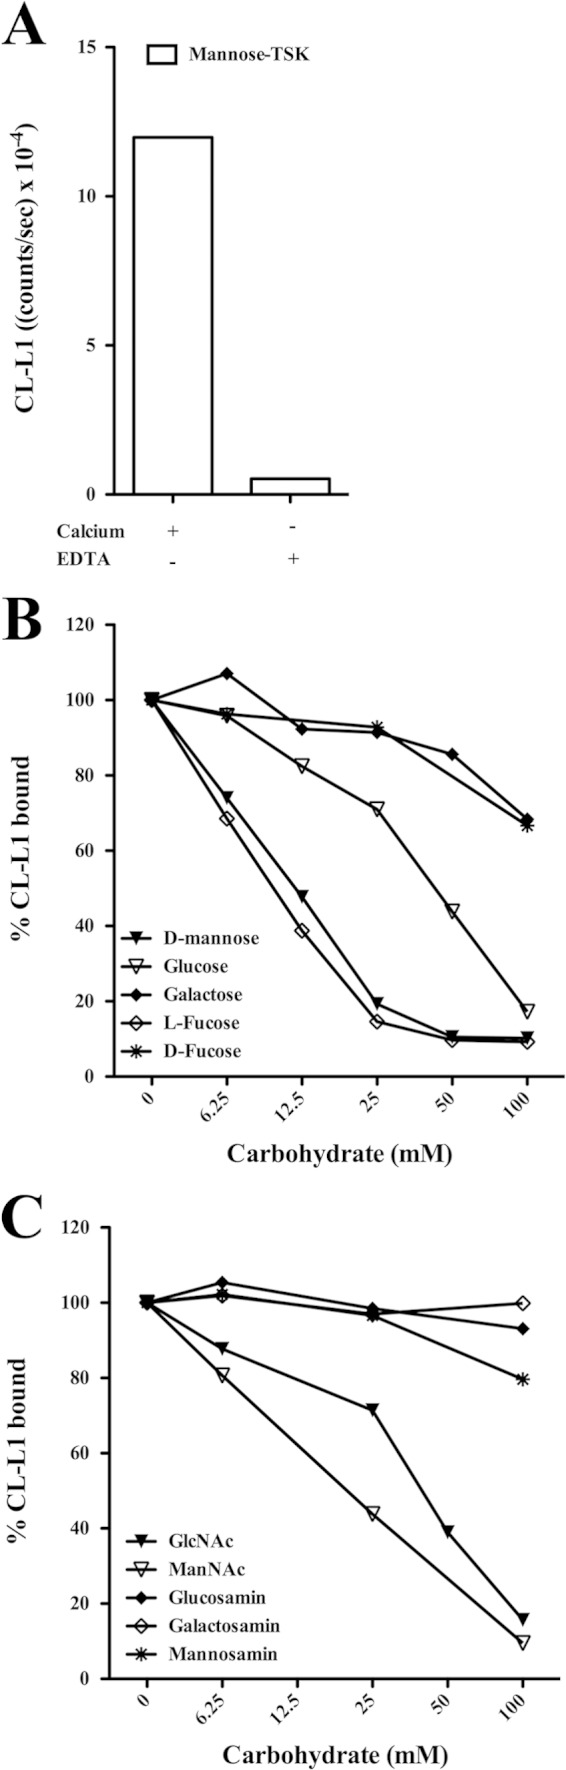
Ligand specificity of CL-L1. A, serum was diluted 2-fold in TBS/Tw/Ca2+ or TBS/Tw/EDTA and incubated with mannose-TSK beads. After washing, bound material was eluted with 100 mm d-mannose, and CL-L1 was estimated by TRIFMA. B and C, inhibition of the binding to mannose. Serum was diluted 2-fold in TBS/Tw/EDTA or in TBS/Tw/Ca2+ containing increasing concentrations of inhibitors, followed by incubation with mannose-derivatized beads. Bound CL-L1 was eluted with 100 mm mannose and measured by TRIFMA. Values obtained without added inhibitor were defined as 100% bound CL-L1.
TABLE 1.
Inhibition of CL-L1 and MBL binding
The carbohydrate concentration needed to inhibit 30% of maximal signal (I30) for CL-L1 and MBL binding to mannose was determined graphically from inhibition curves such as shown in Fig. 4, B and C.
| Inhibitor | CL-L1 binding to mannose-TSK, I30 | MBL binding to mannose-TSK, I30 |
|---|---|---|
| mm | mm | |
| d-Mannose | 7 | 16 |
| Glucose | 28 | 75 |
| Galactose | NIa | NIa |
| l-Fucose | 6 | 19 |
| d-Fucose | 85 | NIa |
| GlcNAc | 28 | 19 |
| ManNAc | 10 | 33 |
| Glucosamine | NIa | 63 |
| Galactosamine | NIa | NIa |
| Mannosamine | NIa | NIa |
a NI means not inhibitory, i.e. less than 30% inhibition at 100 mm.
Size of CL-L1 Estimated by Gel-permeation Chromatography
Serum and recombinant CL-L1 were fractionated on a Superose 6 HR column under nondissociating conditions in a calcium-containing buffer as well as in an EDTA-containing buffer. Fractions were collected and analyzed for CL-L1 (in both cases the CL-L1 assay was performed in the presence of EDTA as described). The results are shown in Fig. 5. The elution profile of CL-L1 upon fractionation of serum was similar in the presence and the absence of calcium. However, the front peak was significantly more prominent with calcium in the running buffer, and closer inspection revealed that the front peak shows a shoulder indicating merged peaks, i.e. two components with the later eluting one not being seen with EDTA in the running buffer (Fig. 5, A and B). Disregarding this unexplained (but reproducible) observation, the first peak eluted corresponding to an apparent mass of ∼750 kDa. The smaller peak eluted corresponding to an apparent mass of 250 kDa. Our recombinant CL-L1 eluted in one peak at a position corresponding to a mass of 200 kDa (Fig. 5C). In three experiments, we found the area under the curve ∼30% smaller when fractionating serum in the presence of EDTA than when fractionating in the presence of calcium ions. For rCL-L1, we saw no difference between fractionation in the presence or absence of calcium ions.
FIGURE 5.
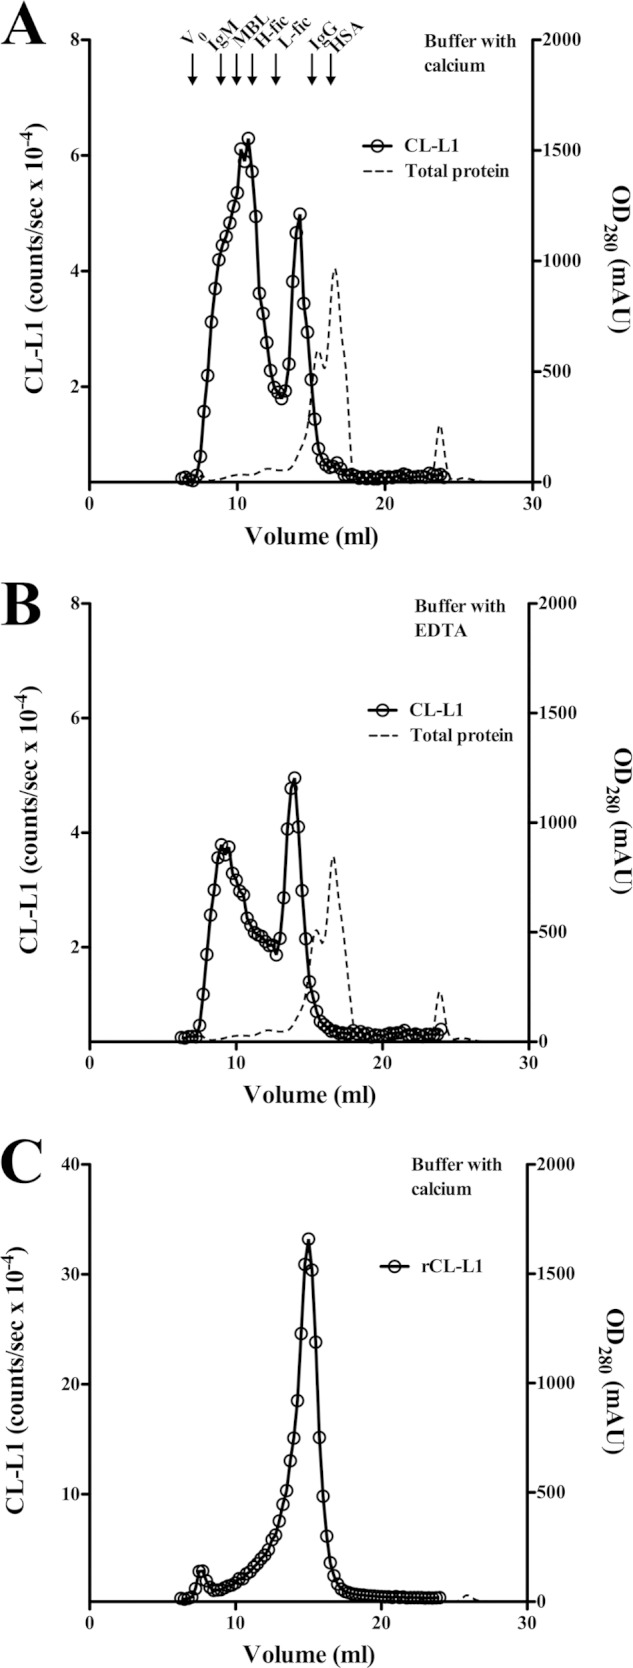
Analysis of CL-L1 in serum and of recombinant CL-L1 by gel-permeation chromatography. A, serum (100 μl) was passed through a Superose 6 column in a calcium ion-containing buffer, and B, in an EDTA-containing buffer. C, recombinant CL-L1 was fractionated in a calcium ion-containing buffer. Fractions were analyzed for CL-L1 content. The protein concentration is indicated as optical density at 280 nm. Arrows indicate the elution volume of IgM (970 kDa), MBL (800 kDa), IgG (150 kDa), and HSA (67 kDa). Also indicated are the elution volumes of H- and L-ficolin. The experiment was repeated three times with similar results. mAU, milliabsorbance unit.
CL-L1·MASP Complexes in Serum
We examined for complexes between CL-L1 and MASPs in serum. Microtiter wells were coated with pAb anti-CL-L1 187-10 antibody and, after incubation with serum, developed with biotinylated anti-CCP1 antibody, i.e. antibody reacting with a common determinant of MASP-1, MASP-3, and MAp44 (Fig. 6, A and B). Results from catching with anti-CCP1 and developing with anti-CL-L1 confirmed the presence of MASP·CL-L1 complexes (Fig. 6, C and D). When conducting the experiments at high salt concentration (1 m NaCl) together with EDTA in the sample incubation buffer, the signal was abolished. Presumably, the results reflect that dissociation of MASPs from the complexes required the presence of both EDTA and high salt concentration as was previously shown for MBL·MASP complexes (23). No signal was seen when coating with control rabbit IgG or mouse IgG and developing with biotinylated anti-CL-L1 or anti-CCP1 antibody. In similar experiments using anti-MASP-2 instead of anti-CCP1, we could not get a signal, possibly because the concentration of MASP-2 was 20 times lower than that of MASP-1, MASP-3, and MAp44 together or because the affinity of our anti-CCP-1 was higher than that of our anti-MASP-2 antibody, and thus provided for a more sensitive assay. Alternatively, CL-L1 was not associated with MASP-2. This corresponds to previous findings for CL-K1 (11).
FIGURE 6.

CL-L1·MASPs complexes in serum. Microtiter plates were coated with rabbit anti-CL-L1 (A and B) or anti-MASP antibody (mAb anti-CCP1) (C and D). The wells were incubated with a dilution series of serum diluted in buffer with EDTA or the same buffer with NaCl added to 1 m, washed, and developed with biotinylated anti-CL-L1 antibody in A and C, or anti-CCP1 antibody in B and D, followed by incubation with europium-labeled streptavidin. Microtiter wells coated with normal rabbit or mouse IgG were used as specificity controls (backgrounds). The results indicate that CL-L1 is found in serum in complex with either MASP-1, MASP-3, MAp44, or all three. The experiments were repeated with same results. Mean and S.D. for the duplicates are given.
Stability of CL-L1
The stability of CL-L1 in EDTA plasma and serum upon storage at different temperatures was assessed (Fig. 7A). CL-L1 levels in plasma remained stable at room temperature, 4 °C, and 37 °C during the first 5 days of incubation. Past day 5, we observed a rapid degradation of CL-L1 in samples stored at 37 °C, although at room temperature a less dramatic degradation was seen. At day 5 at room temperature, we observed a minor drop of 20% in measured CL-L1, and a more substantial drop of 57% at day 54. At 37 °C, however, the degradation was more rapid, with a 40% drop at day 5 and a 97% decrease at day 54. Samples stored at 4 °C remained stable for the entire period. Similar results were obtained for serum (data not shown). Sodium azide was added to all samples before incubations to prevent bacterial growth. To further assess the stability of CL-L1 in serum and plasma, we subjected samples to repeated cycles of freezing and thawing. We initially collected fresh EDTA plasma and serum from the same individual, and we subjected samples to 10 cycles of freezing and thawing, followed by measuring CL-L1 levels (Fig. 7B). CL-L1 was stable in both EDTA plasma and serum throughout repeated freezing-thawing cycles, with a mean variation of 3 and 9%, respectively, as compared with samples not subjected to freezing and thawing.
FIGURE 7.
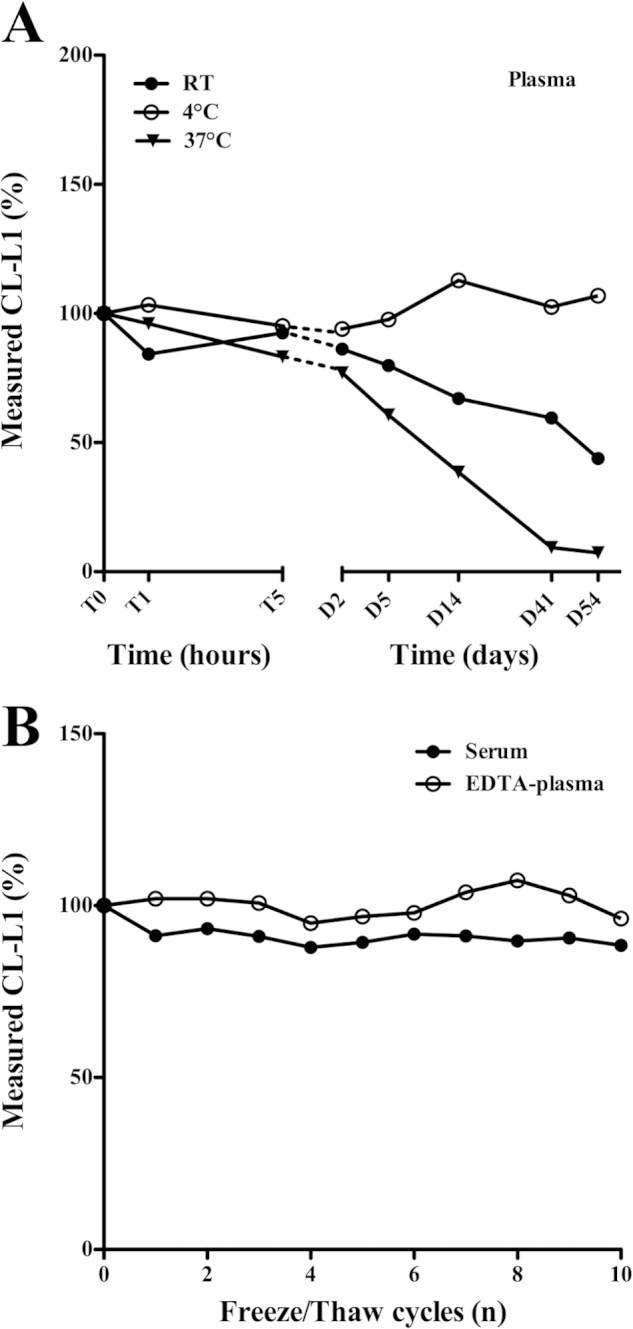
Stability of CL-L1 in plasma. A, fresh plasma and serum were collected from the same individual and kept at different temperatures (room temperature (RT), 4 °C, and 37 °C) for various time periods after which aliquots were collected and stored at −80 °C. CL-L1 levels were subsequently measured by TRIFMA. Time periods are indicated on the x axis. The same results were seen with serum. The experiment was repeated with same results. B, CL-L1 concentration was estimated after repeated freezing and thawing cycles of serum, and EDTA plasma samples were obtained from the same individual. The zero values are estimates from freshly drawn plasma.
Levels of CL-L1 in Blood Donors
EDTA plasma from 210 blood donors were analyzed to determine normal variations in CL-L1 concentration (Fig. 8A). The median was 3.0 μg/ml and the mean was 3.1 μg/ml (S.D. 0.72 with a range from 1.6 μg/ml to 5.5 μg/ml). The values of CL-L1 concentrations followed a normal Gaussian distribution when log-transformed (Kolmogorov-Smirnov normality test) (Fig. 8B). To evaluate the suitability of either serum or EDTA plasma for the measurement of CL-L1 concentration, we assayed 70 corresponding EDTA plasma and serum samples (Fig. 8C). Although there was a good correlation between measured CL-L1 in EDTA plasma and serum from the same individual (Pearson R = 0.76, p < 0.0001), we observed on average 17% higher values in EDTA plasma samples (mean 2.9 μg/ml) compared with serum samples (2.4 μg/ml). To evaluate the most suitable samples to measure CL-L1, we also compared CL-L1 levels in serum, EDTA plasma, citrate plasma, and heparin plasma obtained from three healthy individuals taken in sequence from the same person (Fig. 8D). We generally observed comparable CL-L1 levels in serum plasma and citrate plasma for each individual, but an 18 and 35% higher average level was seen in EDTA plasma and heparin plasma, respectively, as compared with serum.
FIGURE 8.

Normal levels of CL-L1. A, CL-L1 levels in EDTA plasma from 210 blood donors. Median (3.0 μg/ml, line inside box), 5–95% percentiles (whiskers), and arithmetic mean (3.1 μg/ml, cross inside box). The box indicates 25–75% percentiles. B, histogram of the frequency distribution of the log-transformed CL-L1 concentrations, illustrating a normal distribution after log transformation. C, comparison of CL-L1 in serum and EDTA plasma from 70 blood donors. The solid line indicates linear regression (Pearson R = 0.76). The statistic of the fit is indicated on the graph. D, CL-L1 concentrations in serum plasma, citrate plasma, EDTA plasma, and heparin plasma from three individuals. The experiment was repeated three times with similar results.
Variation of CL-L1 Levels Over Time
Intra-individual variation in CL-L1 levels was evaluated in EDTA plasma samples from 10 apparently healthy individuals over a 1-year period (Fig. 9). The same samples have previously been examined for MASP-2 (24), MASP-3, and MAp44 (20) and MASP-1 levels (24). As depicted in Fig. 9B, we observed relatively stable levels of CL-L1 over this time period. However, for a few individuals we saw complex variations. A rise of 70% in CL-L1 level was seen from one day to the next for one individual (Fig. 9A, individual 4). If CL-L1 indeed functions as a PRM in innate immunity, then the fluctuations could possibly correlate with periods of infection, reflecting regulation of CL-L1.
FIGURE 9.
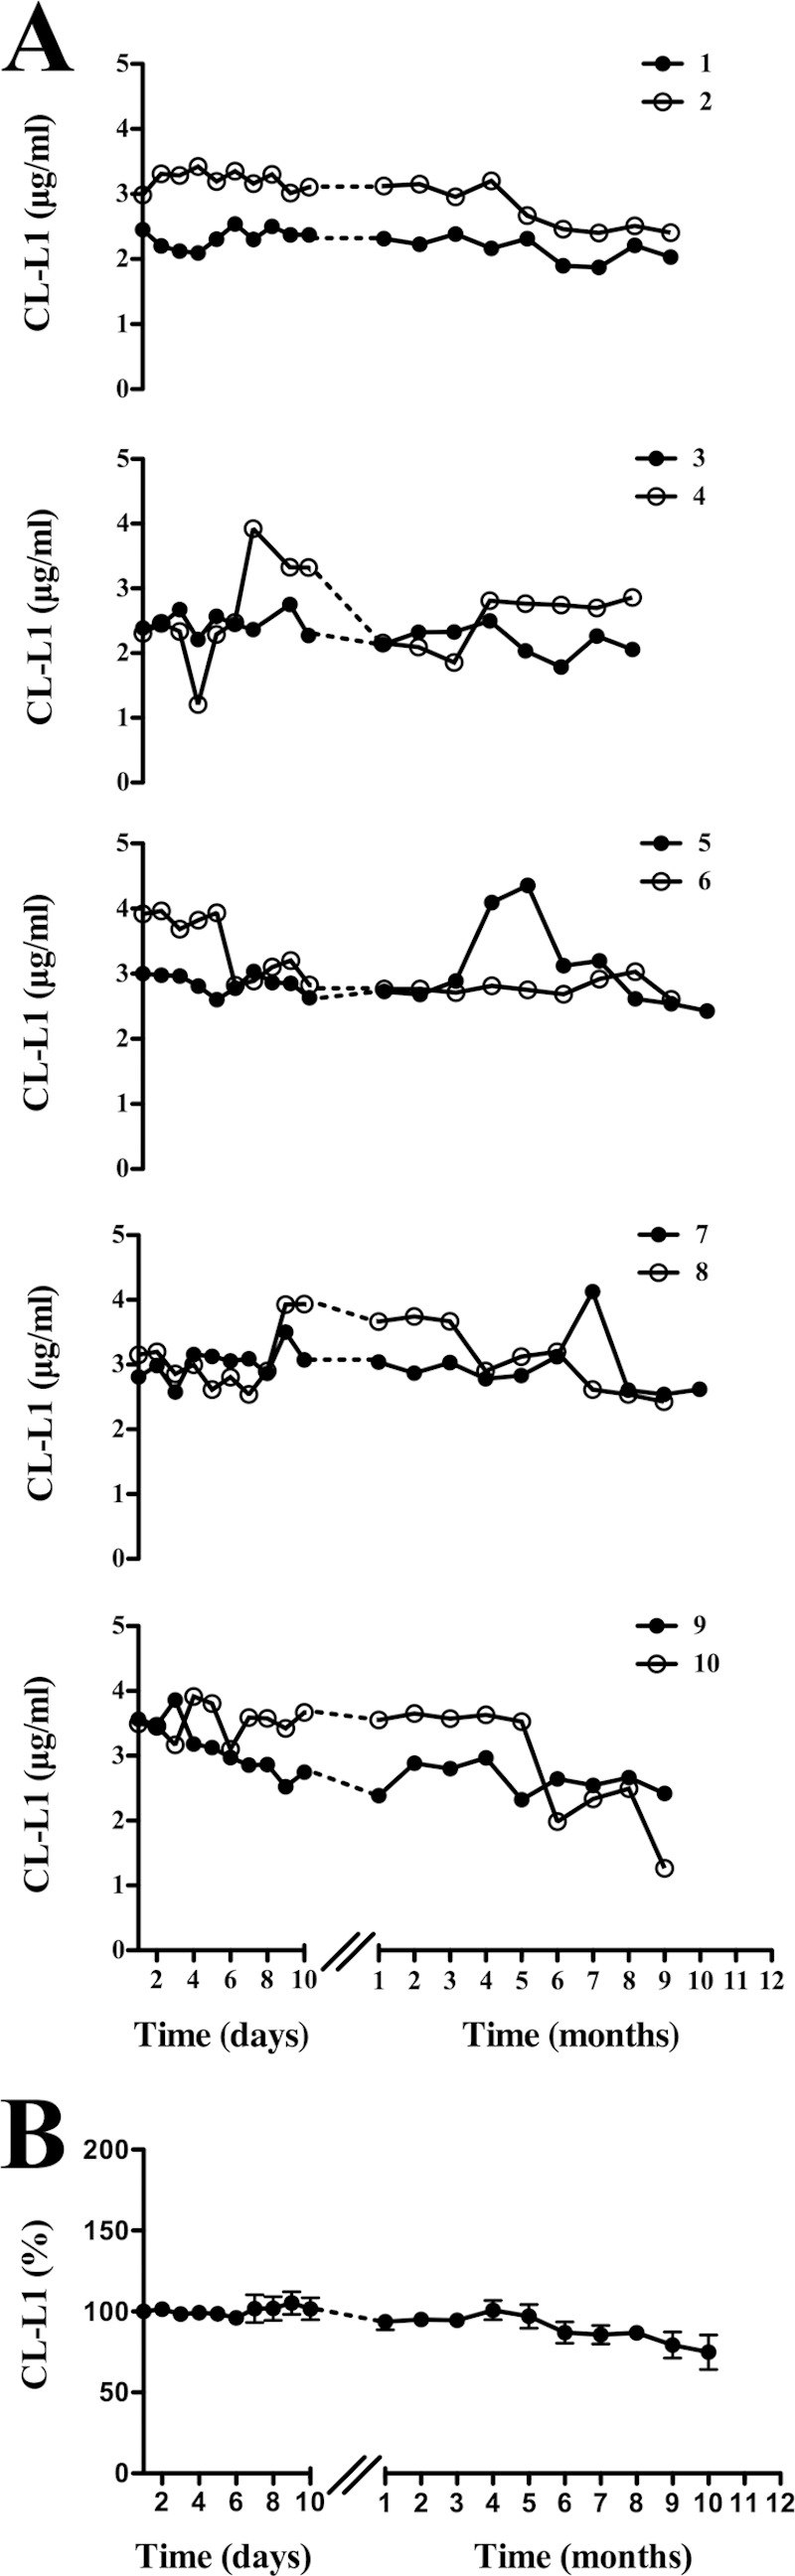
Intra-individual variation of CL-L1 over time. A, concentration of CL-L1 was estimated in EDTA plasma samples obtained over a 1-year period from 10 apparently healthy individuals. Measurements from two individuals are depicted in each graph. B shows the collective variation of CL-L1 concentration from all 10 individuals in percentage.
Ontogeny
Sequential blood samples were collected from the umbilical cord at term, at 6, 9, and 12 months after birth from 12 infants. Previously, the same samples have been examined for MBL (12), M-ficolin (19), MASP-3 and MAp44 (16), and MASP-1 levels (24). The CL-L1 levels in the 12 serum samples are shown in Fig. 10. Basically, the levels were quite stable throughout this 1st year of life, but in some infants an increase of around 15% was seen from birth to 6 months of age, followed by a decrease to the original level. On average, we observed a 10% variation of CL-L1 levels throughout the 1st year of life, as compared with umbilical cord levels. Overall, we measured 26% less in the infants as compared with adults (Fig. 8A), with a median and mean of 2.2 and 2.3 μg/ml, respectively over the 1st year of birth.
FIGURE 10.
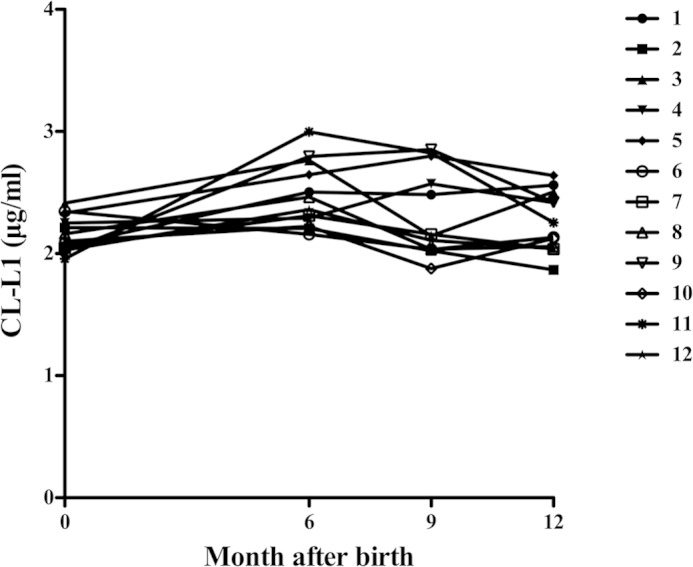
Ontogeny of CL-L1. The concentrations of CL-L1 were measured in sequential samples from 12 infants at term and during their 1st year of life (6, 9, and 12 months).
Acute-phase Response
To investigate CL-L1 levels during an acute-phase reaction, we tested sequential serum samples obtained from six patients undergoing operation for colorectal cancer. The same serum samples have previously been examined for both interleukin 6 (IL-6) and CRP as classical acute-phase proteins and also for MBL, MASP-2 (13), M-ficolin (19), MASP-3, MAp44 (16), and MASP-1 (24). The serum samples were selected based upon three main criteria as follows: a low pre-operation CRP level; a distinct post-operation rise in CRP, and a drop to near base line in the last sample taken. The response for both CL-L1 and CRP for the 6 patients is shown in Fig. 11. In general, the variations seen after the operation were not different from the variations seen in the samples taken over time from healthy individuals (Fig. 9). For one individual, a decrease within 1–2 days post-operation and then an increase reaching a stable level around days 5–6 were seen. At 24 h post-operation, we observed a 50% decrease, as compared with samples taken before surgery, with a following increase to normal levels at day 5 (Fig. 11E). The initial decrease in CL-L1 level was seen simultaneously with the rise in CRP. The data presented in this study do not suggest that CL-L1 behaves as a classical acute-phase protein.
FIGURE 11.

CL-L1 levels during an acute-phase response. CL-L1 concentrations were measured in six patients undergoing surgery for colorectal cancer. Values at t = 0 represent levels in serum from blood drawn just prior to surgery. Each graph represents measurements from a single patient (A–F). The previously determined variation in CRP concentrations in the same samples are also indicated.
DISCUSSION
CL-L1, also known as collectin 10 or COLEC-10 (from the gene assignation), was described as a C-type lectin some years ago (6), but it has since escaped the attention of the scientific community. Because the structure of CL-L1 indicates that the protein may serve functions in the innate immune defense similar to those of MBL and the ficolins (Fig. 1A), we decided to try to start remedying this omission.
We developed antibodies for CL-L1 and used these for the construction of a quantitative assay, based on TRIFMA. The antibodies were raised by peptide immunization and turned out to depend upon an artificial conformation of the CRD, induced by the removal of the complexed calcium ion, which is essential for the ligand-binding capacity. Collectins are calcium-dependent carbohydrate-binding PRMs, and the presence of calcium is required for the CRD to be able to bind its ligand (Fig. 4A). A conformational change in the CRD is indicated when the calcium ion is removed by chelation with EDTA (Fig. 3).
Using antibody-coated microtiter wells for affinity purification, we could demonstrate pull-out of CL-L1 from plasma, and upon Western blotting, we found the presence of three different covalently linked oligomeric forms of CL-L1, possibly representing dimeric, tetrameric, and hexameric forms of the trimeric subunit. The transiently expressed CL-L1, however, showed only one band corresponding to a single trimeric subunit (Fig. 1C). Upon gel-permeation chromatography of serum, we found CL-L1 eluting in two peaks at positions corresponding to relative molecular masses of 700–800 and 200–300 kDa, respectively (Fig. 5). A distribution of the natural protein in different oligomeric forms was reported also for the C-type lectins as follows: MBL (25), CL-K1 (8), as well as for the other complement-activating PRMs, the ficolins (25).
Using sandwich assay coating with antibody against CL-L1 and developing with anti-MASP antibody, we could demonstrate the presence in serum of complexes between CL-L1 and MASP1 gene products, i.e. MASP-1, MASP-3, and/or MAp44. The antibody used was directed against a common domain. Unfortunately, our antibodies, selective for the individual components, were not sensitive enough to resolve which of the components was associated. The same may be the case for our anti-MASP-2 antibody. These results are thus completely parallel to those obtained for the collectin CL-K1 (11) and cannot determine whether the CL-L1·MASP complexes are capable of activating complement. We could not purify CL-L1 from serum to resolve this question, and our recombinant CL-L1 did not show the oligomeric structure required for functional activity.
The association of MASP-2 with MBL and ficolins has been suggested to be a motif containing the sequence PGKXGP (X = is L in MBL and A in the ficolins) in the collagen-like region, where the K in the middle is essential (26, 27). The corresponding sequence in CL-L1 is IGKTGP, and we do not know if this motif will mediate binding of MASP-2. With regard to the binding of MASP1/3, a more relaxed motif may exists.
We were unsuccessful in purifying CL-L1 from serum to a level required for quantification, and therefore we decided to quantify rCL-L1 in the culture supernatant by using the absolute quantification approach (Fig. 2). We are convinced that we were able to use this material for quantification of CL-L1 in plasma because this material formed a parallel dilution curve in the dynamic range of the assay (Fig. 3).
The CL-L1 levels in blood donors showed a median of 3.0 μg/ml (n = 210) with a low and high of 1.6 and 5.5 μg/ml, respectively (Fig. 8). Measurements of CL-L1 levels over a 1-year period in 10 individuals revealed rather stable levels (Fig. 9), with the exception of two persons with up to a 70% increase and a 50% decrease in one individual. Some of these fluctuations may reflect periods of microbial challenge.
Measurements of CL-L1 in samples obtained during an acute-phase period induced by major surgery showed a modest down-regulation, coinciding with the CRP response, followed by an increase to levels comparable with pre-operational samples (Fig. 11). Although some fluctuations are apparent during incision, we do not suggest that CL-L1 in the future may be considered a classical acute-phase protein. However, we do not know if infections will have an impact on the CL-L1 levels. Ontogeny studies (Fig. 10) suggest that CL-L1, like MBL, may have a special role during the 1st year of life when other elements of the immune system are not fully developed or otherwise deficient.
Wakamiya and co-workers (6) have previously made initial characterizations of the lectin activity of isolated recombinant CRD domains of CL-L1. In this study, we investigated the carbohydrate selectivity of whole CL-L1. Serum was incubated with mannose-derivatized TSK beads and CL-L1 allowed to bind. The mannose-bound CL-L1 was eluted and quantified (Fig. 4). The binding to the mannose beads was inhibited by mannose, glucose, l-fucose, GlcNAc, and ManNAc, but not galactose, in agreement with the requirement for 3- and 4-C-attached horizontal hydroxyl groups of the hexoses, as is the case for other collectins (28). In contrast, Wakamiya and co-workers (6, 29) found identical binding of labeled mannose, galactose, and d-fucose and only marginal inhibition by EDTA. The EPN amino acid motif in the CRD, which is the main determinant for mannose-binding specificity, is present in both MBL and in CL-L1, although in CL-L1 asparagine is substituted for serine. The carbohydrate selectivity of CL-L1 was therefore very similar to that of MBL. Because we also present evidence for the association of the activating enzymes of the lectin pathway (MASPs) (Fig. 6), one might speculate that CL-L1 could substitute for MBL in case of MBL deficiency, although we do not know if there might be differences in the recognition of bacteria, viruses, or parasites.
This study establishes CL-L1 as a serum protein and furnishes a number of results concerning the biology of CL-L1. The new findings provide the basis for future studies on CL-L1 and point to possible associations between CL-L1 levels and clinical features.
Supplementary Material
This work was supported by The Danish Council for Independent Research, Medical Sciences, and the Lundbeck Foundation and the Novo Nordic Foundation.

This article contains supplemental Fig. 1.
- PRM
- pattern-recognition molecule
- TRIFMA
- time-resolved immunofluorometric assay
- CRD
- carbohydrate recognition domain
- MBL
- mannan-binding lectin
- CLR
- cross-linking region
- MASP
- MBL-associated serine protease
- LC-SRM-MS
- liquid-chromatography selected reaction monitoring mass-spectrometry
- pAb
- polyclonal antibody
- mAb
- monoclonal antibody
- HSA
- human serum albumin
- CRP
- C-reactive protein
- hIgG
- human IgG
- BisTris
- 2-[bis(2-hydroxyethyl)amino]-2-(hydroxymethyl)propane-1,3-diol
- rCL
- recombinant CL.
REFERENCES
- 1. Thiel S. (2007) Complement activating soluble pattern recognition molecules with collagen like regions, mannan-binding lectin, ficolins and associated proteins. Mol. Immunol. 44, 3875–3888 [DOI] [PubMed] [Google Scholar]
- 2. Bordet J., Streng O. (1909) Les phénoménes d'adsorption et la conglutinine de serum de boeuf. Zbl. Bakt. 49, 260 [Google Scholar]
- 3. Kawasaki T., Etoh R., Yamashina I. (1978) Isolation and characterization of mannan-binding protein from rabbit liver. Biochem. Biophys. Res. Commun. 81, 1018–1024 [DOI] [PubMed] [Google Scholar]
- 4. White R. T., Damm D., Miller J., Spratt K., Schilling J., Hawgood S., Benson B., Cordell B. (1985) Isolation and characterization of the human pulmonary surfactant apoprotein gene. Nature 317, 361–363 [DOI] [PubMed] [Google Scholar]
- 5. Persson A., Rust K., Chang D., Moxley M., Longmore W., Crouch E. (1988) CP4: a pneumocyte-derived collagenous surfactant-associated protein. Evidence for heterogeneity of collagenous surfactant proteins. Biochemistry 27, 8576–8584 [DOI] [PubMed] [Google Scholar]
- 6. Ohtani K., Suzuki Y., Eda S., Kawai T., Kase T., Yamazaki H., Shimada T., Keshi H., Sakai Y., Fukuoh A., Sakamoto T., Wakamiya N. (1999) Molecular cloning of a novel human collectin from liver (CL-L1). J. Biol. Chem. 274, 13681–13689 [DOI] [PubMed] [Google Scholar]
- 7. Ohtani K., Suzuki Y., Eda S., Kawai T., Kase T., Keshi H., Sakai Y., Fukuoh A., Sakamoto T., Itabe H., Suzutani T., Ogasawara M., Yoshida I., Wakamiya N. (2001) The membrane-type collectin CL-P1 is a scavenger receptor on vascular endothelial cells. J. Biol. Chem. 276, 44222–44228 [DOI] [PubMed] [Google Scholar]
- 8. Keshi H., Sakamoto T., Kawai T., Ohtani K., Katoh T., Jang S. J., Motomura W., Yoshizaki T., Fukuda M., Koyama S., Fukuzawa J., Fukuoh A., Yoshida I., Suzuki Y., Wakamiya N. (2006) Identification and characterization of a novel collectin CL-K1. Microbiol. Immunol. 50, 1001–1013 [DOI] [PubMed] [Google Scholar]
- 9. Ohtani K., Suzuki Y., Wakamiya N. (2012) Biological function of the novel collectins CL-L1, CL-K1, and CL-P1. J. Biomed. Biotechnol. 2012, 493945–493953 [DOI] [PMC free article] [PubMed] [Google Scholar]
- 10. Selman L., Hansen S. (2012) Structure and function of collectin liver 1 (CL-L1) and collectin 11 (CL-11, CL-K1). Immunobiology 217, 851–863 [DOI] [PubMed] [Google Scholar]
- 11. Hansen S., Selman L., Palaniyar N., Ziegler K., Brandt J., Kliem A., Jonasson M., Skjoedt M. O., Nielsen O., Hartshorn K., Jørgensen T. J., Skjødt K., Holmskov U. (2010) Collectin 11 (CL-11, CL-K1) is a MASP-1/3-associated plasma collectin with microbial binding activity. J. Immunol. 185, 6096–6106 [DOI] [PubMed] [Google Scholar]
- 12. Ma Y. J., Skjoedt M. O., Garred P. (2013) Collectin 11/MASP complex formation triggers activation of the lectin complement pathway–the fifth lectin pathway initiation complex. J. Innate Immun. 5, 242–250 [DOI] [PMC free article] [PubMed] [Google Scholar]
- 13. Thiel S., Bjerke T., Hansen D., Poulsen L. K., Schiøtz P. O., Jensenius J. C. (1995) Ontogeny of human mannan-binding protein, a lectin of the innate immune system. Pediatr. Allergy Immunol. 6, 20–23 [DOI] [PubMed] [Google Scholar]
- 14. Ytting H., Christensen I. J., Basse L., Lykke J., Thiel S., Jensenius J. C., Nielsen H. J. (2006) Influence of major surgery on the mannan-binding lectin pathway of innate immunity. Clin. Exp. Immunol. 144, 239–246 [DOI] [PMC free article] [PubMed] [Google Scholar]
- 15. MacLean B., Tomazela D. M., Shulman N., Chambers M., Finney G. L., Frewen B., Kern R., Tabb D. L., Liebler D. C., MacCoss M. J. (2010) Skyline: an open source document editor for creating and analyzing targeted proteomics experiments. Bioinformatics 26, 966–968 [DOI] [PMC free article] [PubMed] [Google Scholar]
- 16. Degn S. E., Thiel S., Nielsen O., Hansen A. G, Steffensen R., Jensenius J. C. (2011) MAp19, the alternative splice product of the MASP-2 gene. J. Immunol. Methods 373, 89–101 [DOI] [PMC free article] [PubMed] [Google Scholar]
- 17. Fornstedt N., Porath J. (1975) Characterization studies on a new lectin found in seeds of Vicia ervilia. FEBS Lett. 57, 187–191 [DOI] [PubMed] [Google Scholar]
- 18. Hansen S., Thiel S., Willis A., Holmskov U., Jensenius J. C. (2000) Purification and characterization of two mannan-binding lectins from mouse serum. J. Immunol. 164, 2610–2618 [DOI] [PubMed] [Google Scholar]
- 19. Wittenborn T., Thiel S., Jensen L., Nielsen H. J., Jensenius J. C. (2010) Characteristics and biological variations of M-ficolin, a pattern recognition molecule, in plasma. J. Innate Immun. 2, 167–180 [DOI] [PubMed] [Google Scholar]
- 20. Degn S. E., Jensen L., Gál P., Dobó J., Holmvad S. H., Jensenius J. C., Thiel S. (2010) Biological variations of MASP-3 and MAp44, two splice products of the MASP-1 gene involved in regulation of the complement system. J. Immunol. Methods 361, 37–50 [DOI] [PubMed] [Google Scholar]
- 21. Gerber S. A., Rush J., Stemman O., Kirschner M. W., Gygi S. P. (2003) Absolute quantification of protein and phosphorproteins from cell lysates by tandem MS. Proc. Natl. Acad. Sci. U.S.A. 100, 6940–6945 [DOI] [PMC free article] [PubMed] [Google Scholar]
- 22. Zacho R. M., Jensen L., Terp R., Jensenius J. C., Thiel S. (2012) Studies of the pattern recognition molecule H-ficolin: specificity and purification. J. Biol. Chem. 287, 8071–8081 [DOI] [PMC free article] [PubMed] [Google Scholar]
- 23. Matsushita M., Thiel S., Jensenius J. C., Terai I., Fujita T. (2000) Proteolytic activities of two types of mannose-binding lectin associated serine proteases. J. Immunol. 165, 2637–2642 [DOI] [PubMed] [Google Scholar]
- 24. Møller-Kristensen M., Jensenius J. C., Jensen L., Thielens N., Rossi V., Arlaud G., Thiel S. (2003) Levels of the mannan-binding lectin-associated serine protease-2 in healthy individuals. J. Immunol. Methods 282, 159–167 [DOI] [PubMed] [Google Scholar]
- 25. Thiel S., Jensen L., Degn S. E., Nielsen H. J., Gál P., Dobó J., Jensenius J. C. (2012) Mannan-binding lectin (MBL)-associated serine protease-1 (MASP-1), a serine protease associated with humoral pattern-recognition molecules: normal and acute-phase levels in serum and stoichiometry of the lectin pathway components. Clin. Exp. Immunol. 169, 38–48 [DOI] [PMC free article] [PubMed] [Google Scholar]
- 26. Teillet F., Lacroix M., Thiel S., Weilguny D., Agger T., Arlaud G. J., Thielens N. M. (2007) Identification of the site of human mannan-binding lectin involved in the interaction with its partner serine proteases: the essential role of Lys55. J. Immunol. 178, 5710–5716 [DOI] [PubMed] [Google Scholar]
- 27. Girija U. V., Dodds A. W., Roscher S., Reid K. B., Wallis R. (2007) Localization and characterization of the mannose-binding lectin (MBL)-associated serine protease-2 binding site in rat ficolin-A: equivalent binding sites within the collagenous domains of MBLs and ficolins. J. Immunol. 179, 455–462 [DOI] [PMC free article] [PubMed] [Google Scholar]
- 28. Holmskov U., Thiel S., Jensenius J. C. (2003) Collectins and ficolins: humoral lectins of the innate immune defence. Annu. Rev. Immunol. 21, 547–578 [DOI] [PubMed] [Google Scholar]
- 29. Kawai T., Suzuki Y., Eda S., Kase T., Ohtani K., Sakai Y., Keshi H., Fukuoh A., Sakamoto T., Nozaki M., Copeland N. G., Jenkins N. A., Wakamiya N. (2002) Molecular cloning of mouse collectin liver 1. Biosci. Biotechnol. Biochem. 66, 2134–2145 [DOI] [PubMed] [Google Scholar]
Associated Data
This section collects any data citations, data availability statements, or supplementary materials included in this article.