

Abstract
Visceral adipose tissue (VAT) is associated with abnormal cardiovascular and metabolic profiles. Total VAT volume of the abdominal compartment by MRI is the gold standard measurement for VAT but is costly and time consuming. Prior studies suggest VAT area on a single slice MR image may serve as a surrogate for total VAT volume but it is unknown if this relationship is maintained in overweight and obese males and females.
Untreated sleep apnea subjects enrolled into the Icelandic Sleep Apnea Cohort underwent abdominal MRI. VAT area and subcutaneous adipose tissue (SAT) area at the L2-L3 and L4-L5 interspaces and total VAT and SAT volumes were determined by manual examination using image analysis software.
N=539 males and N=129 females with mean ages of 54.1 and 58.8 years and mean body mass index of 32.2 kg/m2 and 33.7 kg/m2, respectively, were studied. Mean total VAT volume was 40% smaller and mean total subcutaneous adipose tissue (SAT) was 25% larger among females compared to males. The correlation with VAT volume was significantly larger for L2-L3 VAT area (r=0.96) compared to L4-L5 VAT area (r=0.83). The difference in correlation coefficients was statistically significant (non-parametric bootstrap p<0.001 with 95% CI for the difference from 0.11 to 0.15. VAT area at L2-L3 was also significantly better correlated with VAT volume than traditional anthropometric variables. Linear regression analyses demonstrated that L2-L3 area alone was sufficient for predicting total VAT volume and that the nature of the linear association was maintained across all levels of obesity and in both genders.
INTRODUCTION
Obesity is a growing epidemic, currently affecting more than 1/3 of adults in the U.S.1–3 The rise in the percentage of individuals with morbid obesity i.e., those with a body mass index (BMI) above 40 kg/m2, is especially concerning.3 Adverse outcomes linked to obesity include metabolic syndrome, cardiovascular disease and obstructive sleep apnea.4 Not all adipose tissue is anatomically or metabolically equivalent. Visceral adipose tissue (VAT) is thought to confer the greatest risk for these diseases as well as for all-cause mortality5–13 through its role as an active endocrine adipose tissue bed that secretes both free fatty acids and adipokines.14–16. Anthropometric measures such as waist circumference are indirect measures of abdominal adipose tissue deposition and do not distinguish VAT from subcutaneous adipose tissue (SAT)17. Total VAT volume of the entire abdominal compartment has been considered a gold standard.18–22 Computerized tomography (CT) and magnetic resonance imaging (MRI) have been used to assess total VAT; but CT results in exposure to ionizing radiation. MRI assessment is equally accurate23–25 and avoids ionizing radiation. However, it is costly and time consuming. Prior studies have investigated VAT area on a single MR image taken through the abdomen and have concluded that such areas are highly correlated with total VAT volume of the abdominal compartment.18, 26–30 The single image used in these analyses has typically been taken through the abdomen at the level of the L4-L518, 30 or the L2-L3 lumbar vertebral interspaces.27, 28 Adipose distribution is currently not well understood in the very obese and may differ significantly from the non-obese. There remains significant controversy as to whether VAT area from a single axial MRI is an adequate surrogate of total VAT volume among the obese.31 While the effects of gender in determining adipose distribution have been well described, it is unclear if gender differences persist in obese individuals or if gender differences can be reproduced using only a single slice. Moreover, the question of which single axial MRI (L2-L3 or L4-L5) best reflects the total underlying VAT volume remains unknown.32, 33
This study characterizes the distribution of adipose tissue in male and female subjects from the Icelandic Sleep Apnea Cohort (ISAC), a cohort that is approximately evenly split into those with BMI <30 kg/m2, those with BMI between 30 and 35 kg/m2, and those with BMI >35 kg/m2. Single axial MR images taken at the level of the L4-L5 interspace and the L2-L3 interspace were compared with total overall abdominal VAT volume. The primary a priori hypothesis for this study was that a single MR image performed at one of these anatomic locations (L2-L3 or L4-L5 lumbar vertebral interspaces) would be highly correlated with total VAT volume across all levels of obesity and for both genders.
METHODS
The study was approved by the National Bioethics Committee (VSN: 02-078-V1-7) and Data Protection Authority of Iceland and the University of Pennsylvania Institutional Review Board. Recruitment of subjects and enrollment in the protocol was undertaken by personnel at Landspitali University Hospital in Reykjavik, Iceland.
Study participants
Patients diagnosed with OSA in Iceland and referred for CPAP treatment to the Landspitali University Hospital in Reykjavik from September 2005 - December 2009 where invited to join the study. Over 90% of eligible and approached subjects agreed to participate. They are part of the Icelandic Sleep Apnea Cohort (ISAC) study.
Prior to starting CPAP, all subjects underwent a detailed assessment, including anthropometric measurements, complete medical history, administration of health related quality of life and other questionnaires, and MRI. All assessments and MR imaging was performed at Landspitali University Hospital in Reykjavik, Iceland.
The Icelandic Sleep Apnea cohort consists of N=826 patients. However, MRI was not performed for N=113 (85 due to claustrophobia, 5 due to presence of a pacemaker, 5 due to other metallic objects, 7 because they were too obese, and 11 for other reasons). The percentages of male subjects was nearly identical (81%) among those with (577 of 713) or without (92 of 113) MRI. The mean (SD) ages among those with and without MRI were similar, 54.7 (10.6) versus 52.5 (10.5), although the mean difference was statistically significant (t-test p=0.04). In contrast, mean (SD) BMI was substantially lower, although still very high, among those with MRI compared to those without; 32.8 (5.1) kg/m2 vs 38.0 (7.1) kg/m2. Mean (SD) BMI was 47.3 (4.6) with range 40.8 to 53.2 among the 7 subjects excluded for being too obese and was elevated among 85 subjects excluded due to claustrophobia (mean 37.4 kg/m2). Those excluded for metallic objects or for a pacemaker had mean values similar to those not excluded (34.3 kg/m2 and 33.2 kg/m2, respectively. Among the 713 remaining subjects, 6 subjects were missing all MRI variables of interest for this study. There were 39 additional patients (32 males and 7 females) with area data but no volumetric data. Since the focus of this study is on the volumetric measures, these 39 patients were also excluded reducing the final evaluable cohort to N=668 patients including 539 males (81%) and 129 female (19%).
MRI Methods
Subjects underwent MRI of the abdomen using a 1.5T scanner (Siemens Avanto, Germany) with a body coil. Axial, coronal and sagittal images were acquired with an MR gradient echo pulse sequence. The abdominal compartment was defined as extending from the superior aspect of the xiphoid process to the most inferior slice depicting the L5-S1 interspace. MR images were obtained in 1 cm contiguous intervals (slice thickness of 1 cm) throughout the abdominal compartment. Analysis of the abdominal MR images was performed in the Sleep Imaging Center at the University of Pennsylvania. Using image and volumetric analysis software (Amira 4.1.2, Visage Imaging Inc., San Diego, CA), each slice of the abdominal MRI scan was manually examined. AMIRA has been used previously for volumetric image analysis. 34 Automated thresholding and manual segmentation by the region growing tool were used to segment SAT and VAT volumes from other abdominal anatomy by pixel valuation. Anatomical landmarks were identified and adipose tissue beds were labeled and segmented into either SAT and VAT areas. Inter-muscular adipose tissue was included in VAT analysis. Figure 1 depicts a sample image taken from a subject at the level of the L2-L3 and L4-L5 interspace with the VAT area segmented. The adipose areas from each slice were then summed across the entire abdominal compartment and total SAT and VAT volumes were calculated (see Figures 2 and 3). All MR image analysis was performed by one of two trained technologists, supervised by a physician (RS). The single images at the L2-L3 and L4-L5 interspaces were chosen a priori for comparison with the total VAT volume based upon prior literature, which has historically used these image locations as a surrogate for total VAT volume.18, 21, 26, 27, 29–32, 35
Figure 1.
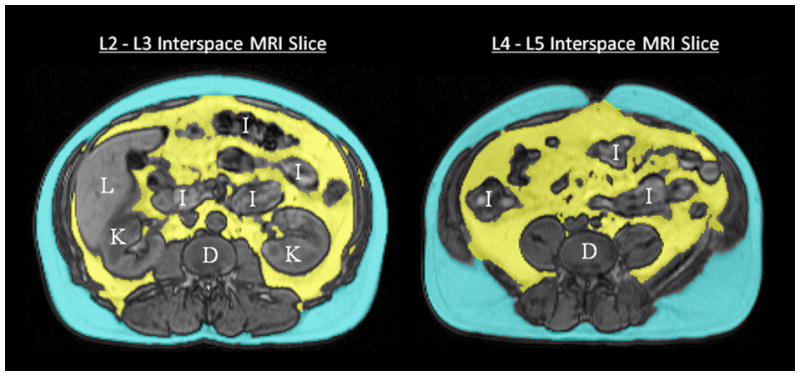
Axial MR images taken at the level of L2–L3 and L4–L5 interspaces, with VAT identified in yellow and SAT in blue. K = kidney, L = liver, I = intestine, D = disc (vertebral).
Figure 2.
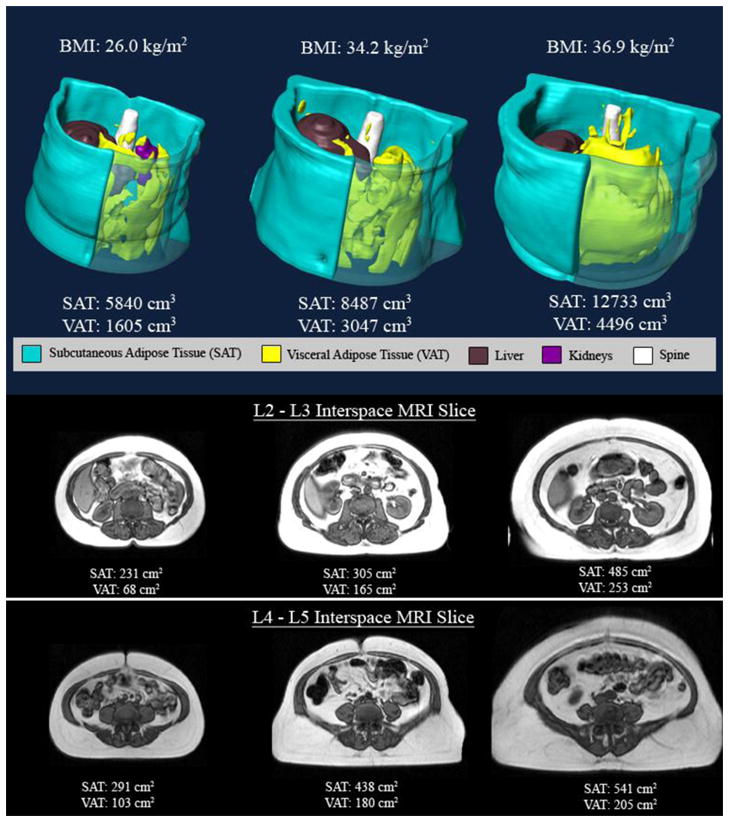
Top panel – three dimensional reconstructions of abdominal fat in three women in the different BMI strata (BMI < 30 kg/m2, BMI between 30 kg/m2 and 35 kg/m2 and BMI > 35 kg/m2) VAT identified in yellow and SAT in blue. Note that there is more VAT and SAT as the BMI categories increase. In the bottom panels axial MR images at the level of L2–L3 and L4–L5 interspaces are depicted in the three different BMI categories. Note again that there is more VAT and SAT as the BMI categories increase.
Figure 3.
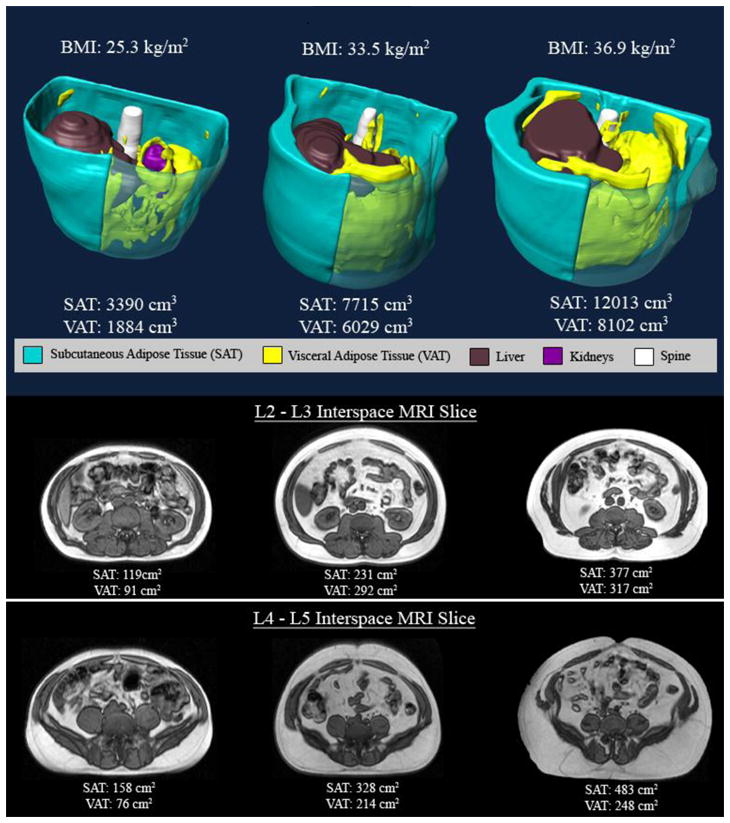
Top panel – three dimensional reconstructions of abdominal fat in three men in the different BMI strata (BMI < 30 kg/m2, BMI between 30 kg/m2 and 35 kg/m2 and BMI > 35 kg/m2) VAT identified in yellow and SAT in blue. Note that there is more VAT and SAT as the BMI categories increase. In the bottom panels axial MR images at the level of L2–L3 and L4–L5 interspaces are depicted in the three different BMI categories. Note again that there is more VAT and SAT as the BMI categories increase.
Statistical Methods
The primary variable for this study was visceral adipose tissue (VAT) area determined through single axial MR images taken at the level of the L2-L3 as well as L4-L5 interspaces (cm2). Total abdominal VAT volume in milliliters as measured by MRI was considered the gold standard reference. Prior to analyses to address the primary hypotheses, measurement reliability was assessed using intraclass correlation coefficients (ICC). Four trained raters determined VAT (and SAT) volume, L2-L3 area and L4-L5 area for MRI’s obtained from 10 randomly selected subjects on two separate occasions approximately one week apart. A random effects analysis of variance (ANOVA) was used to partition total variance into its variance components including among subjects, among raters, subjects by rater interaction, and residual error. The ICC is intended to estimate the proportion of total variance attributable to biological differences among subjects in fat quantity as opposed to various sources of error variance.
Total VAT volume, L2-L3 VAT area, and L4-L5 VAT area were summarized overall and compared by gender through the use of standard effect sizes with 95% confidence intervals (CI) and Wilcoxon rank sum tests. Standardized effect sizes (ES) for gender differences were computed as the gender mean difference divided by within gender pooled standard deviation. ES is an index of the magnitude of group mean differences that can be compared among measures with varying units. A value of 0.5 corresponds to a gender mean difference equal to one-half of one standard deviation. The width of a 95% CI reflects statistical precision of the estimator while the bounds indicate the magnitudes of gender difference statistically consistent with the data observed in this study. The same set of comparisons were made for total subcutaneous adipose tissue (SAT), L2-L3 SAT area, L4-L5 SAT area, and the SAT to VAT ratios. These analyses were performed to determine which, if any, of the two area measurements were able to reliably reflect expected gender differences and so provide support for the validity of the area measurements.
The primary analysis was based on comparing the magnitudes of the correlations between VAT volume and the two single slice areas at L2-L3 and L4-L5. Slice measures and the volume measures were all obtained within the same individual. Therefore, the comparisons between correlation coefficients were made on the basis of bootstrap re-sampling methods36 that accounted for the correlation structure present in the data. These methods were used to determine the statistical significance of the difference as well as non-parametric 95% confidence intervals (CI) for the difference in correlation coefficients. These comparisons were performed initially using data from all subjects. In order to evaluate whether the strength of the linear association was maintained across levels of obesity and for both genders, analyses were stratified by gender and obesity category. Finally, multiple linear regression was used to assess the incremental predictive value of adding other variables to the model including the other VAT area, BMI, gender, age, and waist circumference. All statistical analysis was performed using SAS version 9.2.
RESULTS
Description of sample
Baseline characteristics of the cohort are shown in Table 1. The study cohort consisted of N=539 males with mean age (SD) of 54.1 (10.5) and N=129 females with mean (SD) age 58.8 (9.1) with an overall range across both genders from 21 to 83 years. The gender difference in mean age was significant(Wilcoxon rank sum p<0.0001). Mean (SD) body mass index (BMI) values among males and female were 32.2 (4.6) kg/m2 and 33.8 (6.0) kg/m2 with overall range from 20.0 to 51.2 (p=0.01). Among male subjects, 35.8% had a BMI <30 kg/m2, 37.7% had BMI 30–<35 kg/m2 and 26.5% had a BMI ≥35 kg/m2. In comparison, among female subjects 28.7%, 30.2%, and 41.1%had BMI <30 kg/m2, BMI 30–<35 kg/m2 and ≥35 kg/m2, respectively. The distributions of BMI categories significantly differed between genders (non-parametric p=0.006). Similarly, there were significant gender differences in neck circumference (p<0.0001) and waist circumference (p<0.0001). The mean (SD) neck circumference among males and females were 43.1 (3.0) cm and 38.4 (3.0) cm, respectively. The mean (SD) waist circumference among males and females were 112.3 (12.0) cm and 106.3 (13.6) cm, respectively. Neck circumference had the largest gender effect size with ES=1.60 (95% 1.39 to 1.81). About 73% of subjects had an apnea-hypopnea index (AHI) of 30 events per hour or greater, a level often considered severe; 24% had AHI between 15 and 30 events per hour, a level often considered moderate. Males and females had comparable sleep apnea severity (data not shown).
Table 1.
Age and anthropometric measures. Data are presented as mean (SD) and range along with standardized effect size and nonparametric test for gender differences.
| All N=668 | Males N=539 | Females N=129 | Effect Size1 (95% CI) For comparison between genders | Wilcoxon Rank Sum p-value (between genders) | |
|---|---|---|---|---|---|
| Mean (SD) Range |
Mean (SD) Range |
Mean (SD) Range |
|||
| Age (years) | 55.0 (10.4) 20.9 to 83.2 |
54.1 (10.5) 20.9 to 83.2 |
58.8 (9.1) 33.5 to 78.2 |
−0.46 (−0.66, −0.27) | <0.0001 |
| Body mass index (kg/m2) | 32.5 (4.9) 20.0 to 51.2 |
32.2 (4.6) 20.0 to 44.8 |
33.7 (6.0) 21.4 to 51.2 |
−0.31 (−0.50, −0.11) | 0.01 |
| Neck circumference (cm) | 42.2 (3.5) 31.6 to 53.2 |
43.1 (3.0) 33.5 to 53.2 |
38.5 (3.0) 31.6 to 45.5 |
1.60 (1.39, 1.81) | <0.0001 |
| Waist circumference (cm) | 111.2 (12.5) 73.6 to 150.0 |
112.3 (12.0) 82.1 to 150 |
106.3 (13.6) 73.6 to 140.0 |
0.49 (0.29, 0.68) | <0.0001 |
Effect size (ES) is computed as mean difference divided by the pooled estimated of the standard deviation. Approximate 95% confidence intervals (CI’s) for ES are provided.
Rater reliability (technical measurement error)
Intraclass correlation coefficients(ICC) for VAT volume, L2-L3 VAT area, and L4-L5 VAT area were 0.992, 0.985, and 0.987, respectively. The same values for SAT were 0.991, 0.995, and 0.995, respectively. All values are extremely large indicating essentially ignorable technical variability arising from differences among raters or from rater by subject interaction.
Description of Adiposity
Table 2 provides a summary of adipose tissue characteristics overall and by gender. Data are presented as mean (SD) and range along with standardized effect size and non-parametric test for gender differences. Among N=539 males, mean (SD) total VAT volume was 5583 (2056) mL with range from 365 to 13527. In contrast, among females the mean (SD) was 3345 (1467) with range 390 to 8450 or 40% smaller. This gender difference in means was highly statistically significant (Wilcoxon rank sum p<0.0001) and was associated with a very large standardized effect size (ES=1.14, 95% CI 0.94 to 1.35). Figures 2 and 3 illustrate increased VAT in men compared to BMI matched women.
Table 2.
Summary of MRI Adipose Tissue Characteristics overall and by gender. Data are presented as mean (SD) and range along with standardized effect size and non-parametric test for gender differences.
| All N=668 | Males N=539 | Females N=129 | Effect Size1 (95% CI) for comparison between genders | Wilcoxon Rank Sum p-value (between genders) | |
|---|---|---|---|---|---|
| Mean (SD) Range |
Mean (SD) Range |
Mean (SD) Range |
|||
| Total VAT Volume (in mL) | 5151 (2146) 365 to 13527 |
5583 (2056) 365 to 13527 |
3345 (1467) 390 to 8450 |
1.14 (0.94, 1.35) | <0.0001 |
| L2-L3 VAT Area (in cm2) | 246 (100) 12 to 660 |
265 (97) 12 to 660 |
167 (73) 27 to 358 |
1.06 (0.86, 1.26) | <0.0001 |
| L4-L5 VAT Area (in cm2) | 203 (87) 26 to 562 |
211 (88) 30 to 562 |
168 (72) 26 to 385 |
0.51 (0.31, 0.70) | <0.0001 |
| Total SAT Volume (in mL) | 7959 (3365) 1383 to 21733 |
7592 (3143) 1383 to 21733 |
9494 (3812) 2223 to 21557 |
−0.58 (−0.77, −0.39) | <0.0001 |
| L2-L3 SAT Area (in cm2) | 255 (114) 44 to 803 |
235 (101) 44 to 748 |
337 (129) 95 to 803 |
−0.95 (−1.15, −0.75) | <0.0001 |
| L4-L5 SAT Area (in cm2) | 351 (128) 76 to 888 |
335 (117) 76 to 845 |
417 (151) 123 to 888 |
−0.66 (−0.86, −0.47) | <0.0001 |
| SAT:VAT Ratio (based on volume) | 1.77 (0.98) 0.33 to 7.03 |
1.45 (0.60) 0.33 to 5.07 |
3.10 (1.15) 1.20 to 7.03 |
−2.25 (−2.48, −2.02) | <0.0001 |
| SAT:VAT Ratio (based on L2-L3 area) | 1.24 (0.88) 0.26 to 6.72 |
0.98 (0.55) 0.26 to 6.55 |
2.32 (1.13) 0.90 to 6.72 |
−1.92 (−2.14, −1.71) | <0.0001 |
| SAT:VAT Ratio (based on L4-L5 area) | 2.00 (0.98) 0.40 to 5.70 |
1.82 (0.88) 0.40 to 5.70 |
2.75 (1.02) 0.78 to 5.52 |
−1.03 (−1.23, −0.83) | <0.0001 |
Effect size (ES) is computed as mean difference divided by the pooled estimated of the standard deviation. Approximate 95% confidence intervals (CI’s) for ES are provided.
Table 2 reveals that the magnitude of gender differences is maintained for L2-L3 VAT area (ES=1.06, 95% CI 0.86 to 1.26; p<0.0001). The mean (SD) L2-L3 for males and females were 265 (97) cm2 and 167 (73) cm2, respectively, about 37% smaller in females. In contrast, the effect size for gender differences in visceral abdominal tissue decreases by about 50% when assessed by L4-L5 VAT area. The mean (SD) VAT area at L4-L5 for males and females were 211 (88) cm2 and 168 (72) cm2, respectively, only about 20% smaller. Thus, the gender difference is maintained using L2-L3, but attenuated using L4-L5.
Opposite gender findings were observed for total subcutaneous adipose tissue (SAT). Mean (SD) total SAT volume in men was 7592 (3143), while it was 25% larger among women with mean (SD) equal to 9494 (3812) mL (p<0.0001). The standardized gender difference was ES = −0.58 (95% CI −0.77 to −0.39). The effect size for gender differences in SAT was larger for both L2-L3 (ES = −0.95) and L4-L5 (ES = −0.66) than for volume.
Table 2 also includes a similar gender comparison for the ratio of SAT to VAT. The gender differences are extremely large with mean (SD) values equal to 1.45 (0.60) and 3.10 (1.15), respectively, among males and females, resulting in an extremely large (in absolute value) effect size equal of −2.25 (95% CI −2.48 to −2.02). The large effect size in the SAT to VAT ratio is reasonably maintained by the L2-L3 area with ES=−1.92 (95% CI −2.14 to −1.71), but it is again not maintained using the L4-L5 area, falling by about 50% to ES=−1.03 (95% CI −1.22 to −0.83). Thus, in general, gender differences are more reliably reproduced using the L2-L3 area compared to the L4-L5 area.
Slice Areas as a Predictor of Volume Across Obesity Categories
An important goal of our study was to determine whether the relationship between the amount of fat in a given single image and total VAT volume varied depending on the degree of obesity. Figures 2 and 3 demonstrate progressively more visceral abdominal fat (cross-sectional area and volume) in representative male and female subjects with increasing BMI categories. The large sample size and large range of obesity in the ISAC cohort permitted a stratified correlation analysis. The results of these analyses are presented in Table 3 which lists Pearson correlation coefficients for the linear relationships between the two candidate single slice area predictors and the reference VAT volume in both genders with different degrees of obesity. Spearman rank correlations were very similar in magnitude and so only Pearson correlations are presented. For comparison purposes, Table 3 also provides correlations between VAT volume with waist and neck circumferences, hip ratio and BMI.
Table 3.
Pearson Correlations of VAT Volume with L2-L3 and L4-L5 VAT Area and Common Anthropomorphic Measures For All Subjects and by Gender and BMI Category
| Predictors | All (N=668) | Males (N=539) | Females (N=129) |
|---|---|---|---|
| L2-L3 VAT Area | |||
| All | 0.96*** | 0.95*** | 0.94*** |
| BMI <30 kg/m2 | 0.96*** | 0.95*** | 0.95** |
| BMI 30–35 kg/m2 | 0.94*** | 0.92*** | 0.91* |
| BMI ≥35 kg/m2 | 0.94*** | 0.92*** | 0.92** |
| L4-L5 VAT Area | |||
| All | 0.83 | 0.83 | 0.90 |
| BMI <30 | 0.79 | 0.78 | 0.84 |
| BMI 30–<35 | 0.76 | 0.75 | 0.82 |
| BMI ≥35 | 0.79 | 0.77 | 0.87 |
| Waist Circumference | |||
| All | 0.72 | 0.72 | 0.75 |
| BMI <30 kg/m2 | 0.64 | 0.59 | 0.44 |
| BMI 30–<35 kg/m2 | 0.57 | 0.42 | 0.55 |
| BMI ≥35 kg/m2 | 0.67 | 0.56 | 0.73 |
| Neck Circumference | |||
| All | 0.69 | 0.60 | 0.68 |
| BMI <30 kg/m2 | 0.55 | 0.39 | 0.19 |
| BMI 30–<35 kg/m2 | 0.59 | 0.36 | 0.50 |
| BMI ≥35 kg/m2 | 0.62 | 0.32 | 0.62 |
| Waist to Hip Ratio | |||
| All | 0.69 | 0.62 | 0.54 |
| BMI <30 kg/m2 | 0.63 | 0.55 | 0.34 |
| BMI 30–<35 kg/m2 | 0.61 | 0.43 | 0.62 |
| BMI ≥35 kg/m2 | 0.67 | 0.46 | 0.48 |
| BMI | |||
| All | 0.52 | 0.65 | 0.63 |
An asterisk indicates that the correlation with VAT volume is significantly larger for L2-L3 VAT area compared to L4-L5 area (*** p<0.001, ** p<0.01, * p<0.05) based on a robust bootstrap re-sampling based test that accounted for repeated measures.
The correlation with VAT volume was similar for waist circumference (r=0.72, p<0.0001, N=668), neck circumference (r=0.69, p<0.0001), and for waist to hip ratio (r=0.69, p<0.0001) while being a bit smaller for BMI (r=0.52, p<0.0001). However, BMI associations were much stronger when assessed within each gender separately with r=0.65 and r=0.63 for males and females, respectively.
The correlation between VAT volume and VAT area determined from the L2-L3 slice was extremely large (r=0.96, p<0.001). The correlation between VAT volume and VAT area determined from the L4-L5 slice was also large, but clinically and statistically significantly smaller compared to the L2-L3 slice (r=0.83, p<0.001). The statistical significance of this difference in correlations was evaluated using a robust non-parametric bootstrapping method. A 95% confidence interval for the correlation difference based on 1000 bootstrap simulations was 0.106 to 0.149, with p<0.001. The small width of this interval reflects substantial statistical precision in the estimated (within subject) difference in correlations of 0.13.
We then investigated whether the superior predictive association between L2-L3 area and VAT volume relative to predictions based on L4-L5 area was homogeneous across gender and obesity. In general, all of the correlations with VAT volume reported in Table 3 are larger for the L2-L3 slice compared to the L4-L5 slice to highly statistically significant levels (p<0.002) with the exception of the comparisons involving the women stratified by BMI category. These comparison had more modest levels of statistical significance (p<0.05) due to the smaller sample sizes.
Among all females the difference between correlations using the L2-L3 and L4-L5 areas, while statistically significant, was numerically smaller. The difference in correlations among females was 0.048(95% CI 0.021 to 0.086). In contrast, the difference in correlations among males was 0.118(95% CI 0.094 to 0.144). Since the lower bound for males exceeds the upper bound for females it can be concluded that the reduction in correlations is significantly larger among males than females.
Figure 4 graphically illustrates the stronger linear associations observed for L2-L3 VAT area (top panel) compared to L4-L5 VAT area (bottom panel). The stronger association is seen in the ‘tighter scatter’ of points around an expected value that is well represented by a linear association between VAT volume and L2-L3 VAT area. In contrast, although the bottom panel is also reflective of an approximately linear association, the scatter around expected values based on this linear association is wider and more variable compared with predictions based on L2-L3 VAT area. The next section summarizes linear regression analyses that more precisely demonstrate that the nature of the linear association between L2-L3 VAT area and VAT volume is homogeneous among gender and obesity strata.
Figure 4.

Top frame. Scatter plot of abdominal visceral adipose tissue (VAT) volume (mL) versus L2–L3 visceral adipose tissue (VAT) area(cm2) in males and females. Bottom frame. Scatter plot of abdominal visceral adipose tissue (VAT) volume (mL) versus L4–L5 visceral adipose tissue (VAT) area(cm2) in males and females.
Multiple linear regression analysis
Multiple linear regression was used to explore whether the predictions of total VAT from L2-L3 VAT area could be improved 1) by adding L4-L% area; 2) by allowing the nature of the linear associations between area and volume to vary across the six BMI by gender strata; or 3) by incorporating other relevant information such as waist circumference and higher ordered terms. As Table 3 demonstrates, the overall correlation between L2-L3 VAT area and VAT volume is r=0.96 implying that 92% (R-square=0.92) of the variance in VAT volume is explainable by the L2-L3 VAT area alone.
The estimated regression equation based on L2-L3 VAT area was: E[volume] = 106.1 + 20.5 (SE=0.24) times L2-L3 area (root MSE = 617, R-square=0.917). Adding L4-L5 area to this simple linear regression only increases R-square marginally from 0.917 to 0.926. While statistically significant (p<0.0001), the improvement in predictive value is minimal. In this two-variable model, the squared partial correlations for L2-L3 VAT area and L4-L5 VAR area are 76% and 10%, respectively. Simultaneously, adding waist circumference, BMI, gender, neck circumference, age, and the square of L2-L3 VAT area squared changed R-square negligibly (from 0.917 to 0.929) indicating that taking these factors into account as main effects would also not substantially improve predictive value.
We then examined whether the nature of the linear relationship changed as a function of gender or obesity. To this end, the directions and magnitudes of least squares simple linear regression slopes were compared among strata defined by these variables. Formal significance testing was done by adding appropriately constructed interaction terms to a main effects model including all covariates.
The slope of the simple linear regression of VAT volume on L2-L3 VAT area across all subjects was 20.5 (SE=0.24). For males and females separately these slopes were similar, i.e., 20.2 (SE=0.28) and 19.1 (0.59), respectively. Among the three obesity categories, these slopes were also similar, i.e., 19.6 (0.39) for BMI<30 kg/m2, 20.0 (0.47) for BMI 30–35 kg/m2, and 20.7 (0.52) for BMI >=35 kg/m2, respectively. Among the 6 strata defined simultaneously by gender and obesity category, slope (SE) for males across these obesity categories were 19.1 (0.47), 19.4 (0.58), and 19.5 (0.70); and for females these values were 20.7 (1.17), 15.9 (1.16), and 20.0 (1.20). Among males, the slopes were nearly identical across all 3 categories of BMI. Among females, the middle obesity category had a slope that was somewhat attenuated compared to the others and the interaction of BMI category and L2-L3 was statistically significant (F(2,123)=4.0, p=0.02). An explanation for this finding was not identified. When obesity strata by L2-L3 VAT area interaction was added to a multiple linear regression model that initially included L2-L3 VAT area and all covariates, R-square only increased from 0.929 to 0.931. Therefore, accounting for heterogeneity among strata did not increase the amount of VAT volume variance explained by the model despite its statistical significance among females.
DISCUSSION
Our study is the largest to date examining an obese cohort (with a large range of body mass indices) using complete MR imaging of the abdominal compartment in order to investigate the utility of using a single axial MR image as a surrogate for the total VAT volume. Compared to known normative values for adipose tissue volumes from prior published studies (see Frayn for review),37 the normal range for VAT volume is 2000 to 4000 mL in males and 1500 to 2000 mL in females, across races in healthy relatively non-obese individuals (BMI <30 kg/m2). Similarly, the normal range for subcutaneous adipose tissue (SAT) is 3000 to 5000 mL in males and 3000 to 6000 mL in females. Both in males and females in our study, the observed mean values displayed in Table 2 are above the maximum of these reported ranges, consistent with our study population’s obesity. Based on all of these analyses, it is concluded that the predictive value of L2-L3 VAT area for VAT volume is excellent for either clinical or research purposes, and that the underlying predictive relationship is stable across genders and levels of obesity. Furthermore, the predictive value of the L2-L3 VAT area is superior to that of L4-L5 area.
Our results demonstrate that a single axial MR image of the abdomen can capture almost all of the variance in total VAT volume across all degrees of obesity in both men and women. This relationship is demonstrated even in the most obese subjects (with BMI >35 kg/m2), in whom very little about this relationship was known previously. Moreover, single MR images performed much better in capturing the variance of total VAT than anthropometric variables such as BMI and neck and waist circumference in both men and women, across all degrees of obesity. However, we have found a significant difference as to which single slice image is better in serving as a surrogate for the total VAT volume. The VAT area at the L2-L3 interspace is significantly better correlated with total VAT volume as compared with the single image at L4-L5 (p<0.001), based on a robust bootstrap approach designed to account for the lack of independence between the correlations being compared. These findings are in contrast with earlier work, which utilized the L4-L5 interspace as a surrogate for total VAT volume.18, 19, 30, 35, 38 We find that even in the most obese subjects, the L2-L3 interspace is superior to the L4-L5 interspace in capturing more of the variance in the total VAT volume. This confirms the findings of Shen28 and Demerath27, who both found that single slice images more cranial than L4-L5, specifically at or near the L2-L3 interspace, were a better approximation of the total VAT volume. However, both these studies were conducted primarily in thinner subjects (with mean BMI of approximately 27 kg/m2 for both studies).
In our cohort VAT assessments based on L2-L3 VAT area predicted total VAT volume extremely well; and considerably better than L4-L5 VAT area. Furthermore, the linear association between L2-L3 VAT area and VAT volume is well maintained over all BMI strata in both genders. The magnitudes of the correlations between L4-L5 VAT area and VAT volume were roughly halfway between those for the L2-L3 VAT area and simple waist circumference measurements. We have also found that that the linear association between L2-L3 VAT area and total VAT volume is similar for males and females. In contrast, the reduction in the correlation between VAT volume and slice area using L4-L5 instead of L2-L3 was especially large for males (reduction in r of 0.118, 95% CI 0.094 to 0.144). In contrast, the estimated reduction in the correlation among females was only 0.048 (95% 0.021 to 0.086). The ratio of subcutaneous adipose tissue to visceral tissue was computed within gender. The ratios of SAT volume to VAT volume has been found to be approximately 1 in males and 2–3 in females.37 The ratios of VAT to SAT volumes in the ISAC cohort in the males and females were close to these values. The ratios in males and females were also similar when based on the L2-L3 VAT and L2-L3 SAT areas. However, especially, among men, the ratio of SAT to VAT is distorted when based on L4-L5 VAT and SAT area (ratio = 1.82).
It is interesting to speculate on why the L2-L3 slice is more representative of VAT in men as compared to women. One possible explanation is that men carry more of their abdominal VAT higher in the abdomen (toward L2-L3) whereas women carry more of their abdominal VAT lower in the abdomen (toward L4-L5), thus making the L2-L3 slice more representative total VAT in men compared to women. Such differences in the anatomical distribution of VAT over the abdomen in men and women have been published previously.30
As hypothesized, waist circumference did not perform as well as VAT area in predicting VAT volume, even in women. This contradicts findings of some authors which note equivalency of anthropometric measures as compared with abdominal imaging methods.39 This is an important finding since direct measurement of VAT may indeed be superior to anthropometric measures in prediction of key cardiovascular and metabolic outcomes, as shown by Fox, et al, using the Framingham cohort data.5
There are several key strengths of our study. It is a large, well powered study that utilized statistically robust methods of comparing differences in correlation. In addition, this is the largest cohort published to date to address this question in a cohort that incudes morbidly obese individuals. Among those with BMI ≥35 kg/m2, there were 193 subjects with a mean BMI of 38.6 kg/m2. Our MRI protocol included complete imaging of the entire abdominal cavity and very precise and highly reproducible calculations of VAT and SAT areas and volumes. We also directly compared single axial MR slices at two distinct anatomic locations that were defined a priori. Previous protocols27, 28 were more exploratory in nature and did not define a priori which anatomic slice levels they would be directly comparing. Other methods for measuring abdominal fat (dual energy absorptimetry – DXA scanning) are unable to differentiate between subcutaneous and visceral abdominal fat.40
Nonetheless, our study also had some limitations, including its cross-sectional nature. These measurements were taken at a single time point and therefore the effects of time and weight change cannot be assessed. In addition, while we had a large number of subjects, only 19% (N=129) were women. This is due to the parent study being directed at the study of obstructive sleep apnea, a disease with a higher prevalence in males. However, despite this lower percentage of women, the difference in correlation with VAT between L2-L3 vs. L4-L5 remained statistically significant in women. That the study is only in subjects with obstructive sleep apnea may also be an issue when one considers its generalizability. Our study cohort consisted of subjects recruited in Iceland, which is a relatively homogenous population of European descent. Therefore, effects of race and ethnicity could not be assessed in detail. In our study, the superior aspect of the xiphoid process was used to determine the superior aspect of visceral abdominal fat. This is in contrast to using the dome of the liver which has been a standard landmark for use in determining the superior aspect of visceral abdominal fat. We chose to use the xiphoid process because the liver is a soft tissue border which can change based on the amount of fat in the liver or fluid overload. In contrast, the superior aspect of the xiphoid process is a bony landmark that is not be influenced by fat or congestion of the liver. In a randomly selected sample of 20 subjects (10 M, 10 F) from this study, the mean (SD) percent difference in VAT computed using the dome of the liver instead of the xiphoid process was 1.4% (SD=1.8%). Almost all of the adipose tissue found between these slices was epicardial fat. Thus, we do not find large differences in VAT based on using the dome of the liver or superior aspect of the xiphoid process as the superior boundary in this study population. Our measure of VAT included intermuscular fat deposition (IMAT). Although IMAT is potentially of large volume when assessing whole body intermuscular fat, it does not appear to contribute greatly to VAT restricted to the abdomen. In the sample randomly selected sample of 20 subjects, IMAT represented, on average, only 3.6% (SD=2.5%) of abdominal VAT. Finally, the study sample is not representative of all overweight and obese individuals. Because central adiposity is a risk factor for apnea, it is likely that our sample had higher VAT and/or SAT relative to total body fat than would be the case in an unselected group of overweight and obese individuals of similar BMI. Thus our results are not generalizable to all obese individuals.
CONCLUSION
In this large cohort of subjects that included many overweight and obese individuals, it was found that VAT area based on a single axial MR image is highly correlated with VAT volume across all levels of obesity and in both genders and is an accurate surrogate for the total VAT volume. Of the two axial images used in our comparisons, VAT area at L2-L3 was significantly better correlated with total VAT volume and explained a greater amount of the total variance compared to L4-L5. The linear association between VAT volume and L2-L3 VAT area was preserved across all levels of obesity and in both males and females. Future cohort studies that intend to utilize VAT area as a surrogate for the total VAT volume should use an axial MR image at the level of L2-L3.
Acknowledgments
Funding Support: This work was supported by NIH grants HL070267 and HL094307.
We thank Jennifer Montoya and Daniel C. Barrett for help in manuscript preparation, Kristján Andri Kristjánsson for management of the Icelandic clinical data, and to Robert Hachadoorian and Nick Jackson for their contributions in development and management of the ISAC clinical data and analysis system.
Footnotes
None of these individuals report conflicts of interest for this study.
References
- 1.Ogden CL, Carroll MD, Curtin LR, McDowell MA, Tabak CJ, Flegal KM. Prevalence of overweight and obesity in the United States, 1999–2004. JAMA. 2006;295(13):1549–55. doi: 10.1001/jama.295.13.1549. [DOI] [PubMed] [Google Scholar]
- 2.Flegal KM, Carroll MD, Ogden CL, Johnson CL. Prevalence and trends in obesity among US adults, 1999–2000. JAMA. 2002;288(14):1723–7. doi: 10.1001/jama.288.14.1723. [DOI] [PubMed] [Google Scholar]
- 3.Sturm R. Increases in morbid obesity in the USA: 2000–2005. Public health. 2007;121(7):492–6. doi: 10.1016/j.puhe.2007.01.006. [DOI] [PMC free article] [PubMed] [Google Scholar]
- 4.Pack AI, Gislason T. Obstructive sleep apnea and cardiovascular disease: a perspective and future directions. Prog Cardiovasc Dis. 2009;51(5):434–51. doi: 10.1016/j.pcad.2009.01.002. [DOI] [PubMed] [Google Scholar]
- 5.Fox CS, Massaro JM, Hoffmann U, Pou KM, Maurovich-Horvat P, Liu CY, et al. Abdominal visceral and subcutaneous adipose tissue compartments: association with metabolic risk factors in the Framingham Heart Study. Circulation. 2007;116(1):39–48. doi: 10.1161/CIRCULATIONAHA.106.675355. [DOI] [PubMed] [Google Scholar]
- 6.Klein S, Allison DB, Heymsfield SB, Kelley DE, Leibel RL, Nonas C, et al. Waist circumference and cardiometabolic risk: a consensus statement from shaping America’s health: Association for Weight Management and Obesity Prevention; NAASO, the Obesity Society; the American Society for Nutrition; and the American Diabetes Association. Diabetes Care. 2007;30(6):1647–52. doi: 10.2337/dc07-9921. [DOI] [PubMed] [Google Scholar]
- 7.Cassano PA, Segal MR, Vokonas PS, Weiss ST. Body fat distribution, blood pressure, and hypertension. A prospective cohort study of men in the normative aging study. Ann Epidemiol. 1990;1(1):33–48. doi: 10.1016/1047-2797(90)90017-m. [DOI] [PubMed] [Google Scholar]
- 8.Poirier P, Despres JP. Waist circumference, visceral obesity, and cardiovascular risk. J Cardiopulm Rehabil. 2003;23(3):161–9. doi: 10.1097/00008483-200305000-00001. [DOI] [PubMed] [Google Scholar]
- 9.Alam I, Lewis K, Stephens JW, Baxter JN. Obesity, metabolic syndrome and sleep apnoea: all pro-inflammatory states. Obes Rev. 2007;8(2):119–27. doi: 10.1111/j.1467-789X.2006.00269.x. [DOI] [PubMed] [Google Scholar]
- 10.Vgontzas AN, Papanicolaou DA, Bixler EO, Hopper K, Lotsikas A, Lin HM, et al. Sleep apnea and daytime sleepiness and fatigue: relation to visceral obesity, insulin resistance, and hypercytokinemia. The Journal of clinical endocrinology and metabolism. 2000;85(3):1151–8. doi: 10.1210/jcem.85.3.6484. [DOI] [PubMed] [Google Scholar]
- 11.Schafer H, Pauleit D, Sudhop T, Gouni-Berthold I, Ewig S, Berthold HK. Body fat distribution, serum leptin, and cardiovascular risk factors in men with obstructive sleep apnea. Chest. 2002;122(3):829–39. doi: 10.1378/chest.122.3.829. [DOI] [PubMed] [Google Scholar]
- 12.de Sousa AG, Cercato C, Mancini MC, Halpern A. Obesity and obstructive sleep apnea-hypopnea syndrome. Obes Rev. 2008;9(4):340–54. doi: 10.1111/j.1467-789X.2008.00478.x. [DOI] [PubMed] [Google Scholar]
- 13.Kuk JL, Katzmarzyk PT, Nichaman MZ, Church TS, Blair SN, Ross R. Visceral fat is an independent predictor of all-cause mortality in men. Obesity (Silver Spring, Md. 2006;14(2):336–41. doi: 10.1038/oby.2006.43. [DOI] [PubMed] [Google Scholar]
- 14.Kabir M, Catalano KJ, Ananthnarayan S, Kim SP, Van Citters GW, Dea MK, et al. Molecular evidence supporting the portal theory: a causative link between visceral adiposity and hepatic insulin resistance. American journal of physiology. 2005;288(2):E454–61. doi: 10.1152/ajpendo.00203.2004. [DOI] [PubMed] [Google Scholar]
- 15.Bergman RN, Kim SP, Catalano KJ, Hsu IR, Chiu JD, Kabir M, et al. Why visceral fat is bad: mechanisms of the metabolic syndrome. Obesity (Silver Spring, Md. 2006;14 (Suppl 1):16S–19S. doi: 10.1038/oby.2006.277. [DOI] [PubMed] [Google Scholar]
- 16.Jensen MD. Role of body fat distribution and the metabolic complications of obesity. The Journal of clinical endocrinology and metabolism. 2008;93(11 Suppl 1):S57–63. doi: 10.1210/jc.2008-1585. [DOI] [PMC free article] [PubMed] [Google Scholar]
- 17.Kuk JL, Lee S, Heymsfield SB, Ross R. Waist circumference and abdominal adipose tissue distribution: influence of age and sex. The American journal of clinical nutrition. 2005;81(6):1330–4. doi: 10.1093/ajcn/81.6.1330. [DOI] [PubMed] [Google Scholar]
- 18.Ross R, Leger L, Morris D, de Guise J, Guardo R. Quantification of adipose tissue by MRI: relationship with anthropometric variables. J Appl Physiol. 1992;72 (2):787–95. doi: 10.1152/jappl.1992.72.2.787. [DOI] [PubMed] [Google Scholar]
- 19.Ross R, Shaw KD, Martel Y, de Guise J, Avruch L. Adipose tissue distribution measured by magnetic resonance imaging in obese women. The American journal of clinical nutrition. 1993;57(4):470–5. doi: 10.1093/ajcn/57.4.470. [DOI] [PubMed] [Google Scholar]
- 20.Ross R, Shaw KD, Rissanen J, Martel Y, de Guise J, Avruch L. Sex differences in lean and adipose tissue distribution by magnetic resonance imaging: anthropometric relationships. The American journal of clinical nutrition. 1994;59 (6):1277–85. doi: 10.1093/ajcn/59.6.1277. [DOI] [PubMed] [Google Scholar]
- 21.Gray DS, Fujioka K, Colletti PM, Kim H, Devine W, Cuyegkeng T, et al. Magnetic-resonance imaging used for determining fat distribution in obesity and diabetes. The American journal of clinical nutrition. 1991;54(4):623–7. doi: 10.1093/ajcn/54.4.623. [DOI] [PubMed] [Google Scholar]
- 22.Ross R. Magnetic resonance imaging provides new insights into the characterization of adipose and lean tissue distribution. Canadian journal of physiology and pharmacology. 1996;74(6):778–85. [PubMed] [Google Scholar]
- 23.Gomi T, Kawawa Y, Nagamoto M, Terada H, Kohda E. Measurement of visceral fat/subcutaneous fat ratio by 0. 3 tesla MRI. Radiation medicine. 2005;23(8):584–7. [PubMed] [Google Scholar]
- 24.Mitsiopoulos N, Baumgartner RN, Heymsfield SB, Lyons W, Gallagher D, Ross R. Cadaver validation of skeletal muscle measurement by magnetic resonance imaging and computerized tomography. J Appl Physiol. 1998;85(1):115–22. doi: 10.1152/jappl.1998.85.1.115. [DOI] [PubMed] [Google Scholar]
- 25.Abate N, Burns D, Peshock RM, Garg A, Grundy SM. Estimation of adipose tissue mass by magnetic resonance imaging: validation against dissection in human cadavers. Journal of lipid research. 1994;35(8):1490–6. [PubMed] [Google Scholar]
- 26.Han TS, Kelly IE, Walsh K, Greene RM, Lean ME. Relationship between volumes and areas from single transverse scans of intra-abdominal fat measured by magnetic resonance imaging. Int J Obes Relat Metab Disord. 1997;21(12):1161–6. doi: 10.1038/sj.ijo.0800530. [DOI] [PubMed] [Google Scholar]
- 27.Demerath EW, Shen W, Lee M, Choh AC, Czerwinski SA, Siervogel RM, et al. Approximation of total visceral adipose tissue with a single magnetic resonance image. The American journal of clinical nutrition. 2007;85(2):362–8. doi: 10.1093/ajcn/85.2.362. [DOI] [PMC free article] [PubMed] [Google Scholar]
- 28.Shen W, Punyanitya M, Wang Z, Gallagher D, St-Onge MP, Albu J, et al. Visceral adipose tissue: relations between single-slice areas and total volume. The American journal of clinical nutrition. 2004;80(2):271–8. doi: 10.1093/ajcn/80.2.271. [DOI] [PMC free article] [PubMed] [Google Scholar]
- 29.Shen W, Punyanitya M, Wang Z, Gallagher D, St-Onge MP, Albu J, et al. Total body skeletal muscle and adipose tissue volumes: estimation from a single abdominal cross-sectional image. J Appl Physiol. 2004;97(6):2333–8. doi: 10.1152/japplphysiol.00744.2004. [DOI] [PubMed] [Google Scholar]
- 30.Demerath EW, Sun SS, Rogers N, Lee M, Reed D, Choh AC, et al. Anatomical patterning of visceral adipose tissue: race, sex, and age variation. Obesity (Silver Spring, Md. 2007;15(12):2984–93. doi: 10.1038/oby.2007.356. [DOI] [PMC free article] [PubMed] [Google Scholar]
- 31.Thomas EL, Bell JD. Influence of undersampling on magnetic resonance imaging measurements of intra-abdominal adipose tissue. Int J Obes Relat Metab Disord. 2003;27(2):211–8. doi: 10.1038/sj.ijo.802229. [DOI] [PubMed] [Google Scholar]
- 32.Greenfield JR, Samaras K, Chisholm DJ, Campbell LV. Regional intra-subject variability in abdominal adiposity limits usefulness of computed tomography. Obesity research. 2002;10(4):260–5. doi: 10.1038/oby.2002.35. [DOI] [PubMed] [Google Scholar]
- 33.Sumner AE, Farmer NM, Tulloch-Reid MK, Sebring NG, Yanovski JA, Reynolds JC, et al. Sex differences in visceral adipose tissue volume among African Americans. The American journal of clinical nutrition. 2002;76(5):975–9. doi: 10.1093/ajcn/76.5.975. [DOI] [PubMed] [Google Scholar]
- 34.Lindemann J, Tsakiropoulou E, Vital V, Keck T, Leiacker R, Pauls S, et al. Influence of the turbinate volumes as measured by magnetic resonance imaging on nasal air conditioning. Am J Rhinol Allergy. 2009;23(3):250–4. doi: 10.2500/ajra.2009.23.3309. [DOI] [PubMed] [Google Scholar]
- 35.Valsamakis G, Chetty R, Anwar A, Banerjee AK, Barnett A, Kumar S. Association of simple anthropometric measures of obesity with visceral fat and the metabolic syndrome in male Caucasian and Indo-Asian subjects. Diabet Med. 2004;21(12):1339–45. doi: 10.1111/j.1464-5491.2004.01361.x. [DOI] [PubMed] [Google Scholar]
- 36.Efron B, Tibshirani R. Boostrap methods for standard errors, confidence intervals and other measures of statistical accuracy. Statistical Science. 1986;1(1):54–75. [Google Scholar]
- 37.Frayn KN. Visceral fat and insulin resistance--causative or correlative? The British journal of nutrition. 2000;83 (Suppl 1):S71–7. doi: 10.1017/s0007114500000982. [DOI] [PubMed] [Google Scholar]
- 38.Abate N, Garg A, Coleman R, Grundy SM, Peshock RM. Prediction of total subcutaneous abdominal, intraperitoneal, and retroperitoneal adipose tissue masses in men by a single axial magnetic resonance imaging slice. The American journal of clinical nutrition. 1997;65(2):403–8. doi: 10.1093/ajcn/65.2.403. [DOI] [PubMed] [Google Scholar]
- 39.Scherzer R, Shen W, Bacchetti P, Kotler D, Lewis CE, Shlipak MG, et al. Simple anthropometric measures correlate with metabolic risk indicators as strongly as magnetic resonance imaging-measured adipose tissue depots in both HIV-infected and control subjects. The American journal of clinical nutrition. 2008;87(6):1809–17. doi: 10.1093/ajcn/87.6.1809. [DOI] [PMC free article] [PubMed] [Google Scholar]
- 40.Simpson L, Mukherjee S, Cooper MN, Ward KL, Lee JD, Fedson AC, et al. Sex differences in the association of regional fat distribution with the severity of obstructive sleep apnea. Sleep. 2010;33(4):467–74. doi: 10.1093/sleep/33.4.467. [DOI] [PMC free article] [PubMed] [Google Scholar]