

Abstract
This study is the first to demonstrate that shizukaol D, a natural compound isolated from Chloranthus japonicus , can activate AMP- activated protein kinase (AMPK), a key sensor and regulator of intracellular energy metabolism, leading to a decrease in triglyceride and cholesterol levels in HepG2 cells. Furthermore, we found that shizukaol D induces mitochondrial dysfunction by depolarizing the mitochondrial membrane and suppressing energy production, which may result in AMPK activation. Our results provide a possible link between mitochondrial dysfunction and AMPK activation and suggest that shizukaol D might be used to treat metabolic syndrome.
Introduction
AMPK is an efficient sensor of cellular energy states and is a downstream target of many kinases [1–3]. It is activated in response to a variety of metabolic stresses such as hypoxia and nutrient deprivation [4–7]. Once AMPK is activated, it orchestrates a variety of metabolic processes to increase ATP production and to decrease ATP consumption [8–10]. AMPK activation results in the phosphorylation of acetyl-CoA carboxylase (ACC), a direct AMPK substrate, at Ser 79 [11–13], leading to decreased conversion from acetyl-CoA to malonyl-CoA, which is important for fatty acid synthesis [14,15]. AMPK activation also results in the phosphorylation and activation of malonyl-CoA decarboxylase (MCD), which leads to a further decrease in malonyl-CoA levels [16,17]. Malonyl-CoA inhibits carnitine-palmitoyl-CoA transferase 1 (CPT 1), an enzyme responsible for transporting long-chain fatty acids into mitochondria to be oxidized [17,18]. Overall, AMPK activation decreases fatty acid synthesis and induces fatty acid oxidation, leading to decreased lipid accumulation in vitro and in vivo [8,19].
A number of anti-diabetic drugs such as metformin and the thiazolidinediones (TZDs) regulate AMPK activity [20,21]. Metformin increases AMPK phosphorylation and mediates fatty acid oxidation and synthesis [22,23]. Thiazolidinediones increase the cellular AMP/ATP ratio, which leads to AMPK activation [24,25]. In addition, several natural products with reported anti-obesity or anti-diabetes properties also affect AMPK activation. For example, arctigenin activates AMPK via the inhibition of mitochondria complex I and ameliorates metabolic disorders in ob/ob mice [26], and the small molecule A-769662 activates AMPK and ameliorates metabolic syndrome in ob/ob mice [27].
Given the importance of AMPK in metabolic disorders [8,14], we conducted a systematical analysis for AMPK activation in HepG2 cells treated with natural compounds isolated from Chloranthus japonicus . Chloranthus japonicus (Chloranthaceae) is widely used in traditional Chinese medicine for the treatment of traumatic injuries, rheumatic arthralgia, bone fractures, pulmonary tuberculosis, and neurasthenia [28,29]. The main chemical components of this plant are sesquiterpenoid dimers and trimers [30–32]. Lindenane sesquiterpenoids and disesquiterpenoids are chemotaxonomic characteristics of Chloranthus species. These terpenoids are derived from the enzymatic Diels-Alder cycloaddition of two lindenane-type sesquiterpenoids forming C-15-C-9' and C-6-C-8' linkages based on the cis and endo rules. This class of highly complex compounds exhibits a wide spectrum of biological activities. The disesquiterpenoids shizukaol B, shizukaol F, and cycloshizukaol A inhibit the expression of cell adhesion molecules [33], and shizukaol B, shizukaol C, shizukaol F, and shizukaol H exhibit anti-HIV activity [34]. In addition, shizukaol D shows significant anti-inflammatory activity [35].
Our results show that shizukaol D, which has not been previously shown to have metabolic activities, activates AMPK and reduces the lipid content in HepG2 cells via an AMPK-dependent mechanism. We further show that the activation of AMPK by shizukaol D may be caused by mitochondrial dysfunction.
Materials and Methods
Materials
1, 1-dimethylbiguanide (metformin); 5-aminoimidazole-4-carboxamide-1-D-ribofurano-side (AICAR); 5,5’, 6,6’-tetrachloro-1; 1’, 3,3’-tetraethyl-imidacarbocyanine iodide (JC-1); carbonyl cyanide m-chlorophenylhydrazone (CCCP); rosiglitazone; adenosine 5’-triphosphate (ATP) disodium salt hydrate; adenosine 5’-diphosphate sodium salt (ADP); 8-bromoadenosine 3’,5’-cyclic monophosphate (AMP); the mitochondria isolation kit for profiling cultured cells; Free Glycerol Reagent; and Triglyceride Reagent were purchased from Sigma Aldrich (St. Louis, MO, USA). 6-(4-(2-piperidin-1-ylethoxy) phenyl)-3-pyridin-4-ylpyrazolo (1, 5-a) pyrimidine (compound C) was purchased from Merck Millipore (Darmstadt, Germany). LabAssay Triglyceride and LabAssay Cholesterol kits were purchased from Wako, Japan. Antibodies against AMPKa, AMPKa1, phospho-AMPKa (Thr172), Acetyl-CoA Carboxylase (ACC), phospho-ACC (Ser79) were purchased from Cell Signaling Technology (Beverly, MA, USA). AMPKa1 siRNA and RNiMAX were purchased from Ambion, Life Technologies (NY, USA). Free fatty acids quantification kit was purchased from Biovision (CA, USA). The RIPA buffer, Bradford protein assay kit, and MTT cell proliferation and cytotoxicity assay kit were obtained from the Beyotime Institute of Biotechnology (JiangSu, China). The lactate assay kit was obtained from the Nanjing Jiancheng Bioengineering Institute (JiangSu, China).
Shizukaol D Preparation and Structural Identification
Chloranthus japonicus is widely distributed in eastern Asia, including mainland China, Korea, and Japan, and is not an endangered or protected species in China. Furthermore, this plant is used in traditional medicine to treat traumatic injuries, rheumatic arthralgia, fractures, pulmonary tuberculosis, and neurasthenia. The plant materials in our experiment were purchased from the Chinese medicinal material market in Panshi, Jilin Province, China. The air-dried and powdered Chloranthus japonicus plants (10 kg) were extracted three times with 95% EtOH (3 × 40 L) under reflux conditions. The filtrate was evaporated under reduced pressure, yielding a residue (740 g) that was dissolved in H2O and extracted with AcOEt and then n-BuOH. The AcOEt extract (380 g) was passed through a MCI gel CHP20P column and eluted with a MeOH-H2O gradient (3:7 → 5:5 → 7:3 → 1: 0). The 70% MeOH fraction (110 g) was subjected to chromatography over a silica gel column (CHCl3-MeOH, 100:1 → 80:1 → 60:1 → 40:1) to yield six fractions, A-F. Fraction C (20 g) was separated on an Rp-18 column and eluted with a MeOH-H2O gradient (35%, 40%, 45%, 50%, and 55%) to obtain eight fractions, C1–C8. Fraction C7 was separated by silica gel column chromatography (CHCl3-MeOH, 100:1 → 80:1 → 60:1) and then purified on a Sephadex LH-20 (MeOH) column to yield shizukaol D (20 mg; yield: 0.0002%; purity > 98%). The structure of the purified shizukaol D was confirmed by electron spray mass spectrometry (ESIMS) and 1H and 13C-NMR spectrometry: ESI-MS m/z: 601 [M+Na]+ (C33H38O9) (Table 1).
Table 1. NMR data for shizukaol D.
| Position | δH | δC | Position | δH | δC |
|---|---|---|---|---|---|
| 1 | 2.06 (m) | 25.6 (d) | 3' | 1.10 (m) | 21.7 (d) |
| 2α | 1.0 (m) | 15.8 (t) | 4' | 1.58 (dd, J = 13.4, 5.6 Hz) | 42.9 (d) |
| 2β | 0.30 (m) | 5' | 1.83 (m) | 59.1 (d) | |
| 3 | 1.86 (m) | 24.7 (d) | 6'α | 2.45 (m) | 25.0 (t) |
| 4 | 142.4 (s) | 6'β | 2.47 (m) | ||
| 5 | 131.6 (s) | 7' | 168.6 (s) | ||
| 6 | 3.91 (d, J = 3.5 Hz) | 40.6 (d) | 8' | 93.3 (s) | |
| 7 | 131.6 (s) | 9' | 1.92 (dd, J = 5.9, 1.5 Hz) | 54.5 (d) | |
| 8 | 200.6 (s) | 10' | 44.0 (s) | ||
| 9 | 4.06 (s) | 79.9 (d) | 11' | 126.6 (s) | |
| 10 | 51.0 (s) | 12' | 172.4 (s) | ||
| 11 | 147.1 (s) | 13'α | 4.33 (d, J = 13.6 Hz) | 54.9 (t) | |
| 12 | 171.0 (s) | 13'β | 4.39 (d, J = 13.6 Hz | ||
| 13 | 1.90 (s) | 20.5 (q) | 14' | 0.66 (s) | 24.0 (q) |
| 14 | 1.02 (s) | 15.3 (q) | 15'α | 3.78 (dd, J = 11.5, 8.3 Hz) | 66.2 (t) |
| 15α | 2.77 (dd, J = 16.2, 1.5 Hz) | 25.5 (t) | 15'β | 3.98 (dd, J = 11.5, 6.5 Hz) | |
| 15β | 2.61 (m) | CH3CO | 2.08 (s) | 20.8 (q) | |
| 1' | 1.45 (m) | 24.3 (d) | CH3CO | 171.1 (s) | |
| 2'α | 0.77 (m) | 16.6 (t) | OMe | 3.79 (s) | 52.7 (q) |
| 2'β | 0.83 (m) |
Cell culture
HepG2 cells (American Type Culture Collection, Manassas, VA, USA) were cultured in Dulbecco’s modified Eagle medium (DMEM) (GIBCO, Life Technologies, NY, USA) supplemented with 10% FBS, 5.5 mM glucose, and 100 units/mL penicillin and streptomycin at 37° C in 5% CO2.
Determination of triglyceride and cholesterol content
HepG2 cells cultured in 100-mm dishes and grown to 80% confluence were cultured in serum-free medium overnight and then incubated with medium containing either normal or high glucose in the absence or presence of shizukaol D (or metformin) for the indicated times. The treated cells were lysed in RIPA buffer on ice for 45 min. The triglyceride and cholesterol content of the cell lysates were determined using a colorimetric assay kit from Sigma Aldrich and Wako as described previously [8,14].
Transfection with small interfering RNAs
HepG2 cells were transfected with small interfering RNAs (siRNAs) (AMPKa1: 5’-GGAUCCAUCAUAUAGUUCAtt-3’, 5’-CGGGAUCAGUUAGCAACUAtt-3’) using RNiMAX (Invitrogen, Life Technologies, NY, USA). Before transfection, the medium was changed to antibiotic-free DMEM. After 24 hours of transfection, shizukaol D or metformin was added. The cells were then lysed for further analysis.
Western blotting analysis
The cells were harvested and lysed in loading buffer. To measure the total protein concentration by Lowry method [36], the cellular proteins of the cell lysates were precipitated by using 25% TCA; and then re-dissolved in a buffer containing 2% NaOH and 0.1% SDS. Equal amounts of the protein samples (25 µg) were subjected to 8% SDS-PAGE and transferred to polyvinylidene difluoride membranes (Millipore, Bedford, MA, USA). The membranes were then blotted with primary antibodies against AMPKa, phosphor-AMPKa (Thr 172), acetyl-CoA carboxylase (ACC), phosphor-ACC (Ser 79), and beta-actin. Followed by incubation with the secondary antibody (goat anti-rabbit IgG-HRP, Santa Cruz Biotechnology, USA), the proteins were detected using a FUJIFLIM western blotting detection system (LAS-4000, FUJIFLIM, Japan) and quantified by densitometry (FUJIFLIM Multi Gauge Version 3.0).
Mitochondrial membrane potential assay
The mitochondrial membrane potential assay was performed as described previously [14,26]. Briefly, HepG2 cells were seeded into black 96-well optical-bottom plates (Corning, Costar, USA). The cells were incubated with shizukaol D or CCCP at 37° C for 10 min, and then 100 µl of fresh medium containing 0.2 µg JC-1 was added to each well. The plates were incubated at 37° C for another 20 min, followed by washing three times with 200 µl of Krebs-Ringer phosphate HEPES buffer. The fluorescence was measured at 530 nm/580 nm (red) excitation and emission (ex/em) wavelengths and then at 485 nm/530 nm (green) ex/em wavelengths. The ratio of red to green fluorescence reflects the mitochondrial membrane potential (△ψm).
Adenine nucleotide extraction and measurement
HepG2 cells were cultured in 60-mm dishes with shizukaol D or CCCP for the indicated period of time. The samples for cellular adenine nucleotide measurement were prepared and analyzed as previously described [37,38]. Briefly, the cells were washed with PBS buffer (140 mM NaCl, 2.7 mM KCl, 10 mM Na2 HPO4, 1.8 mM KH2PO4) and trypsinized. Next, the cells were suspended in 4% (vol/vol) perchloric acid and incubated on ice for 30 min. The pH of the lysates was adjusted to between 6 and 8 with 2 mol/L KOH and 0.3 mol/L MOPS. The precipitated salt was separated from the liquid phase by centrifugation at 13200 rpm at 4° C for 15 min. Adenine nucleotide measurements were conducted by HPLC (Agilent 1200 series) using a C18 column. The flow rate was 1.0 mL/min. The order of eluted nucleotides was ATP, ADP, and AMP. Standards (7.5 µM ATP, ADP, and AMP in ddH2O) were used to quantify the samples. The HPLC buffer contained 20 mM KH2PO4 and 3.5 mM K2HPO4 3H2O at pH 6.1.
Isolation of mitochondria from HepG2 cells
We isolated the mitochondria from HepG2 cells using a kit from Sigma Aldrich. 10 × 150 mm dish of cultured HepG2 cells was trypsinized, and the cells were centrifuged at 600 ×g for 5 min. The cells were then washed twice with ice-cold PBS, centrifuging at 600 ×g at 4° C for each wash. Next, 25 mL of extraction buffer A was added. The cells were incubated on ice for 15 min and homogenized for 30 strokes using a WHEATON homogenizer and then centrifuged at 600 ×g at 4° C for 10 min to remove the nuclei and cell debris. The supernatant was centrifuged at 11,000 ×g for 10 min at 4° C. The pellet was washed and centrifuged at 11,000 ×g for 10 min at 4° C. The resulting pellet containing the mitochondria was re-suspended in respiration medium. The protein content of the isolated mitochondria was measured using the Bradford method.
Measurement of respiration in HepG2 cells and mitochondria isolated from HepG2 cells
Respiration measurements in both HepG2 cells and mitochondria isolated from HepG2 cells were performed using a 782 two-channel oxygen system (Strathkelvin Instruments, Motherwell, Scotland) as previously described [26]. Briefly, HepG2 cells or mitochondria were transferred to the electrode chamber and allowed to equilibrate until they attained a steady rate of oxygen consumption. Shizukaol D was then added to the chamber, and the oxygen consumption was recorded. The respiration medium used for the HepG2 cells consisted of 25 mM glucose, 1 mM pyruvate, and 2% (wt/vol) BSA in PBS, pH 7.4. For the mitochondria, the respiration medium contained 225 mM mannitol, 75 mM sucrose, 10 mM Tris-HCl, 10 mM KH2PO4, 10 mM KCl, 0.8 mM MgCl2, 0.1 mM EDTA, and 0.3% (wt/vol) fatty acid-free BSA, pH 7.0.
Determination of lactate content
HepG2 cells were cultured in a 24-well plate and treated with shizukaol D or 50 µM rosiglitazone (as a positive control) in serum-free cell culture medium for 1 or 4 hours. The amount of lactate in the medium was measured using a lactate assay kit (Nanjing Jiancheng Bioengineering Institute, Nanjing, China).
Statistics
Results were calculated as the mean ± SD, and statistical analysis was performed with SPSS. The level of significance for the difference between data sets was assessed using ANOVA followed by post-hoc test. A p-value of < 0.05 was considered significant.
Results
shizukaol D increases AMP-activated protein kinase (AMPK) phosphorylation
To assess the potential effect of shizukaol D (Figure 1) on metabolism, we first analyzed the cytotoxicity of shizukaol D in HepG2 cells; we found that shizukaol D had no effect on the cell viability at various doses (maximum 50 µM) for up to 48 hours (Figure S1). We then treated HepG2 cells with shizukaol D at the indicated concentrations for 1 h, using 2 mM metformin as a positive control. The AMPK activity was analyzed by western blotting with an antibody specific for phosphorylated AMPK (Thr 172). Our results show that treatment with shizukaol D increased AMPKa phosphorylation in a dose-dependent manner (Figure 2A, B). We also assessed the phosphorylation of ACC, the downstream target of AMPK [10]. Western blotting analysis revealed that shizukaol D induced the phosphorylation of ACC at Ser 79 in a dose-dependent manner (Figure 2A, C) and we calculated that 2 µM shizukaol D induced ACC phosphorylation at a level comparable to that induced by treatment with 2 mM metformin. Finally, we treated HepG2 cells with 2 µM shizukaol D for different time points (Figure 2D, E, F).
Figure 1. Chemical structure of shizukaol D from Chloranthus japonicas .
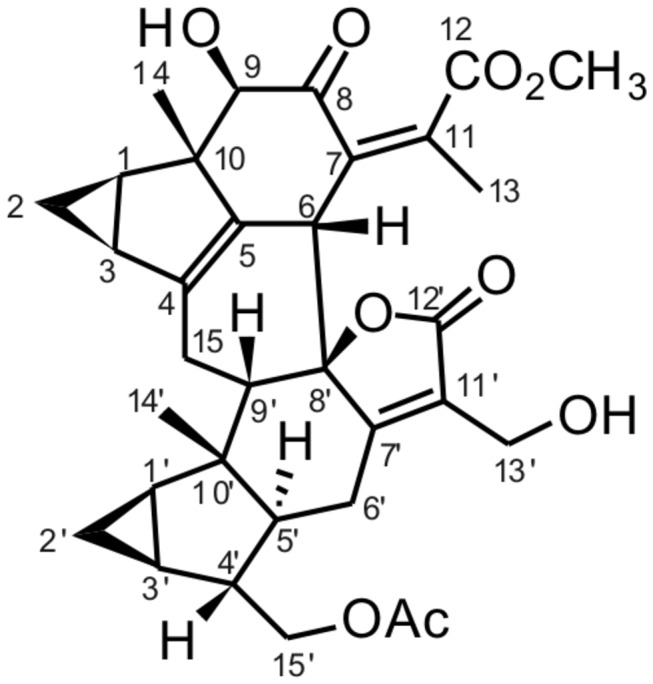
Figure 2. Shizukaol D increases AMPK and ACC phosphorylation in HepG2 cells.

Western blotting analysis showing the levels of phosphorylated AMPK and ACC in HepG2 cells treated with shizukaol D. (A) HepG2 cells were treated with shizukaol D at the indicated concentrations for 1 h. Metformin (2 mM) was used as a positive control. (D) The cells were treated with 2 µM shizukaol D for the indicated time points. (B) (C), (E) and (F) the levels of phosphorylated AMPK and ACC were quantified from three independent experiments. *, p<0.05; **, p<0.01 compared to treatment with DMSO (one-way ANOVA).
Shizukaol D Can Lower the Lipid Content of HepG2 Cells
Several studies have shown that the phosphorylation of ACC at Ser 79 leads to a reduced biosynthesis of malonyl-CoA [10,16,39], which serves as the initial substrate for fatty acid biosynthesis, and decreased carnitine palmitoyltransferase I activity, which increases mitochondrial fatty acid oxidation [17,18]. Therefore, ACC phosphorylation results in a decrease in lipid accumulation [8,9,14]. To determine whether shizukaol D can reduce lipid content, we measured the concentrations of triglycerides and cholesterol in HepG2 cells (see Materials and methods) that were starved in serum-free medium overnight and then treated with the indicated concentrations of shizukaol D for 24 h. As shown in Figure 3A, under these conditions, shizukaol D phosphorylated AMPKa (Thr172) and ACC (Ser79) as efficiently as metformin. In addition, treatment with shizukaol D significantly reduced the levels of both triglyceride and cholesterol in the HepG2 cells (Figure 3B, C).
Figure 3. Shizukaol D inhibits lipid accumulation in HepG2 cells.

HepG2 cells were starved in serum-free medium overnight and then treated with shizukaol D at the indicated concentrations for 24 h. Metformin (2 mM) was used as a positive control. Western blotting analysis showing phosphorylated AMPK and ACC (A). The triglyceride content (B) and cholesterol content (C) were measured (Results correspond to the mean ± SD of six independent experiments, statistical analysis was performed using one-way ANOVA followed by post- hoc test. *, p<0.05; **, p<0.01 versus the DMSO control). The cells were starved in serum-free medium overnight and then treated with shizukaol D at the indicated concentrations in the presence of 5.5 mM or 30 mM glucose for an additional 24 hours. The expression of AMPK and ACC was detected by western blotting (D), and the triglyceride content (E) and cholesterol content (F) were measured (graphics represent the mean ± SD from six independent experiments. *, p<0.05; **, p<0.01 versus the DMSO control).
Previous studies have shown that exposing HepG2 cells to high glucose levels (30 mM) for 24 h can induce an insulin-resistant state (Figure S2) and lipid accumulation [8,19]. To test whether shizukaol D treatment under conditions of high glucose concentrations mimics the activity of metformin, we analyzed the lipid content of shizukaol D-treated HepG2 cells exposed to medium 30 mM glucose. Our results showed that exposure to high glucose levels suppressed AMPK and ACC phosphorylation, whereas shizukaol D restored the high levels of phosphorylated AMPK and ACC, as metformin did, in the presence of high glucose levels (Figure 3D). Importantly, shizukaol D significantly reduced the high triglyceride content in HepG2 cells, which had been up-regulated due to the treatment with high glucose (Figure 3E). Interestingly, although high glucose treatment had no influence on the cholesterol level in HepG2 cells (Figure 3F), in agreement with previous studies [8,19], shizukaol D also decreased the cholesterol levels of HepG2 cells grown in high glucose medium (Figure 3F). Taken together, these results suggest that shizukaol D, like metformin, can reduce lipid accumulation in liver cells.
The effect of shizukaol D on lipid metabolism is dependent on the AMPK-ACC signaling pathway
To further confirm the relationship between AMPK activation and the suppression of lipid accumulation in response to treatment with shizukaol D, we inhibited AMPKa activity using an siRNA approach or with a chemical inhibitor and then detected the lipid contents of the HepG2 cells. We first transferred 50 µM siRNA into HepG2 cells to down-regulate AMPKa1 expression (Figure 4A) and then treated the cells with shizukaol D or metformin (see Materials and methods). As expected, the down-regulation of AMPKa1 expression mediated by the AMPKa1-siRNA resulted in a significant reduction in the levels phosphorylated AMPK and ACC induced by drug treatment (Figure 4A). Furthermore the siRNA treatment significantly reversed the shizukaol D-induced suppression of the triglyceride and cholesterol levels (Figure 4B, C).
Figure 4. Shizukaol D inhibits lipid accumulation in HepG2 cells in an AMPK-dependent manner.

HepG2 cells were transfected with AMPK siRNA or a control siRNA for 24 h followed by incubation with 2 µM shizukaol D or 2 mM metformin for an additional 24 h. AMPK and ACC phosphorylation was analyzed by western blotting (A), and the triglyceride content (B) and cholesterol content (C) were measured (n = 3). (D) The cells were pretreated with 20 µM compound C (an AMPK inhibitor) followed by treatment with 2 µM shizukaol D. AMPK and ACC phosphorylation was analyzed by western blotting (D), and the triglyceride content (E) and cholesterol content (F) were measured (n = 3). Statistical analysis was performed using two-way ANOVA followed by Tukey’ post-hoc test *, p<0.05; **, p<0.01.
Next, we inhibited AMPK with the chemical inhibitor compound C [40]. HepG2 cells were pre-treated with 20 µM compound C and then treated with 2 µM shizukaol D. Treatment of the HepG2 cells with compound C significantly inhibited the shizukaol-D-induced AMPK and ACC phosphorylation (Figure 4D). Importantly, the down-regulation of the triglyceride and cholesterol levels in HepG2 cells induced by shizukaol D was blocked by compound C (Figure 4E, F). Taken together, these results strongly support the conclusion that shizukaol D can suppress triglyceride and cholesterol levels in HepG2 cells in an AMPK-dependent manner.
Shizukaol D decreases mitochondrial membrane potential and increases the AMP/ATP ratio
As several studies have shown that AMPK-activating drugs such as metformin and TZDs influence mitochondrial function [24,41], we next investigated whether shizukaol D affects the mitochondrial membrane potential (△ψm) or the AMP/ATP ratio. Using a fluorescence detection assay (see Materials and methods), we observed that shizukaol D depolarized the mitochondrial membrane potential of HepG2 cells in a dose-dependent manner (Figure 5A), although the mitochondrial dysfunction induced by shizukaol D treatment was not as strong as that induced by the mitochondrial uncoupling drug CCCP (Figure 5A) [14,42,43]. ATP generation mainly occurs in mitochondria, and the inhibition of △ψm may lead to a reduction in ATP production or an increase in the AMP/ATP ratio [14]. We therefore determined the AMP/ATP ratio in HepG2 cells treated with shizukaol D by HPLC. Our results show that shizukaol D significantly increases the AMP/ATP ratio in HepG2 cells in a dose-dependent manner (Figure 5B). A time-course experiment also showed that shizukaol D increases the AMP/ATP ratio (Figure 5C). Taken together, these results suggest that shizukaol D may activate AMPK through the induction of mitochondrial dysfunction, such as the depolarization of the mitochondrial membrane and energy depletion.
Figure 5. Shizukaol D inhibits the mitochondrial membrane potential and increases the AMP/ATP ratio in HepG2 cells.

(A) HepG2 cells were incubated with shizukaol D for 10 min, and the mitochondrial membrane potential was measured. Treatment with CCCP was used as a positive control (n = 4). (B) HepG2 cells were treated with shizukaol D at the indicated concentrations for 1 h, and then the AMP/ATP ratio was measured (n = 3). (C) The cells were treated with 2 µM shizukaol D for the indicated time-points, and then the AMP/ATP ratio was measured (n = 3). *, p<0.05; **, p<0.01 compared to the DMSO control (one-way ANOVA).
Shizukaol D inhibits cellular respiration
To determine whether the change in the AMP/ATP ratio was due to an effect on cellular respiration (as is the case with AMPK activators such as metformin and TZDs [26,44]), we examined oxygen consumption in HepG2 cells in the presence of shizukaol D (see Materials and methods). Rosiglitazone was used as a positive control (Figure S3A) [41,45]. Treatment with shizukaol D resulted in a dose-dependent inhibition of aerobic respiration in HepG2 cells (Figure 6A). We next investigated whether shizukaol D specifically inhibits mitochondrial respiration by a mechanism similar to metformin and rosiglitazone [41,45]. ADP-stimulated respiration was analyzed in the presence of complex I (glutamate + malate) or complex II (succinate) substrates in mitochondria isolated from HepG2 cells (see Materials and methods). Rosiglitazone was used as a control for the specific inhibition of complex I (Figure S3B) [41]. We observed that shizukaol D did not inhibit mitochondrial respiration using either substrate (Figure 6B).
Figure 6. Shizukaol D inhibits cellular respiration.

(A) Dose-dependent inhibition of HepG2 cell respiration by treatment with shizukaol D at the indicated concentrations (n = 4). (B) Effect of shizukaol D on the respiration of mitochondria isolated from HepG2 cells (n = 3). Shizukaol D did not inhibit mitochondrial respiration either in the presence of complex I (glutamate + malate) or complex II (succinate) substrates. (C) And (D) Lactate concentrations were measured in HepG2 cells treated with shizukaol D as indicated time (1 h and 4 h) (n = 3). *, p<0.05; **, p<0.01 compared to the DMSO control (one-way ANOVA).
Previous reports have shown an elevation in anaerobic respiration to compensate for the suppression of aerobic respiration [14,26,46]. Therefore, we analyzed whether shizukaol D modulates lactate release, which is a marker of cellular anaerobic respiration. HepG2 cells were treated with shizukaol D for 1 h and 4 h, and the lactate concentration was measured (see Materials and methods). Elevated levels of lactate were found in HepG2 cells treated with shizukaol D (Figure 6C, D). This finding suggests that the suppression of aerobic respiration induced by shizukaol D results in the up-regulation of anaerobic respiration to meet the energy requirement of the cells.
Discussion
In this study, we have shown that shizukaol D reduces triglyceride and cholesterol levels in HepG2 cells grown at a normal concentration of glucose (5.5 mM; Figure 3B, C). The reduction of lipid content induced by shizukaol D may be a result of ACC phosphorylation and/or the activity of other enzymes such as fatty acid synthase (FAS), sterol regulatory element-binding protein 1 (SREBP1), and 3-hydroxy-3-methylglutarl-coenzyme A reductase [47–49]. However, neither shizukaol D nor metformin could alter cellular palmitic acids content after 12 hours incubation (Figure S4). The exposure of HepG2 cells to high glucose (30 mM) for 24 h induces an insulin-resistant state (Figure S2) [8,50,51] and a decrease in both AMPK and ACC phosphorylation (Figure 3D) [8,52]. In addition, our results agree with previously published studies showing that high glucose concentrations dramatically increase the triglyceride content in HepG2 cells but do not dramatically increase the cholesterol content [8,19] (Figure 3E, F). Furthermore, shizukaol D restored the levels of both AMPK and ACC phosphorylation that had been reduced by high glucose concentrations (Figure 3D). Because treatment with shizukaol D inhibits the triglyceride and cholesterol content in HepG2 cells in the presence of either low glucose (Figure 3B, C) or high glucose (Figure 3E, F), we propose that shizukaol D can lower the lipid content in HepG2 cells in both normal and insulin-resistant states.
To confirm the significance of AMPK in the activity of shizukaol D, we inhibited AMPK using an AMPKa1 siRNA and the AMPK inhibitor compound C. AMPKa1 siRNA knocks down the expression of AMPKa1, an important subunit of AMPK that has a phosphorylation site on a conserved loop at Thr 172. A previous study showed that AMPKa1 knockdown inhibited the ability of metformin to activate AMPK and down-regulate lipid content [8]. Compound C causes a remarkable inhibition of AMPK activity [40]. Here, we observed that both AMPKa1 siRNA and compound C decreased the shizukaol D-mediated phosphorylation of AMPK and abrogated the ability of shizukaol D to reduce lipid levels. This finding suggests that the modulation of lipid metabolism by shizukaol D is largely dependent on the AMPK-ACC signaling pathway.
A number of AMPK activators, such as metformin, TZDs, and berberine, are known to generate mitochondrial dysfunction in cells [41,45]. Here, we show that shizukaol D also decreased the mitochondrial membrane potential of HepG2 cells (Figure 5A), although we did not detect the expression of any apoptotic markers in response to the drug treatment (data not shown).
AMPK activation is a direct result of alterations in the AMP/ATP ratio [44,53–55]. Here, we found that treatment with shizukaol D increased the AMP/ATP ratio (Figure 5B, C). Furthermore, shizukaol D inhibited cellular respiration, similar to metformin and rosiglitazone (Figure 6A) [41]. We further investigated whether shizukaol D inhibits respiration in mitochondria isolated from HepG2 cells (the mitochondrial purity was approximately 60-70%, as shown in Figure S5) [56]. Surprisingly, we found that shizukaol D did not inhibit mitochondrial respiration using either complex I (glutamate and malate) or complex II (succinate) (Figure 6B). This finding suggests that other factor(s) may regulate aerobic respiration, such as the supply of electron donors (e.g., NADH) [14,54,57]. The inhibition of these factors may lead to the inhibition of aerobic respiration in cells, which would not be apparent in assays measuring the respiration of isolated mitochondria. Previous reports have shown that indomethacin, an anti-inflammatory drug, suppresses glucose oxidation without affecting pyruvate oxidation in mitochondria [58,59]. Furthermore, the compound C1 inhibits aerobic respiration but does not affect the activity of complex I or complex II in mitochondrial respiration [14]. Our findings highlight the potential value of shizukaol D as a promising compound for the treatment of metabolic diseases by activating AMPK.
Supporting Information
Survival analysis of shizukaol D-treated HepG2 cells. The viability of HepG2 cells treated with shizukaol D at the indicated concentrations for different time-points was analyzed by MTT assay. The results were normalized to the viability of DMSO-treated cells, which was set as 100%. Error bars represent the SD. from three independent experiments.
(TIF)
High glucose medium-induced insulin resistance of HepG2 cells. After incubation in normal (5 mM) or high (30 mM) glucose medium for 24 hours, HepG2 cells were incubated with 100 nM insulin for 10 min. Two components of the insulin signaling pathway were detected by western blotting.
(TIF)
Analysis of respiration in HepG2 cells and mitochondria isolated from HepG2 cells. (A) Rosiglitazone was set as control in HepG2 cellular respiration analysis (n=4). (B) Analysis of ADP-stimulated respiration in the presence of complex I (glutamate + malate) or complex II (succinate) substrates in mitochondria isolated from HepG2 cells. Rosiglitazone was used as specific inhibitor for complex I (n=3). *, p<0.05; **, p<0.01 versus control (one-way ANOVA).
(TIF)
Shizukaol D doesn’t alter the free fatty acids (palmitic acid) in HepG2 cells. HepG2 cells were starved in serum-free DMEM overnight and incubated with shizukaol D for 12 hours. The cells were then lysed in chloroform (1% Triton-X 100) for 30 min, and the level of fatty acids (palmitic acid) was detected (n = 3).
(TIF)
Assessment of mitochondrial purity by western blotting. Mitochondria were isolated from HepG2 cells. The purity was then assayed using a panel of marker proteins including Cytochrome C, Porin (mitochondria), Lamin B (Nucleus), HSP90 (cytosol), and Grp 78 (endoplasmic reticulum). PM represents isolated mitochondria; CT is cell lysates after homogenized.
(TIF)
Acknowledgments
We would like to thank Prof. Ying Leng for kindly providing glutamate, malate, succinate and assisting us with the 782 two-channel oxygen system and Dr. Sulin Huang for helpful suggestions regarding respiration measurements. We also thank Prof. Rong Zeng for kindly giving cytochrome c, porin, lamin B, Grp 78, HSP 90 antibodies.
Funding Statement
This work was supported in part by grants from Ministry of Science and Technology (#2010CB912102, 2011CB910200), a grant from the National Natural Science Foundation of China (#31130034) (to JRW); and a grant from the Knowledge Innovation Program of the Chinese Academy of Sciences (KSCX2-EW-Q-10) (to HL). The funders had no role in study design, data collection and analysis, decision to publish, or preparation of the manuscript.
References
- 1. Carling D (2004) The AMP-activated protein kinase cascade--a unifying system for energy control. Trends Biochem Sci 29: 18-24. doi:10.1016/j.tibs.2003.11.005. PubMed: 14729328. [DOI] [PubMed] [Google Scholar]
- 2. Hardie DG (2004) The AMP-activated protein kinase pathway--new players upstream and downstream. J Cell Sci 117: 5479-5487. doi:10.1242/jcs.01540. PubMed: 15509864. [DOI] [PubMed] [Google Scholar]
- 3. Hawley SA, Fullerton MD, Ross FA, Schertzer JD, Chevtzoff C et al. (2012) The ancient drug salicylate directly activates AMP-activated protein kinase. Science 336: 918-922. doi:10.1126/science.1215327. PubMed: 22517326. [DOI] [PMC free article] [PubMed] [Google Scholar]
- 4. Fujii N, Hayashi T, Hirshman MF, Smith JT, Habinowski SA et al. (2000) Exercise induces isoform-specific increase in 5'AMP-activated protein kinase activity in human skeletal muscle. Biochem Biophys Res Commun 273: 1150-1155. doi:10.1006/bbrc.2000.3073. PubMed: 10891387. [DOI] [PubMed] [Google Scholar]
- 5. Hardie DG, Scott JW, Pan DA, Hudson ER (2003) Management of cellular energy by the AMP-activated protein kinase system. FEBS Lett 546: 113-120. doi:10.1016/S0014-5793(03)00560-X. PubMed: 12829246. [DOI] [PubMed] [Google Scholar]
- 6. Minokoshi Y, Kim YB, Peroni OD, Fryer LG, Müller C et al. (2002) Leptin stimulates fatty-acid oxidation by activating AMP-activated protein kinase. Nature 415: 339-343. doi:10.1038/415339a. PubMed: 11797013. [DOI] [PubMed] [Google Scholar]
- 7. Yamauchi T, Kamon J, Minokoshi Y, Ito Y, Waki H et al. (2002) Adiponectin stimulates glucose utilization and fatty-acid oxidation by activating AMP-activated protein kinase. Nat Med 8: 1288-1295. doi:10.1038/nm788. PubMed: 12368907. [DOI] [PubMed] [Google Scholar]
- 8. Zang M, Zuccollo A, Hou X, Nagata D, Walsh K et al. (2004) AMP-activated protein kinase is required for the lipid-lowering effect of metformin in insulin-resistant human HepG2 cells. J Biol Chem 279: 47898-47905. doi:10.1074/jbc.M408149200. PubMed: 15371448. [DOI] [PubMed] [Google Scholar]
- 9. Hardie DG, Carling D (1997) The AMP-activated protein kinase--fuel gauge of the mammalian cell? Eur J Biochem 246: 259-273. doi:10.1111/j.1432-1033.1997.00259.x. PubMed: 9208914. [DOI] [PubMed] [Google Scholar]
- 10. Kahn BB, Alquier T, Carling D, Hardie DG (2005) AMP-activated protein kinase: ancient energy gauge provides clues to modern understanding of metabolism. Cell Metab 1: 15-25. doi:10.1016/j.cmet.2004.12.003. PubMed: 16054041. [DOI] [PubMed] [Google Scholar]
- 11. Peterson JM, Aja S, Wei Z, Wong GW (2012) CTRP1 protein enhances fatty acid oxidation via AMP-activated protein kinase (AMPK) activation and acetyl-CoA carboxylase (ACC) inhibition. J Biol Chem 287: 1576-1587. doi:10.1074/jbc.M111.278333. PubMed: 22086915. [DOI] [PMC free article] [PubMed] [Google Scholar]
- 12. Wen JP, Liu CE, Hu YT, Chen G, Lin LX (2010) Globular adiponectin regulates energy homeostasis through AMP-activated protein kinase-acetyl-CoA carboxylase (AMPK/ACC) pathway in the hypothalamus. Mol Cell Biochem 344: 109-115. doi:10.1007/s11010-010-0534-2. PubMed: 20625797. [DOI] [PubMed] [Google Scholar]
- 13. Janovská A, Hatzinikolas G, Staikopoulos V, McInerney J, Mano M et al. (2008) AMPK and ACC phosphorylation: effect of leptin, muscle fibre type and obesity. Mol Cell Endocrinol 284: 1-10. doi:10.1016/j.mce.2007.12.013. PubMed: 18255222. [DOI] [PubMed] [Google Scholar]
- 14. Qiu BY, Turner N, Li YY, Gu M, Huang MW et al. (2010) High-throughput assay for modulators of mitochondrial membrane potential identifies a novel compound with beneficial effects on db/db mice. Diabetes 59: 256-265. doi:10.2337/db09-0223. PubMed: 19833880. [DOI] [PMC free article] [PubMed] [Google Scholar]
- 15. Kraegen EW, Saha AK, Preston E, Wilks D, Hoy AJ et al. (2006) Increased malonyl-CoA and diacylglycerol content and reduced AMPK activity accompany insulin resistance induced by glucose infusion in muscle and liver of rats. Am J Physiol Endocrinol Metab 290: E471-E479. PubMed: 16234268. [DOI] [PubMed] [Google Scholar]
- 16. Sambandam N, Steinmetz M, Chu A, Altarejos JY, Dyck JR et al. (2004) Malonyl-CoA decarboxylase (MCD) is differentially regulated in subcellular compartments by 5'AMP-activated protein kinase (AMPK). Stud Using H 9c2 cells overexpressing MCD and AMPK by adenoviral gene transfer technique. Eur J Biochem 271: 2831-2840 [DOI] [PubMed] [Google Scholar]
- 17. Zammit VA, Arduini A (2008) The AMPK-malonyl-CoA-CPT1 axis in the control of hypothalamic neuronal function. Cell Metab 8: 175; author reply 176 doi:10.1016/j.cmet.2008.07.009. PubMed: 18762014. [DOI] [PubMed] [Google Scholar]
- 18. Kim MK, Kim SH, Yu HS, Park HG, Kang UG et al. (2012) The effect of clozapine on the AMPK-ACC-CPT1 pathway in the rat frontal cortex. Int J Neuropsychopharmacol 15: 907-917. doi:10.1017/S1461145711000976. PubMed: 21733226. [DOI] [PubMed] [Google Scholar]
- 19. Hou X, Xu S, Maitland-Toolan KA, Sato K, Jiang B et al. (2008) SIRT1 regulates hepatocyte lipid metabolism through activating AMP-activated protein kinase. J Biol Chem 283: 20015-20026. doi:10.1074/jbc.M802187200. PubMed: 18482975. [DOI] [PMC free article] [PubMed] [Google Scholar]
- 20. Davidson MB, Peters AL (1997) An overview of metformin in the treatment of type 2 diabetes mellitus. Am J Med 102: 99-110. doi:10.1016/S0002-9343(96)00353-1. PubMed: 9209206. [DOI] [PubMed] [Google Scholar]
- 21. Zhou G, Myers R, Li Y, Chen Y, Shen X et al. (2001) Role of AMP-activated protein kinase in mechanism of metformin action. J Clin Invest 108: 1167-1174. doi:10.1172/JCI200113505. PubMed: 11602624. [DOI] [PMC free article] [PubMed] [Google Scholar]
- 22. Anurag P, Anuradha CV (2002) Metformin improves lipid metabolism and attenuates lipid peroxidation in high fructose-fed rats. Diabetes Obes Metab 4: 36-42. doi:10.1046/j.1463-1326.2002.00178.x. PubMed: 11874440. [DOI] [PubMed] [Google Scholar]
- 23. Lochhead PA, Salt IP, Walker KS, Hardie DG, Sutherland C (2000) 5-aminoimidazole-4-carboxamide riboside mimics the effects of insulin on the expression of the 2 key gluconeogenic genes PEPCK and glucose-6-phosphatase. Diabetes 49: 896-903. doi:10.2337/diabetes.49.6.896. PubMed: 10866040. [DOI] [PubMed] [Google Scholar]
- 24. Fryer LG, Parbu-Patel A, Carling D (2002) The Anti-diabetic drugs rosiglitazone and metformin stimulate AMP-activated protein kinase through distinct signaling pathways. J Biol Chem 277: 25226-25232. doi:10.1074/jbc.M202489200. PubMed: 11994296. [DOI] [PubMed] [Google Scholar]
- 25. Yonemitsu S, Nishimura H, Shintani M, Inoue R, Yamamoto Y et al. (2001) Troglitazone induces GLUT4 translocation in L6 myotubes. Diabetes 50: 1093-1101. doi:10.2337/diabetes.50.5.1093. PubMed: 11334413. [DOI] [PubMed] [Google Scholar]
- 26. Huang SL, Yu RT, Gong J, Feng Y, Dai YL et al. (2012) Arctigenin, a natural compound, activates AMP-activated protein kinase via inhibition of mitochondria complex I and ameliorates metabolic disorders in ob/ob mice. Diabetologia 55: 1469-1481. doi:10.1007/s00125-011-2366-3. PubMed: 22095235. [DOI] [PubMed] [Google Scholar]
- 27. Cool B, Zinker B, Chiou W, Kifle L, Cao N et al. (2006) Identification and characterization of a small molecule AMPK activator that treats key components of type 2 diabetes and the metabolic syndrome. Cell Metab 3: 403-416. doi:10.1016/j.cmet.2006.05.005. PubMed: 16753576. [DOI] [PubMed] [Google Scholar]
- 28. Cao CM, Peng Y, Shi QW, Xiao PG (2008) Chemical constituents and bioactivities of plants of chloranthaceae. Chem Biodivers 5: 219-238. doi:10.1002/cbdv.200890020. PubMed: 18293432. [DOI] [PubMed] [Google Scholar]
- 29. Yim NH, Hwang EI, Yun BS, Park KD, Moon JS et al. (2008) Sesquiterpene furan compound CJ-01, a novel chitin synthase 2 inhibitor from Chloranthus japonicus SIEB. Biol Pharm Bull 31: 1041-1044. doi:10.1248/bpb.31.1041. PubMed: 18451544. [DOI] [PubMed] [Google Scholar]
- 30. Kuang H, Xia Y, Yang B, Wang Q, Lu S (2008). esquiterpene Glucosides from Chloranthus japonicus Sieb Chem Biodivers maggio: 1736-1742 [DOI] [PubMed] [Google Scholar]
- 31. Wang QH, Kuang HX, Yang BY, Xia YG, Wang JS et al. (2011) Sesquiterpenes from Chloranthus japonicus. J Nat Prod 74: 16-20. doi:10.1021/np100504m. PubMed: 21142110. [DOI] [PubMed] [Google Scholar]
- 32. Zhan ZJ, Ying YM, Ma LF, Shan WG (2011) Natural disesquiterpenoids. Nat Prod Rep 28: 594-629. doi:10.1039/c0np00050g. PubMed: 21246132. [DOI] [PubMed] [Google Scholar]
- 33. Kwon OE, Lee HS, Lee SW, Bae K, Kim K et al. (2006) Dimeric sesquiterpenoids isolated from Chloranthus japonicus inhibited the expression of cell adhesion molecules. J Ethnopharmacol 104: 270-277. doi:10.1016/j.jep.2005.09.018. PubMed: 16229979. [DOI] [PubMed] [Google Scholar]
- 34. Fang PL, Cao YL, Yan H, Pan LL, Liu SC et al. (2011) Lindenane disesquiterpenoids with anti-HIV-1 activity from Chloranthus japonicus. J Nat Prod 74: 1408-1413. doi:10.1021/np200087d. PubMed: 21650224. [DOI] [PubMed] [Google Scholar]
- 35. Zhang M, Iinuma M, Wang JS, Oyama M, Ito T et al. (2012) Terpenoids from Chloranthus serratus and their anti-inflammatory activities. J Nat Prod 75: 694-698. doi:10.1021/np200968p. PubMed: 22372956. [DOI] [PubMed] [Google Scholar]
- 36. Xiong L, Kou F, Yang Y, Wu J (2007) A novel role for IGF-1R in p53-mediated apoptosis through translational modulation of the p53-Mdm2 feedback loop. J Cell Biol 178: 995-1007. doi:10.1083/jcb.200703044. PubMed: 17846171. [DOI] [PMC free article] [PubMed] [Google Scholar]
- 37. Cheng Z, Pang T, Gu M, Gao AH, Xie CM et al. (2006) Berberine-stimulated glucose uptake in L6 myotubes involves both AMPK and p38 MAPK. Biochim Biophys Acta 1760: 1682-1689. doi:10.1016/j.bbagen.2006.09.007. PubMed: 17049164. [DOI] [PubMed] [Google Scholar]
- 38. Hahn-Windgassen A, Nogueira V, Chen CC, Skeen JE, Sonenberg N et al. (2005) Akt activates the mammalian target of rapamycin by regulating cellular ATP level and AMPK activity. J Biol Chem 280: 32081-32089. doi:10.1074/jbc.M502876200. PubMed: 16027121. [DOI] [PubMed] [Google Scholar]
- 39. Ruderman NB, Cacicedo JM, Itani S, Yagihashi N, Saha AK et al. (2003) Malonyl-CoA and AMP-activated protein kinase (AMPK): possible links between insulin resistance in muscle and early endothelial cell damage in diabetes. Biochem Soc Trans 31: 202-206. PubMed: 12546685. [DOI] [PubMed] [Google Scholar]
- 40. McCullough LD, Zeng Z, Li H, Landree LE, McFadden J et al. (2005) Pharmacological inhibition of AMP-activated protein kinase provides neuroprotection in stroke. J Biol Chem 280: 20493-20502. doi:10.1074/jbc.M409985200. PubMed: 15772080. [DOI] [PubMed] [Google Scholar]
- 41. Brunmair B, Staniek K, Gras F, Scharf N, Althaym A et al. (2004) Thiazolidinediones, like metformin, inhibit respiratory complex I: a common mechanism contributing to their antidiabetic actions? Diabetes 53: 1052-1059. doi:10.2337/diabetes.53.4.1052. PubMed: 15047621. [DOI] [PubMed] [Google Scholar]
- 42. de Graaf AO, van den Heuvel LP, Dijkman HB, de Abreu RA, Birkenkamp KU et al. (2004) Bcl-2 prevents loss of mitochondria in CCCP-induced apoptosis. Exp Cell Res 299: 533-540. doi:10.1016/j.yexcr.2004.06.024. PubMed: 15350550. [DOI] [PubMed] [Google Scholar]
- 43. Kwon KY, Viollet B, Yoo OJ (2011) CCCP induces autophagy in an AMPK-independent manner. Biochem Biophys Res Commun 416: 343-348. doi:10.1016/j.bbrc.2011.11.038. PubMed: 22119190. [DOI] [PubMed] [Google Scholar]
- 44. Sanders MJ, Grondin PO, Hegarty BD, Snowden MA, Carling D (2007) Investigating the mechanism for AMP activation of the AMP-activated protein kinase cascade. Biochem J 403: 139-148. doi:10.1042/BJ20061520. PubMed: 17147517. [DOI] [PMC free article] [PubMed] [Google Scholar]
- 45. Turner N, Li JY, Gosby A, To SW, Cheng Z et al. (2008) Berberine and its more biologically available derivative, dihydroberberine, inhibit mitochondrial respiratory complex I: a mechanism for the action of berberine to activate AMP-activated protein kinase and improve insulin action. Diabetes 57: 1414-1418. doi:10.2337/db07-1552. PubMed: 18285556. [DOI] [PubMed] [Google Scholar]
- 46. Glocklin VC, Fairbairn D (1952) The metabolism of Heterakis gallinae. I. Aerobic and anaerobic respiration; carbohydrate-sparing action of carbon dioxide. J Cell Physiol 39: 341-356. doi:10.1002/jcp.1030390302. PubMed: 14938401. [DOI] [PubMed] [Google Scholar]
- 47. Hagen RM, Rodriguez-Cuenca S, Vidal-Puig A (2010) An allostatic control of membrane lipid composition by SREBP1. FEBS Lett 584: 2689-2698. doi:10.1016/j.febslet.2010.04.004. PubMed: 20385130. [DOI] [PubMed] [Google Scholar]
- 48. Harvatine KJ, Bauman DE (2006) SREBP1 and thyroid hormone responsive spot 14 (S14) are involved in the regulation of bovine mammary lipid synthesis during diet-induced milk fat depression and treatment with CLA. J Nutr 136: 2468-2474. PubMed: 16988111. [DOI] [PubMed] [Google Scholar]
- 49. Nachbur U, Kassahn D, Yousefi S, Legler DF, Brunner T (2006) Posttranscriptional regulation of Fas (CD95) ligand killing activity by lipid rafts. Blood 107: 2790-2796. doi:10.1182/blood-2005-07-2744. PubMed: 16332972. [DOI] [PubMed] [Google Scholar]
- 50. Nelson BA, Robinson KA, Buse MG (2000) High glucose and glucosamine induce insulin resistance via different mechanisms in 3T3-L1 adipocytes. Diabetes 49: 981-991. doi:10.2337/diabetes.49.6.981. PubMed: 10866051. [DOI] [PubMed] [Google Scholar]
- 51. Zhang WY, Lee JJ, Kim Y, Kim IS, Park JS et al. (2010) Amelioration of insulin resistance by scopoletin in high-glucose-induced, insulin-resistant HepG2 cells. Horm Metab Res 42: 930-935. doi:10.1055/s-0030-1265219. PubMed: 20886413. [DOI] [PubMed] [Google Scholar]
- 52. Kim MS, Hur HJ, Kwon DY, Hwang JT (2012) Tangeretin stimulates glucose uptake via regulation of AMPK signaling pathways in C2C12 myotubes and improves glucose tolerance in high-fat diet-induced obese mice. Mol Cell Endocrinol 358: 127-134. doi:10.1016/j.mce.2012.03.013. PubMed: 22476082. [DOI] [PubMed] [Google Scholar]
- 53. Shaw RJ, Kosmatka M, Bardeesy N, Hurley RL, Witters LA et al. (2004) The tumor suppressor LKB1 kinase directly activates AMP-activated kinase and regulates apoptosis in response to energy stress. Proc Natl Acad Sci U S A 101: 3329-3335. doi:10.1073/pnas.0308061100. PubMed: 14985505. [DOI] [PMC free article] [PubMed] [Google Scholar]
- 54. Fujimoto S, Nabe K, Takehiro M, Shimodahira M, Kajikawa M et al. (2007) Impaired metabolism-secretion coupling in pancreatic beta-cells: role of determinants of mitochondrial ATP production. Diabetes Res Clin Pract 77 Suppl 1: S2-10. doi:10.1016/j.diabres.2007.01.026. PubMed: 17449130. [DOI] [PubMed] [Google Scholar]
- 55. Foretz M, Hébrard S, Leclerc J, Zarrinpashneh E, Soty M et al. (2010) Metformin inhibits hepatic gluconeogenesis in mice independently of the LKB1/AMPK pathway via a decrease in hepatic energy state. J Clin Invest 120: 2355-2369. doi:10.1172/JCI40671. PubMed: 20577053. [DOI] [PMC free article] [PubMed] [Google Scholar]
- 56. Deng WJ, Nie S, Dai J, Wu JR, Zeng R (2010) Proteome, phosphoproteome, and hydroxyproteome of liver mitochondria in diabetic rats at early pathogenic stages. Mol Cell Proteomics 9: 100-116. doi:10.1074/mcp.M900020-MCP200. PubMed: 19700791. [DOI] [PMC free article] [PubMed] [Google Scholar]
- 57. Caton PW, Nayuni NK, Kieswich J, Khan NQ, Yaqoob MM et al. (2010) Metformin suppresses hepatic gluconeogenesis through induction of SIRT1 and GCN5. J Endocrinol 205: 97-106. doi:10.1677/JOE-09-0345. PubMed: 20093281. [DOI] [PubMed] [Google Scholar]
- 58. Cooney GJ, Dawson AG (1977) Effects of indomethacin on the metabolism of glucose by isolated rat kidney tubules. Biochem Pharmacol 26: 2463-2468. doi:10.1016/0006-2952(77)90462-2. PubMed: 597337. [DOI] [PubMed] [Google Scholar]
- 59. Cooney GJ, Dawson AG (1979) Effects of indomethacin on respiration and the alpha-glycerolphosphate shuttle in rat kidney mitochondria. Biochem Pharmacol 28: 1067-1070. doi:10.1016/0006-2952(79)90305-8. PubMed: 220985. [DOI] [PubMed] [Google Scholar]
Associated Data
This section collects any data citations, data availability statements, or supplementary materials included in this article.
Supplementary Materials
Survival analysis of shizukaol D-treated HepG2 cells. The viability of HepG2 cells treated with shizukaol D at the indicated concentrations for different time-points was analyzed by MTT assay. The results were normalized to the viability of DMSO-treated cells, which was set as 100%. Error bars represent the SD. from three independent experiments.
(TIF)
High glucose medium-induced insulin resistance of HepG2 cells. After incubation in normal (5 mM) or high (30 mM) glucose medium for 24 hours, HepG2 cells were incubated with 100 nM insulin for 10 min. Two components of the insulin signaling pathway were detected by western blotting.
(TIF)
Analysis of respiration in HepG2 cells and mitochondria isolated from HepG2 cells. (A) Rosiglitazone was set as control in HepG2 cellular respiration analysis (n=4). (B) Analysis of ADP-stimulated respiration in the presence of complex I (glutamate + malate) or complex II (succinate) substrates in mitochondria isolated from HepG2 cells. Rosiglitazone was used as specific inhibitor for complex I (n=3). *, p<0.05; **, p<0.01 versus control (one-way ANOVA).
(TIF)
Shizukaol D doesn’t alter the free fatty acids (palmitic acid) in HepG2 cells. HepG2 cells were starved in serum-free DMEM overnight and incubated with shizukaol D for 12 hours. The cells were then lysed in chloroform (1% Triton-X 100) for 30 min, and the level of fatty acids (palmitic acid) was detected (n = 3).
(TIF)
Assessment of mitochondrial purity by western blotting. Mitochondria were isolated from HepG2 cells. The purity was then assayed using a panel of marker proteins including Cytochrome C, Porin (mitochondria), Lamin B (Nucleus), HSP90 (cytosol), and Grp 78 (endoplasmic reticulum). PM represents isolated mitochondria; CT is cell lysates after homogenized.
(TIF)