

Abstract
Background
Polychlorinated biphenyls (PCBs) are persistent environmental pollutants which are detectable in the serum of all American adults. Amongst PCB congeners, PCB 153 has the highest serum level. PCBs have been dose-dependently associated with obesity, metabolic syndrome, and nonalcoholic fatty liver disease (NAFLD) in epidemiological studies.
Objective
The purpose of this study is to determine mechanisms by which PCB 153 worsens diet-induced obesity and NAFLD in male mice fed a high fat diet (HFD).
Methods
Male C57BL6/J mice were fed either control or 42% milk fat diet for 12 weeks with or without PCB 153 co-exposure (50 mg/kg i.p. × 4). Glucose tolerance test was performed, and plasma and tissues were obtained at necropsy for measurements of adipocytokine levels, histology and gene expression.
Results
In control diet-fed mice, addition of PCB 153 had minimal effects on any of the measured parameters. However, PCB 153 treatment in high fat-fed mice was associated with increased visceral adiposity, hepatic steatosis and plasma adipokines including adiponectin, leptin, resistin and plasminogen activator inhibitor-1 levels. Likewise, co-exposure reduced expression of hepatic genes implicated in β-oxidation while increasing the expression of genes associated with lipid biosynthesis. Regardless of diet, PCB 153 had no effect on insulin resistance or tumor necrosis factor alpha levels.
Conclusion
PCB 153 is an obesogen which exacerbates hepatic steatosis; alters adipocytokines; and disrupts normal hepatic lipid metabolism when administered with HFD, but not control diet. Because all U.S. adults have been exposed to PCB 153, this particular nutrient-toxicant interaction potentially impacts human obesity/NAFLD.
Keywords: NAFLD, PCB, PCBs, TASH, POPs
1. Introduction
Non-alcoholic fatty liver disease (NAFLD) is the most prevalent liver disease in North America. Because it is often seen in association with insulin resistance and dyslipidemia, NAFLD is generally regarded to be the hepatic manifestation of obesity and the metabolic syndrome. However, previous work by our group and others, suggests that industrial chemical exposures may also result in steatohepatitis [1–3]. While our initial reports documented toxicant associated steatohepatitis (TASH) with altered adipocytokines, in lean abstinent chemical workers with high occupational exposures [3–4], we have more recently identified suspected NAFLD/TASH in the National Health and Nutrition Examination Study (NHANES) participants with chronic low-level environmental exposures to persistent organic pollutants (POPs) including polychlorinated biphenyls (PCBs) [5]. Although novel, this observation is hardly surprising because other epidemiologic studies have found associations between PCBs and metabolic disorders associated with NAFLD including obesity [6–7], insulin resistance/diabetes [2, 8–9], and the metabolic syndrome [7, 10]. Furthermore, follow-up of subjects involved in the “Yu-cheng” incident in Taiwan; one of the two known major human PCB intoxication episodes where cooking oil had been highly contaminated by PCBs; the mortality rate due to cirrhosis was 2.7 fold higher than expected [11], although pathologic confirmation was not provided.
PCBs are polyhalogenated aromatic hydrocarbons consisting of up to 10 chlorine atoms attached to a biphenyl group. A total of 1.3 million tons of PCBs consisting of 130 individual congeners were manufactured prior 1977 [12] for use in electrical and other industrial applications. Although PCB production and sale have been banned in the US for over 30 years, their high thermodynamic stability makes them resistant to biodegradation and thus, persistent organic pollutants. PCBs continue to be present in the American diet, and daily intake is estimated to be approximately 30 ng/day based on a recent study from a Dallas supermarket [13]. 100% of adult NHANES participants had detectable circulating PCB levels in humans and PCB 153 (2,2′,4,4′,5,5′-hexachlorobiphenyl) has the highest median serum concentration of any single congener [5].
From a mechanistic standpoint, a PCB’s structure determines its ability to interact with nuclear receptors. Coplanar PCBs such as PCB 126 are aryl hydrocarbon receptor (AhR) agonists similar to dioxin. Previous work has implicated dioxins and dioxin-like PCBs in animal models of steatohepatitis [14–15]. However, by mass, dioxin-like PCBs are a relatively minor component of the total PCB burden in human serum [5]. The effect of PCB 153, a lipid soluble, non-dioxin like PCB which concentrates in adipose tissue has not been adequately studied in animal models of NAFLD. Furthermore, previous National Toxicology Program (NTP) studies performed in rats demonstrated PCB-induced hepatotoxicity [16–17]. Likewise, nutrient-toxicant interactions appear to be important in diet-induced obesity/metabolic syndrome [18] and NAFLD [19], but are poorly understudied, particularly for PCB 153. However, our recent metabolomics study documented changes to the hepatic metabolome including increased triglycerides in mice co-treated with PCB 153 and high fat diet compared to either treatment alone [20]. We hypothesize that PCB 153 is a relevant “second hit” mechanism in the genesis and progression of obesity/NAFLD occurring in the context of a high fat diet. The purpose of this study is to (i) determine, in a mouse model, if PCB 153 exposures alone are sufficient to induce obesity and NAFLD; and (ii) to determine if PCB 153 worsens diet-induced obesity and NAFLD by exacerbating previously implicated mechanisms such as insulin resistance, adipocytokines, and expression of genes implicated in hepatic lipid metabolism.
2. Materials and Methods
2.1. Animals and diets
The animal protocol was approved by the University of Louisville Institutional Animal Care and Use Committee. Male C57BL/6J mice (8 weeks old, n=40; The Jackson Laboratory, Bar Harbor, Maine) were divided into 4 study groups (n=10) based on diet and PCB 153 exposure in this 12 week study utilizing a 2×2 design. Mice were fed either a high fat diet (HFD, 42% kCal from fat; TD.88137 Harlan Teklad) or a control diet (CD, 13.5% kCal from fat; 5010 LabDiet). PCB 153 (Ultra Scientific, North Kingstown, RI), was administered in corn oil (vehicle) by IP injection (vs. corn oil alone) at a dose of 50 mg/kg on weeks 4, 6, 8, and 10. Mice were housed in a temperature-and light-controlled room (12h light; 12h dark) with food and water ad libitum. A glucose tolerance test was performed at week 11, and the animals were euthanized (sodium pentobarbital, 40 mg/kg body weight, i.p.) at the end of week 12. Thus four different treatment groups were evaluated in this fashion: CD, CD+PCB 153, HFD, HFD+PCB 153.
2.2. Glucose tolerance test
The glucose tolerance test (GTT) was performed 2 weeks prior to the end of study. On the day of test, mice were fasted for 6 h (9 A.M.–3 P.M.) and fasting blood glucose level was measured with a hand-held glucometer (ACCU-CHEK Aviva, Roche, Basel, Switzerland) using 1 μl blood via tail snip. Glucose was then administered (1 mg glucose/g body weight, sterile saline, i.p.), and blood glucose was measured at 5, 15, 30, 60, 90 and 120 min post-injection. Insulin resistance was calculated by homeostasis model assessment model (HOMA) using the formula HOMA-IR = Fasting glucose (mg/dL) × Fasting insulin (μU/mL) /405 [21].
2.3. Liver histological studies
Liver sections were frozen (OCT) or fixed in 10% buffered formalin for 24 h and embedded in paraffin for histological examinations. Tissue sections were stained with either Oil Red O (frozen OCT), hematoxylin–eosin (H&E; formalin-fixed) or Sirius red stain (formalin-fixed) and examined under light microscopy at 200X magnification. Photomicrographs were captured using a Nikon Eclipse E600 Microscope.
2.4. Cytokines and adipokines measurement
Plasma cytokine and adipokine levels were measured using Milliplex Mouse Serum Cytokine and Adipokine Kits (Millipore Corp, Billerica, MA) on the Luminex IS 100 system (Luminex Corp, Austin, TX), as per the manufacturer’s instructions. Plasma aspartate transaminase (AST) and alanine transaminase (ALT) levels were measured using Cobas Mira Plus automated chemical analyzer (Roche, Basel, Switzerland).
2.5. Measurement of hepatic triglyceride and cholesterol content
Mouse livers were washed in neutral 1X phosphate buffered saline and pulverized. Hepatic lipids were extracted by an aqueous solution of chloroform and methanol, according to the Bligh and Dyer method [22], dried using nitrogen and re-suspended in 5% lipid free bovine serum albumin. Triglycerides and cholesterol were quantified using the Cobas Mira Plus automated chemical analyzer. The reagents employed for the assay were L-Type Triglyceride M (Wako Diagnostics, Richmond, VA) and Infinity Cholesterol Liquid Stable Reagent (Fisher Diagnostics, Middletown, VA) for triglycerides and cholesterol respectively.
2.6. Real time-PCR
Animal liver and adipose tissue samples were homogenized and total RNA was extracted using the RNA-STAT 60 protocol (Tel-Test, Austin, TX). cDNA was synthesized from total RNA using the QuantiTect Reverse Transcription Kit (Qiagen, Valencia, CA). PCR was performed on the Applied Biosystems StepOnePlus Real-Time PCR Systems using the Taqman Universal PCR Master Mix (Life Technologies, Carlsbad, CA). Primer sequences from Taqman Gene Expression Assays (Applied Biosystems, Foster City, CA) were as follows: tumor necrosis factor alpha (TNFα) (Mm00443258-m1), adiponectin (Mm004564425-m1), leptin (Mm00434759-m1), fatty acid synthase (FAS) (Mm00662319-m1), peroxisome proliferator-activated receptor alpha (PPARα) (Mm00440939-m1), carnitinepalmitoyltransferase 1A (CPT1A) (Mm01231183-m1), carnitinepalmitoyltransferase 2 (CPT2) (Mm00487205-m1), and Glyceraldehyde-3-phosphate dehydrogenase (GAPDH) (4352932E). The levels of mRNA were normalized relative to the amount of GAPDH mRNA, and expression levels in mice fed control diet and administered vehicle were set at 100%. Gene expression levels were calculated according to the 2−ΔΔCt method [23].
2.7. Statistical Analysis
Statistical analyses were performed using GraphPad Prism version 5.01 for Windows. Data are expressed as mean ± SEM. For 2 group comparison, an unpaired t-test was used, and multiple group data were compared using Two Way ANOVA followed by Tukey Test for post-hoc all pairwise comparisons. P <0.05 was considered statistically significant.
3. Results
3.1. PCB 153 treatment increased body weight and visceral adiposity in mice fed high fat diet, but had no effect in mice fed control diet
During the 12 week experiment, all groups experienced weight gain (Figure 1A). PCB 153 administration had no significant effect on mean percent body weight gain in mice fed control diet (111.1 ± 0.8% for CD vs. 107.5 ± 1.7% for CD+PCB 153, p =0.165). In contrast, PCB 153 significantly increased body weight gain in mice fed with HFD (122.8 ± 2.0%) vs. HFD+vehicle (114.0 ± 2.6%, p =0.003). There was a significant interaction between HFD and PCB 153 using Two Way ANOVA analysis (p =0.002). Indeed, body weight gain was significantly greater for HFD+PCB 153 vs. all other treatment groups (Figure 1A). The observed differences in body weight appeared to be explained by increased visceral adiposity in mice treated with HFD+PCB 153 (Figure 1B).
Fig. 1.
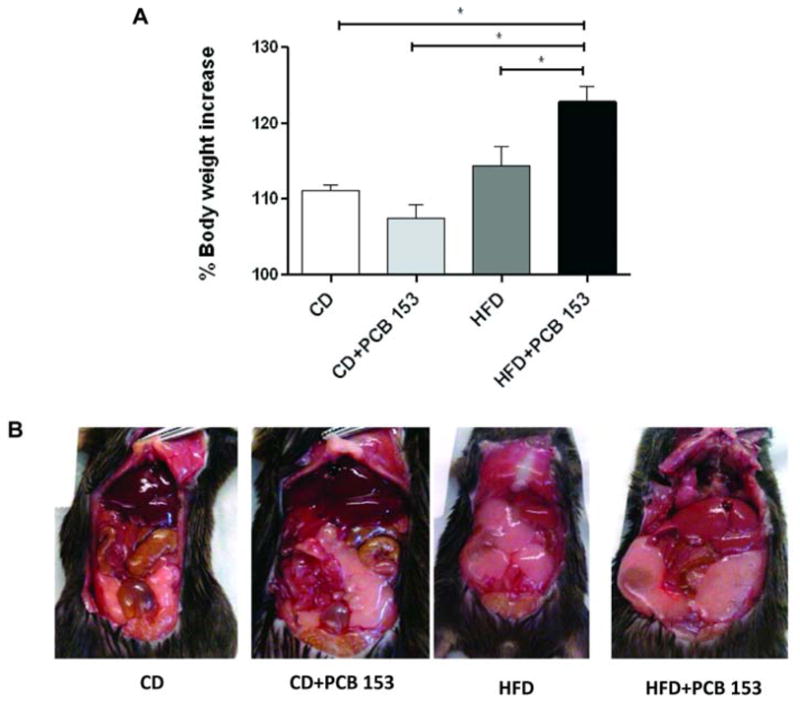
PCB 153 increased body weight and visceral adiposity in mice fed a high fat diet. (A) The % increase in body weight for C57BL/6J mice (n=10) treated with a 42% milk fat diet (vs. control diet) ± PCB 153 (200 mg/kg cumulative). Body weight measurements were taken from week 1 to week 12 (12 weeks) and the body weight at week 1 was taken as 100%. (B) Chronic PCB 153 (cumulative dose 200 mg/kg i.p.) increased visceral adiposity in C57BL/6J mice fed with a high fat diet. * P <0.05. CD-control diet, HFD-high fat diet, PCB-polychlorinated biphenyl.
On H&E stain, epididymal adipocyte size was increased by HFD, but PCB 153 had no additive effect (Figure 2A). In mice fed with CD, the mean epididymal adipocyte area (μm2) was (1357.9 ± 70.7 μm2) with vehicle control and was significantly different with PCB 153 (1806.5 ± 169.5 μm2, p=0.02) (Figure 2B). In mice fed with HFD, adipocyte size was not significantly different for vehicle (5643.8 ± 632.5 μm2) vs. PCB 153 (5371.3 ± 484.9 μm2, p =0.630). However, adipocyte size was significantly larger with HFD+vehicle vs. CD+vehicle (p <0.001) but not vs. CD+PCB 153 (p =0.823), whereas mean adipocyte size was larger with HFD+PCB 153 vs. both CD+vehicle and CD+PCB 153 (p <0.001). Therefore, PCB 153 worsened diet-induced obesity, independent of effects on adipocyte size. PCB 153 slightly increased adipocyte size only in mice fed control diet.
Fig. 2.
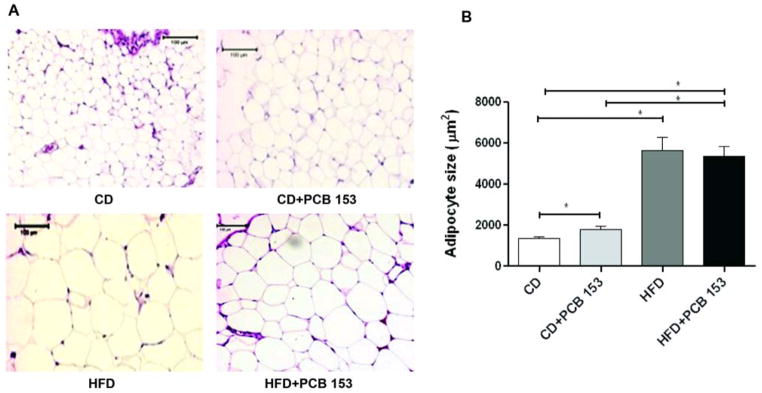
High fat diet increased adipocyte cell size and this was unaffected by PCB 153. (A) epipdidymal adipose tissue was stained with H&E. (B) Adipocyte area was measured and average cell size of >100 cells for each of the groups (n=10) was calculated. * P <0.05. CD-control diet, HFD-high fat diet, PCB-polychlorinated biphenyl.
3.2. PCB 153 worsened NAFLD in mice fed high fat diet, but had no hepatic effects in mice fed control diet
CD-fed mice did not develop significant steatosis by histology (Oil Red O and H&E stains-Figure 3A&B) with either vehicle control or PCB 153. In contrast, HFD increased steatosis which appeared to be even greater with PCB 153 co-exposure (vs. vehicle). Hepatic triglycerides and cholesterol were quantitated biochemically. In CD-fed mice, mean hepatic triglycerides were not significantly different between vehicle (7.3 ± 1.2 μg/mg tissue) and PCB 153 treatment (4.6 ± 1.9 μg/mg tissue, p =0.904) (Figure 4A). Likewise, hepatic cholesterol levels were not significantly different between vehicle (2.8 ± 0.4 μg/mg tissue) and PCB 153- treated mice fed with CD (3.2 ± 0.9 μg/mg tissue, p =0.551) (Figure 4B). In contrast, HFD-fed mice had significantly higher mean hepatic triglyceride levels with PCB 153 (56.4 ± 14.4 μg/mg tissue) vs. vehicle control (17.0 ± 6.4 μg/mg tissue, p =0.013). Indeed, HFD+PCB 153 co-exposure resulted in significantly higher hepatic triglycerides than all other treatments (Figure 4A). Hepatic cholesterol levels were not significantly different between HFD+vehicle (5.1 ± 1.5 μg/mg tissue) vs. HFD+PCB 153 (9.3 ± 2.2 μg/mg tissue, p =0.157). However, mean hepatic cholesterol levels were significantly higher with HFD+PCB 153 vs. both CD+vehicle (p =0.006) or CD+PCB 153 (p= 0.016) (Figure 4B).
Fig. 3.
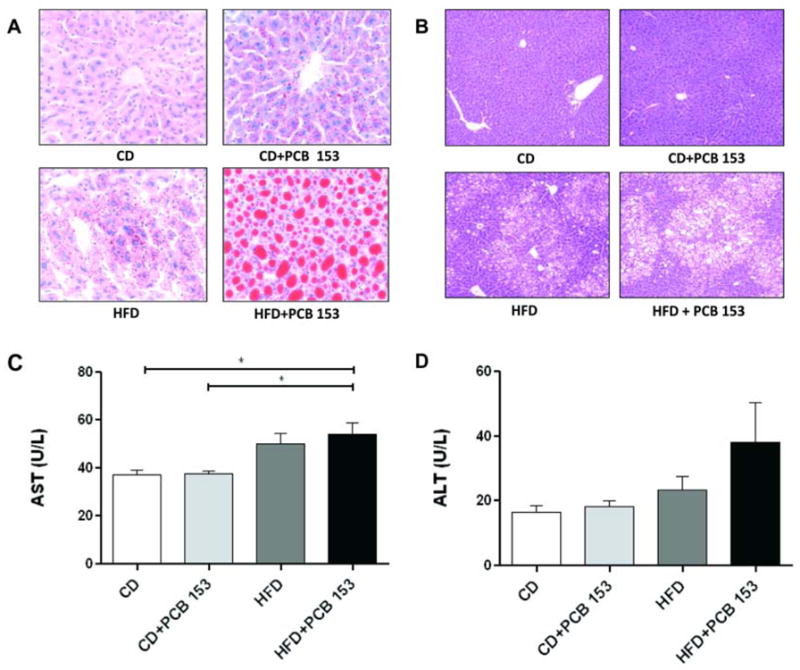
PCB 153 worsened NAFLD in mice fed a high fat diet. (A) Oil Red O staining of hepatic sections established the occurrence of micro-vesicular steatosis in the HFD+PCB 153 mice. (B) The same group of mice also showed macro-vesicular steatosis by H&E staining. (C) Plasma AST and (D) Plasma ALT levels (U/L) were measured (n=10) using Cobas Mira Plus automated chemical analyzer. * P <0.05. CD-control diet, HFD-high fat diet, PCB-polychlorinated biphenyl, AST-aspartate transaminase, ALT-alanine transaminase.
Fig. 4.

PCB 153 increased hepatic triglycerides and cholesterol in mice fed a high fat diet but did not change hepatic TNFα expression levels. Hepatic levels of (A) triglycerides and (B) cholesterol were quantified (μg/mg tissue) in mice (n=5) fed with control diet or high fat diet with or without PCB 153. (C) Hepatic TNFα mRNA expression. * P <0.05. CD-control diet, HFD-high fat diet, PCB-polychlorinated biphenyl, TNFα-tumor necrosis factor alpha.
Hepatic necro-inflammation was evaluated by histology (H&E), plasma aminotransferase activity, and hepatic TNFα message (RT-PCR). Qualitatively, significant necro-inflammation was not observed histologically in either group (Figure 3B). Mean plasma AST activity levels were slightly, but significantly higher with HFD+PCB 153 (54.1 ± 4.6 U/L) vs. either CD+vehicle (37.1 ± 2.0 U/L, p <0.001) or CD+PCB 153 (37.7 ± 1.2 U/L, p =0.002) (Figure 3C). The mean AST level in the HFD+vehicle group (49.8±4.5 U/L) was significantly different from CD+vehicle group (p =0.021) but not from CD+PCB 153 group (p =0.505). In contrast, mean plasma ALT activity levels were not significantly different between groups (Figure 3D). Hepatic TNFα message was measured by RT PCR and normalized to GAPDH (Figure 4C). Mean TNFα message levels were not significantly different between groups: CD+vehicle (1.0 ± 0.2); CD+PCB 153 (1.1 ± 0.4); HFD+vehicle (2.9 ± 0.1); HFD+PCB 153 (0.6 ± 0.2).
Hepatic fibrosis was evaluated by Sirius red stain. As no qualitative differences were observed between treatment groups (data not shown), quantitative studies were not performed. In summary, the combination of PCB 153 and HFD dramatically worsened steatosis, marginally worsened necro-inflammation, but had no effect on fibrosis. PCB 153 had no effect on these parameters in mice fed CD.
3.3. Insulin resistance, glucose regulation and serum lipoproteins: Effects of HFD and PCB 153
In order to evaluate insulin resistance which is frequently associated with NAFLD, HOMA-IR was determined and GTT was performed. As observed by HOMA-IR (Figure 5A) HFD+vehicle (3.8 ± 0.5) was associated with insulin resistance but this effect was not augmented by HFD+PCB 153 (3.8 ± 0.6, p =0.965). However, HOMA-IR levels were significantly higher in HFD+vehicle vs. CD+vehicle (1.1 ± 0.1, p <0.001). Likewise, HOMA-IR levels were significantly higher in HFD+PCB 153 vs. CD+vehicle and CD+PCB 153 (p <0.001). GTT was performed and compared to CD; HFD+vehicle and HFD+PCB 153 significantly increased the glucose area under the curve (AUC) (Figure 5 C&D) (p <0.05). PCB 153, though, had no additive effect to dietary manipulation alone. However, in CD-fed mice, PCB 153 administration was associated with lower fasting blood glucose levels (170.4 ± 4.6 mg/dL for CD+vehicle vs. 147.1 ± 5.9 mg/dL CD+PCB 153, p=0.006) (Figure 5B).
Fig. 5.

High fat diet increased insulin resistance and this was unaffected by PCB 153 co-exposure. (A) HOMA-IR was caluclated from fasting blood glucose and insulin levels for all four groups of animals (n=10) with HFD and HFD+PCB 153 animals showing higher levels. (B) Fasting blood glucose levels (mg/dL) were measured (C) Glucose tolerance test was performed and blood glucose levels were measured for mice (n=10) fed with a control diet or high fat diet, with or without PCB 153 (D) Area under the curve was calculated and HFD and HFD+PCB 153 groups showed higher AUC levels than CD or CD+PCB 153 groups. * P <0.05. CD-control diet, HFD-high fat diet, PCB-polychlorinated biphenyl.
The plasma levels of total cholesterol, triglycerides, high density lipoproteins (HDL) and low density lipoproteins (LDL) were measured in all animal groups (Table 1). No significant differences were observed in lipids in mice administered CD+vehicle vs. CD+PCB 153: total cholesterol (70.0 ± 10.3 mg/dL for CD vs. 69.9 ± 16.5 mg/dL for CD+PCB 153, p =0.991), triglycerides (33.8 ± 13.0 mg/dL for CD vs. 38.6 ± 19.9 mg/dL for CD+PCB 153, p =0.593), LDL (14.0 ± 2.4 mg/dL for CD vs. 14.3 ± 4.1 mg/dL for CD+PCB 153, p =0.939), and HDL (54.7 ± 5.1 mg/dL for CD vs. 58.9 ± 10.9 mg/dL for CD+PCB 153, p =0.660). Likewise mean lipid levels were unchanged in HFD+vehicle vs. HFD+PCB 153: total cholesterol (136.8 ± 37.6 mg/dL for HFD and 141.5 ± 27.5 mg/dL for HFD+PCB 153, p =0.684), triglycerides (23.4 ± 4.2 mg/dL for HFD vs. 34.2 ± 27.1 mg/dL for HFD+PCB 153, p =0.218), LDL(33.7 ± 9.7 mg/dL for HFD vs. 31.2 ± 8.8 mg/dL for HFD+PCB 153, p =0.447), and HDL (111.0 ± 31.0 mg/dL for HFD vs. 113.8 ± 17.7 mg/dL for HFD+PCB 153, p =0.752). However, total cholesterol, LDL, and HDL were significantly higher for HFD+PCB 153 vs. CD+PCB 153 (p <0.05 – Table 1). In summary, HFD was associated with insulin resistance and serum hypercholesterolemia, but PCB 153 had no additional effect on these parameters.
Table 1.
Plasma levels of total cholesterol, triglycerides, high density and low density lipoproteins.
| CD | CD+PCB 153 | HFD | HFD+PCB 153 | |
|---|---|---|---|---|
| Cholesterol | 70.0 ± 10.3 | 69.9 ± 16.5 | 136.8 ± 37.6a | 141.5 ± 27.5a |
| Triglycerides | 33.8 ± 13.0 | 38.6 ± 19.9 | 23.4 ± 4.2 | 34.2 ± 27.1 |
| LDL | 14.3 ± 2.4 | 14.3 ± 4.1 | 33.7 ± 9.7a | 31.2 ± 8.8a |
| HDL | 54.7 ± 5.1 | 58.9 ± 10.9 | 111.0 ± 31.0a | 113.8 ± 17.7a |
p <0.05 compared with mice fed control diet alone or co-administered with PCB 153.
Values are mean ± SEM (mg/dL). CD-control diet, HFD-high fat diet, PCB-polychlorinated biphenyl, HDL-high density liporoteins, LDL-low density lipoproteins.
3.4. PCB 153 exposure altered gene expression of enzymes involved in hepatic lipid metabolism
Real-time PCR was performed in liver to analyze potential changes in expression of selected genes involved in fatty acid metabolism: FAS, PPARα, and CPT1A/2. FAS expression was significantly increased in HFD+PCB 153 (25.3 ± 14.4 for HFD+PCB 153) vs. CD+vehicle (1.0 ± 0.4, p =0.016) and vs. CD+PCB 153 (4.2 ± 1.7, p =0.008) (Figure 6A). There was a trend towards lower FAS expression in HFD+vehicle (4.7 ± 3.8) vs. HFD+PCB 153, which was statistically significant (p =0.012). PPARα expression was significantly decreased in HFD+PCB 153 (0.2 ± 0.1) vs. both CD+vehicle (1.0 ± 0.2, p =0.002) and CD+PCB 153 (1.3 ± 0.4, p =0.005) (Figure 6B). No significant differences were seen in PPARα expression in HFD+vehicle (0.5 ± 0.1) vs. any other group; although there was a non-significant trend towards higher PPARα expression in the HFD+PCB 153 group (p =0.492). CPT1A, a PPARα target gene and the rate limiting step in hepatic β oxidation, was decreased in HFD+PCB 153 (0.1 ± 0.1) vs. CD+vehicle (1.0 ± 0.2, p =0.036) (Figure 6C). Mean CPT2 expression was significantly decreased in HFD+PCB 153 (0.2 ± 0.1) vs. both CD+vehicle (1.0 ± 0.2) and CD+PCB 153 (1.1 ± 0.1, p <0.001); and also in HFD+vehicle (0.5 ± 0.3) vs. CD+vehicle (p =0.049) (Figure 6D). CPT2 expression was numerically lower in HFD+PCB 153 than HFD+vehicle, but this trend was not statistically significant (p =0.155). Therefore, with HFD+PCB 153 co-exposure, the overall picture favored increased expression of genes implicated in fatty acid synthesis and decreased expression of genes involved in β oxidation.
Fig. 6.

PCB exposure altered expression of some but not all genes involved in hepatic lipid metabolism. Real-time PCR experiments showed the changes in hepatic mRNA expressions caused by either PCB 153 or high fat diet or both as compared to animals fed with a control diet for (A) FAS, (B) PPARα, (C) CPT1A, (D) CPT2. All values were normalized to control diet group, (n=10),* P <0.05. CD-control diet, HFD-high fat diet, PCB-polychlorinated biphenyl, FAS-fatty acid synthase, PPARα-peroxisome proliferator-activated receptor alpha, CPT1A-carnitine palmitoyl transferase 1A, CPT2-carnitine palmitoyl transferase 2.
3.5. PCB 153 altered plasma adipokine levels and expression although cytokine levels were unchanged
HFD+PCB 153 increased leptin levels 56-fold vs. CD+vehicle (6543.0 ± 3550.9 pg/mL vs. 116.7 ± 39.9 pg/mL, p =0.012); and 25-fold vs. CD+PCB 153 (254.9 ± 55.5 pg/mL, p =0.003) (Figure 7A). Compared to the large magnitude changes observed in plasma leptin levels, adiponectin levels were changed by a smaller amount (Figure 7B). Adiponectin levels were higher in HFD+vehicle (9.0 ± 0.9 μg/mL) vs. CD+vehicle (6.4 ± 0.3 μg/mL, p =0.002) and vs. CD+PCB 153 (6.6 ± 0.4 μg/mL, p = 0.034). Likewise, adiponectin levels were higher in HFD+PCB 153 (11.3 ± 1.1 μg/mL) vs. both CD+vehicle (p <0.001) and CD+PCB 153 (p <0.001). Two additional adipokines, resistin and tPAI-1, were also determined (Table 2). Resistin levels were significantly increased in HFD+PCB 153 (1360.0 ± 325.5 ng/mL) vs. HFD+vehicle (941.1 ± 310.9 ng/mL, p <0.001) and CD+vehicle (742.0 ± 134.4 ng/mL, p <0.001). Resistin levels were also significantly higher in HFD+vehicle vs. CD+vehicle (p =0.022). No differences were noted between CD+PCB 153 vs. any other group. Similarly, mean plasma tPAI-1was significantly increased in HFD+PCB 153 (533.4 ± 207.8 ng/mL) vs. HFD+vehicle (363.8 ± 142.8 ng/mL, p <0.001) and vs. CD+vehicle (152.5 ± 71.3 ng/mL, p <0.001). tPAI-1 levels were also significantly higher in HFD+vehicle vs. CD+vehicle (p <0.001).
Fig. 7.
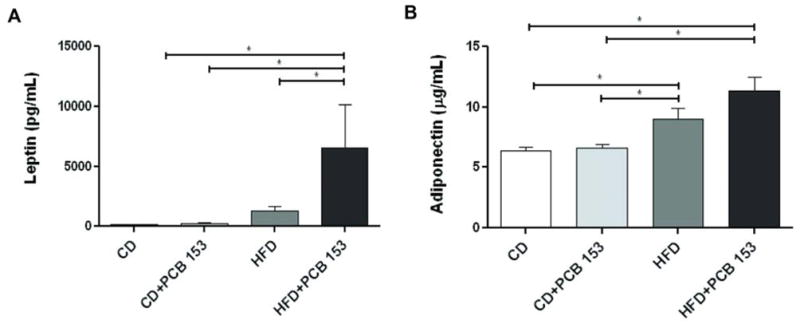
High fat diet and PCB 153 co-exposure led to serum adipokine dysregulation. Plasma levels of (A) leptin (pg/mL) and (B) adiponectin (μg/mL) were measured using the Luminex IS 100 system (n=10). * P <0.05. CD-control diet, HFD-high fat diet, PCB-polychlorinated biphenyl.
Table 2.
Plasma cytokines’ and adipokines’ levels.
| Adipocytokines | CD | CD+PCB 153 | HFD | HFD+PCB 153 |
|---|---|---|---|---|
| Resistin (ng/ mL) | 742.0 ± 134.4 | 838.0 ± 246.1 | 941.1 ± 310.9a | 1360.0 ± 325.5a,b |
| tPAI-1 (ng/mL) | 152.5 ± 71.3 | 218.0 ± 91.1 | 363.8 ± 142.8a | 533.4 ± 207.8a,b |
| TNFα (pg/mL) | 0.5 ± 0.5 | 0.6 ± 0.7 | 1.0 ± 1.4 | 0.6 ± 0.9 |
| IL-6 (pg/mL) | 3.8 ± 2.6 | 5.3 ± 5.8 | 12.7 ± 13.1 | 6.7 ± 8.1 |
| IL-10 (pg/mL) | 1.5 ± 0.3 | 1.4 ± 0.3 | 3.5 ± 3.3 | 2.7 ± 2.9 |
p <0.05 compared with mice fed control diet alone or co-administered with PCB 153.
p<0.05 compared with mice fed high fat diet alone. Values are mean ± SEM. CD-control diet, HFD-high fat diet, PCB-polychlorinated biphenyl, tPAI-1-tissue plasminogen activator inhibitor 1, TNFα-tumor necrosis factor alpha, IL-interleukin.
Plasma cytokines were measured and no change was observed in any of the animal groups for the pro-inflammatory cytokines TNFα and IL-6, and the anti-inflammatory cytokine IL-10 (Table 2). Therefore, HFD+PCB 153 co-exposures led to significant changes in adipokines including the adiponectin, leptin, resistin, and tPAI-1; but did not affect cytokines including TNFα, IL-6, or IL-10.
4. Discussion
The most striking result of this study was the synergistic interaction between PCB 153 and the high fat diet resulting in dramatically increased obesity and NAFLD. Historically, exposure to PCBs and the related molecule 2,3,7,8-tetrachlorodibenzo-p-dioxin (TCDD), an AhR ligand, have been associated with wasting syndromes in rodents [24–25]. In contrast, some epidemiologic studies reveal associations between PCB exposures and human obesity, metabolic syndrome, and NAFLD [2, 5–10]. These seemingly paradoxical findings could potentially be explained by differences in diets, PCB exposures, and differences between human and rodent PCB receptors including AhR, the constitutive androstane receptor (CAR), and the pregnane X receptor (PXR). The results of our rodent study are more consistent with the human epidemiologic data suggesting that PCB effects on obesity/NAFLD may depend more on nutritional interactions and PCB congener than species. Consistent with our previously published metabolomics findings [20], PCB 153 had no significant effect on any of the measured metabolic parameters in the absence of high fat feeding. Thus, we conclude that PCB 153 is a diet-dependent obesogen. Therefore, while PCBs have contaminated human food supplies for decades, they may have only recently begun to exert their effects in human populations with the relatively recent widespread consumption of calorie dense foods.
While the precise mechanism by which PCB 153 worsens obesity is still elusive, our data document abnormal adipocytokines with altered hepatic lipid metabolism including up-regulation of lipid biosynthesis gene expression coupled with down-regulation of beta oxidation genes, thus promoting lipid accumulation. Although visceral adiposity worsened, adipocyte hypertrophy did not occur. These findings are important because they implicate PCB 153 exposure in adipokine dysregulation, NAFLD, and visceral adiposity, hallmarks of the metabolic syndrome. Based on the positive results of this study, experiments utilizing metabolic cages and dual-energy X -ray absorptiometry scans to precisely quantitate changes in obesity over time are ongoing in our laboratory.
Despite changes in obesity and adipokines, PCB 153 was not associated with increased insulin resistance (HOMA-IR). However some alterations were observed in glucose handling. There was a non-significant trend towards higher GTT (AUC) with significantly lower fasting blood glucose levels in CD-fed mice co-administered with PCB 153 which theoretically could be explained by CAR activation [26]. Importantly, it was recently demonstrated that PCB 153 activates both CAR and PXR, and activation of these receptors may potentially modulate obesity and metabolic syndrome [27–28]. While PCB 153 was associated with human diabetes in adult NHANES [9], a more recent prospective human study determined that higher baseline levels of PCBs with greater than 7 chlorine atoms (and not PCB 153 that has six chlorines) were associated with the subsequent development of insulin resistance [29]. Therefore, it appears that the effects of PCBs on insulin resistance may be congener-specific. More work is required to understand interactions between PCB congeners and nuclear receptors in metabolic syndrome.
Concordant with the increase in obesity, PCB 153 worsened NAFLD in high fat fed-mice. Steatosis was dramatically increased by the combination of PCB 153+HFD, whereas PCB 153 had no effect in mice fed control diet. Steatosis is determined by the rates of lipid synthesis, oxidation, uptake, and export. RT-PCR data suggest that PCB 153+HFD co-exposures increased hepatic lipid synthesis (up-regulated FAS) while decreasing β-oxidation (down-regulated CPT1A and CPT2 and its transcription factor, PPARα). We believe that PCB 153 may have increased hepatic steatosis in mice fed HFD by altering adipokines, increasing hepatic lipid synthesis, and decreasing hepatic β-oxidation.
In contrast to steatosis, which increased considerably, hepatic necro-inflammation was only minimally increased by HFD+PCB 153. While mean plasma AST activity was significantly increased in this group, no significant changes were observed in ALT, necro-inflammation by histology, hepatic TNFα message levels, or plasma levels of TNFα, IL-6, or IL-10. Our previous epidemiological study found a dose-dependent association between plasma PCB levels and elevated ALT in adult NHANES subjects [5]. However, weaker associations were also noted between PCBs and elevated AST levels (unpublished data). PCB 153 was not associated with hepatic inflammation, although our preliminary in vitro studies showed that PCB exposures increased TNFα production from Raw 264.7 cells, a murine macrophage cell line [30]. However, these differences could be PCB congener/dose specific or related to differences between in vitro vs. in vivo systems.
Potential weaknesses of this study include a high PCB 153 dose and the i.p. route of administration. PCBs are known to concentrate within adipose tissue and liver, so it is not surprising that these were the principal target sites for PCB 153 toxicity in this study. Although PCB 153 levels were not measured, we expect them to be similar to those in the NTP TR 530 14-week study [16]. The NTP protocol resulted in the following PCB 153 levels: lipid adjusted serum-1788 ng/g; liver-34,010 ng/g; and adipose-1,118,300 ng/g. While tissue PCB levels are unknown in man, lipid adjusted serum levels ranging from 75–170 ng/g were reported in the NHANES and Anniston cohorts [5, 31]. Therefore, the PCB 153 dose in our study may have resulted in higher serum levels than that observed in human populations. However, it is extremely important to realize that even at this dose, PCB 153 had absolutely no observable effect on either obesity or NAFLD in the absence of high fat feeding. Therefore, we believe that the PCB-HFD interaction could be more important than the cumulative PCB dose. Nonetheless, cumulative dose and the i.p. route of administration must be acknowledged as potential limitations of this study. We plan to address these limitations in future research. Furthermore, our studies were performed using male mice; hence, it is important to note that the observed effects of PCB 153+HFD may vary with gender and species.
In conclusion, PCB 153 is a diet-dependent obesogen, which also worsens NAFLD via adipokine dysregulation and altered hepatic lipid metabolism. These experimental results suggest that the previously observed associations between PCB levels and human obesity/NAFLD may be causal. Nutrient-toxicant interactions in obesity, metabolic syndrome, and NAFLD/TASH warrant further study.
Acknowledgments
Financial Support: This research was supported in part by the National Institutes of Health 1R01ES021375-01 (M.C.), 5P20RR024489-02 (M.C., D.Y., D.J.C., A.B.), K23AA18399-01A (M.C.), 1P01AA017103-01 (C.M., M.C.), P30ES014443-01A1 (M.C.), T35ES014559 (B.G.), HL89038 (D.J.C.), and the Division of Loan Repayment (M.C.); the Commonwealth of Kentucky (M.C.), and Department of Veterans Affairs (M.C., C.M.).
The authors would like to acknowledge the support of the University of Louisville Diabetes and Obesity Center, the Alcohol Research Center, and the Center for Environmental Genomics and Integrative Biology.
Abbreviations
- AhR
aryl hydrocarbon receptor
- ALT
alanine transaminase
- AST
aspartate transaminase
- AUC
area under the curve
- CAR
constitutive androstane receptor
- CPT1A
carnitine palmitoyl transferase 1A
- CPT2
carnitine palmitoyl transferase
- CD
control diet
- FAS
fatty acid synthase
- GAPDH
glyceraldehyde-3-phosphate dehydrogenase
- GTT
glucose tolerance test
- HDL
high density lipoproteins
- H&E
hematoxylin–eosin
- HFD
high fat diet
- HOMA-IR
homeostasis model assessment of insulin resistance
- IL-6
interleukin-6
- IL-10
interleukin-10
- LDL
low density lipoproteins
- NAFLD
nonalcoholic fatty liver disease
- NHANES
national health and nutrition examination survey
- NTP
national toxicology program
- PCBs
polychlorinated biphenyls
- PCR
polymerase chain reaction
- POPs
persistent organic pollutants
- PPARα
peroxisome proliferator-activated receptor alpha
- PXR
pregnane X receptor
- SEM
standard error mean
- TASH
toxicant associated steatohepatitis
- TCDD
tetrachlorodibenzo-p-dioxin
- TNFα
tumor necrosis factor alpha
- tPAI-1
tissue plasminogen activator inhibitor 1
Footnotes
Conflict of Interest: The authors have no relevant conflict of interest to disclose.
Publisher's Disclaimer: This is a PDF file of an unedited manuscript that has been accepted for publication. As a service to our customers we are providing this early version of the manuscript. The manuscript will undergo copyediting, typesetting, and review of the resulting proof before it is published in its final citable form. Please note that during the production process errors may be discovered which could affect the content, and all legal disclaimers that apply to the journal pertain.
References
- 1.Cave M, Falkner KC, McClain CJ. Occupational and Environmental Liver Disease. In: Boyer T, Manns M, Sanyal A, editors. Zakim and Boyer’s Hepatology: A Textbook of Liver Disease 6ed. Philadelphia: Elsevier Saunders; 2011. pp. 476–92. [Google Scholar]
- 2.Cotrim HP, Andrade ZA, Parana R, Portugal M, Lyra LG, Freitas LA. Nonalcoholic steatohepatitis: a toxic liver disease in industrial workers. Liver. 1999;19:299–304. doi: 10.1111/j.1478-3231.1999.tb00053.x. [DOI] [PubMed] [Google Scholar]
- 3.Cave M, Falkner KC, Ray M, Joshi-Barve S, Brock G, Khan R, Bon Homme M, McClain CJ. Toxicant-associated steatohepatitis in vinyl chloride workers. Hepatology. 2010;51:474–81. doi: 10.1002/hep.23321. [DOI] [PMC free article] [PubMed] [Google Scholar]
- 4.Cave M, Falkner KC, Henry L, Costello B, Gregory B, McClain CJ. Serum cytokeratin 18 and cytokine elevations suggest a high prevalence of occupational liver disease in highly exposed elastomer/polymer workers. J Occup Environ Med. 2011;53:1128–33. doi: 10.1097/JOM.0b013e31822cfd68. [DOI] [PMC free article] [PubMed] [Google Scholar]
- 5.Cave M, Appana S, Patel M, Falkner KC, McClain CJ, Brock G. Polychlorinated biphenyls, lead, and mercury are associated with liver disease in american adults: NHANES 2003–2004. Environ Health Perspect. 2010;118:1735–42. doi: 10.1289/ehp.1002720. [DOI] [PMC free article] [PubMed] [Google Scholar]
- 6.Ronn M, Lind L, van Bavel B, Salihovic S, Michaelsson K, Lind M. Circulating Levels of Persistant Organic Pollutants Associate in Divergent Ways to Fat Mass Measured by DXA in Humans. The Toxicologist CD Supplement to Toxicological Sciences — An Official Journal of the Society of Toxicology. 2011:120. doi: 10.1016/j.chemosphere.2011.06.095. [DOI] [PubMed] [Google Scholar]
- 7.Lee DH, Lee IK, Porta M, Steffes M, Jacobs DR., Jr Relationship between serum concentrations of persistent organic pollutants and the prevalence of metabolic syndrome among non-diabetic adults: results from the National Health and Nutrition Examination Survey 1999–2002. Diabetologia. 2007;50:1841–51. doi: 10.1007/s00125-007-0755-4. [DOI] [PubMed] [Google Scholar]
- 8.Patel CJ, Bhattacharya J, Butte AJ. An Environment-Wide Association Study (EWAS) on type 2 diabetes mellitus. PLoS One. 2010;5:e10746. doi: 10.1371/journal.pone.0010746. [DOI] [PMC free article] [PubMed] [Google Scholar]
- 9.Lee DH, Lee IK, Song K, Steffes M, Toscano W, Baker BA, Jacobs DR., Jr A strong dose-response relation between serum concentrations of persistent organic pollutants and diabetes: results from the National Health and Examination Survey 1999–2002. Diabetes Care. 2006;29:1638–44. doi: 10.2337/dc06-0543. [DOI] [PubMed] [Google Scholar]
- 10.Uemura H, Arisawa K, Hiyoshi M, Kitayama A, Takami H, Sawachika F, Dakeshita S, Nii K, Satoh H, Sumiyoshi Y, Morinaga K, Kodama K, Suzuki T, Nagai M. Prevalence of metabolic syndrome associated with body burden levels of dioxin and related compounds among Japan’s general population. Environ Health Perspect. 2009;117:568–73. doi: 10.1289/ehp.0800012. [DOI] [PMC free article] [PubMed] [Google Scholar]
- 11.Yu ML, Guo YL, Hsu CC, Rogan WJ. Increased mortality from chronic liver disease and cirrhosis 13 years after the Taiwan “yucheng” (“oil disease”) incident. Am J Ind Med. 1997;31:172–5. doi: 10.1002/(sici)1097-0274(199702)31:2<172::aid-ajim6>3.0.co;2-1. [DOI] [PubMed] [Google Scholar]
- 12.Breivik K, Sweetman A, Pacyna JM, Jones KC. Towards a global historical emission inventory for selected PCB congeners--a mass balance approach. 1. Global production and consumption. Sci Total Environ. 2002;290:181–98. doi: 10.1016/s0048-9697(01)01075-0. [DOI] [PubMed] [Google Scholar]
- 13.Schecter A, Colacino J, Haffner D, Patel K, Opel M, Papke O, Birnbaum L. Perfluorinated Compounds, Polychlorinated Biphenyl, and Organochlorine Pesticide Contamination in Composite Food Samples from Dallas, Texas. Environ Health Perspect. 2010;118:796–802. doi: 10.1289/ehp.0901347. [DOI] [PMC free article] [PubMed] [Google Scholar]
- 14.Hennig B, Reiterer G, Toborek M, Matveev SV, Daugherty A, Smart E, Robertson LW. Dietary fat interacts with PCBs to induce changes in lipid metabolism in mice deficient in low-density lipoprotein receptor. Environ Health Perspect. 2005;113:83–7. doi: 10.1289/ehp.7280. [DOI] [PMC free article] [PubMed] [Google Scholar]
- 15.Lee JH, Wada T, Febbraio M, He J, Matsubara T, Lee MJ, Gonzalez FJ, Xie W. A novel role for the dioxin receptor in fatty acid metabolism and hepatic steatosis. Gastroenterology. 2010;139:653–63. doi: 10.1053/j.gastro.2010.03.033. [DOI] [PMC free article] [PubMed] [Google Scholar]
- 16.NTP. NTP Toxicology and Carcinogenesis Studies of a Binary Mixture of 3,3′,4,4′,5-Pentachlorobiphenyl (PCB 126) (CAS No. 57465-28-8) and 2,2′,4,4′,5,5′-Hexachlorobiphenyl (PCB 153) (CAS No. 35065-27-1) in Female Harlan Sprague-Dawley Rats (Gavage Studies) Natl Toxicol Program Tech Rep Ser. 2006:1–258. [PubMed] [Google Scholar]
- 17.NTP. NTP technical report on the toxicology and carcinogenesis studies of 2,2′,4,4′,5,5′-hexachlorobiphenyl (PCB 153) (CAS No. 35065-27-1) in female Harlan Sprague-Dawley rats (Gavage studies) Natl Toxicol Program Tech Rep Ser. 2006:4–168. [PubMed] [Google Scholar]
- 18.Hennig B, Ettinger AS, Jandacek RJ, Koo S, McClain C, Seifried H, Silverstone A, Watkins B, Suk WA. Using nutrition for intervention and prevention against environmental chemical toxicity and associated diseases. Environ Health Perspect. 2007;115:493–5. doi: 10.1289/ehp.9549. [DOI] [PMC free article] [PubMed] [Google Scholar]
- 19.Cave M, Deaciuc I, Mendez C, Song Z, Joshi-Barve S, Barve S, McClain C. Nonalcoholic fatty liver disease: predisposing factors and the role of nutrition. J Nutr Biochem. 2007;18:184–95. doi: 10.1016/j.jnutbio.2006.12.006. [DOI] [PubMed] [Google Scholar]
- 20.Shi X, Wahlang B, Wei X, Yin X, Falkner KC, Prough RA, Kim SH, Mueller EG, McClain CJ, Cave M, Zhang X. Metabolomic analysis of the effects of polychlorinated biphenyls in nonalcoholic Fatty liver disease. J Proteome Res. 2012;11:3805–15. doi: 10.1021/pr300297z. [DOI] [PMC free article] [PubMed] [Google Scholar]
- 21.Matthews DR, Hosker JP, Rudenski AS, Naylor BA, Treacher DF, Turner RC. Homeostasis model assessment: insulin resistance and beta-cell function from fasting plasma glucose and insulin concentrations in man. Diabetologia. 1985;28:412–9. doi: 10.1007/BF00280883. [DOI] [PubMed] [Google Scholar]
- 22.Bligh EG, Dyer WJ. A rapid method of total lipid extraction and purification. Can J Biochem Physiol. 1959;37:911–7. doi: 10.1139/o59-099. [DOI] [PubMed] [Google Scholar]
- 23.Livak KJ, Schmittgen TD. Analysis of relative gene expression data using real-time quantitative PCR and the 2(-Delta Delta C(T)) Method. Methods. 2001;25:402–8. doi: 10.1006/meth.2001.1262. [DOI] [PubMed] [Google Scholar]
- 24.NTP. NTP toxicology and carcinogenesis studies of 3,3′,4,4′,5-pentachlorobiphenyl (PCB 126) (CAS No. 57465-28-8) in female Harlan Sprague-Dawley rats (Gavage Studies) Natl Toxicol Program Tech Rep Ser. 2006:4–246. [PubMed] [Google Scholar]
- 25.NTP. Toxicology and carcinogenesis studies of 2,3′,4,4′,5-pentachlorobiphenyl (PCB 118) (CAS No. 31508-00-6) in female harlan Sprague-Dawley rats (gavage studies) Natl Toxicol Program Tech Rep Ser. 2010:1–174. [PubMed] [Google Scholar]
- 26.Kodama S, Koike C, Negishi M, Yamamoto Y. Nuclear receptors CAR and PXR cross talk with FOXO1 to regulate genes that encode drug-metabolizing and gluconeogenic enzymes. Mol Cell Biol. 2004;24:7931–40. doi: 10.1128/MCB.24.18.7931-7940.2004. [DOI] [PMC free article] [PubMed] [Google Scholar]
- 27.Gao J, Xie W. Targeting xenobiotic receptors PXR and CAR for metabolic diseases. Trends Pharmacol Sci. 2012 doi: 10.1016/j.tips.2012.07.003. [DOI] [PMC free article] [PubMed] [Google Scholar]
- 28.Al-Salman F, Plant N. Non-coplanar polychlorinated biphenyls (PCBs) are direct agonists for the human pregnane-X receptor and constitutive androstane receptor, and activate target gene expression in a tissue-specific manner. Toxicol Appl Pharmacol. 2012;263:7–13. doi: 10.1016/j.taap.2012.05.016. [DOI] [PubMed] [Google Scholar]
- 29.Lee DH, Steffes MW, Sjodin A, Jones RS, Needham LL, Jacobs DR., Jr Low dose organochlorine pesticides and polychlorinated biphenyls predict obesity, dyslipidemia, and insulin resistance among people free of diabetes. PLoS One. 6:e15977. doi: 10.1371/journal.pone.0015977. [DOI] [PMC free article] [PubMed] [Google Scholar]
- 30.Kershner N, Stocker A, Falkner KC, McClain CJ, Cave M. Polychlorinated Biphenols (PCB) Induce Tumor Necrosis Factor α (TNFα) Production IN RAW 264.7 Cells [abstract] The Toxicologist CD Supplement to Toxicological Sciences — An Official Journal of the Society of Toxicology. 2010;114(1):743A. [Google Scholar]
- 31.Goncharov A, Pavuk M, Foushee HR, Carpenter DO. Blood pressure in relation to concentrations of PCB congeners and chlorinated pesticides. Environ Health Perspect. 2011;119:319–25. doi: 10.1289/ehp.1002830. [DOI] [PMC free article] [PubMed] [Google Scholar]