Abstract
Background:
Pulmonary function tests (PFTs) need to be revisited in light of rapid economic growth and industrial development. Questions have been raised about the validity of existing population-specific norms for predicting PFTs, and therefore, the present study aimed to determine the applicability of existing norms for PFTs in young healthy non-smoking male university students of Kolkata.
Methods:
PFTs were carried out for 87 non-smoking male university students who were randomly sampled from the University of Calcutta, Kolkata, India.
Results:
The PFTs data obtained in this study did not show a significant variation with that obtained in a previous study. Significant (P < 0.001) differences in the forced expiratory volume in 1 s (FEV1%) and peak expiratory flow rate (PEFR) between the two studies may be attributed to differences in the age and body height, which exhibited significant correlations with the vital capacity (VC), forced vital capacity (FVC), FEV1, FEV1%, and PEFR. Regression equations have been computed to predict PFTs parameters from age and body height.
Conclusion:
Pulmonary function in the university students of Kolkata was found to have remained mostly unchanged in the last 24 years. The equations computed in this study are considered preferable owing to their substantially smaller standard error of estimate (SEE) than those proposed in the previous study.
Keywords: FEV1%, FVC, Indian, PEFR, Pulmonary function
Introduction
Pulmonary function tests (PFTs) have evolved from tools for conducting physiological studies to clinical tools for the diagnosis, management, and follow-up of respiratory diseases because they can be used to provide objective information about the status of an individual’s respiratory system (1). Spirometric tests are useful not only for estimating the severity of airway obstruction but also for assessing the functional degradation of the pulmonary system and evaluating the results of various therapeutic regimens. Reference values for spirometry tests have been reported for European (2–6), North American (7–9), Indian subcontinent (1,10–19), Chinese (20–22), Malaysian (23–27), and other non-Caucasian (28,29) populations.
PFTs are affected by factors including diet, obesity, air pollution, and physical activity level (30). In the last two decades, rapid economic growth and development worldwide has resulted in an improvement in people’s nutritional status. At the same time, air pollution levels have increased and people’s physical activity levels have decreased. As such, lung function norms need to be revisited to account for socioeconomic development, environmental factors, and lifestyle changes that influence the normative values even within a single generation within an ethnic group living in the same geographical region (30). However, in the last five decades, the anthropometric data of young adults have changed significantly owing to factors such as increasing body height and body mass index; therefore, whether previously reported population-specific norms for the prediction of PFTs remain valid is a commonly asked question (31).
Chatterjee et al., (14) studied the pulmonary function of healthy non-smoking men (age: 20–59 years) in Kolkata, India, more than two decades back. The present study has the following objectives.
a. Determine the lung function parameters of normal young healthy non-smoking male university students in Kolkata, India.
b. Compare the lung function measurements with previously reported data for similar and different populations.
c. Derive equations for predicting the lung volumes of the currently studied population and compare these equations with the norms reported previously by Chatterjee et al., (14).
Methods
Selection of subjects
Eighty seven non-smoking male university students (age: 19–24 years) with similar socioeconomic background were randomly sampled from the post-graduate section of the University of Calcutta, Kolkata, India to conduct this cross-sectional study. The sample size was calculated according to Dupont and Plummer’s method (32), and the confidence interval (CI) was set as 95%. The study was conducted with 87 subjects, which was greater than the computed sample size of 62. According to Jones et al.’s proposal (30), the data collection was limited to young male university students over a restricted time frame to limit inter-individual differences due to age and time of year.
Each subject filled up one questionnaire (33) to record their personal demographic data and health status, and to give consent to participate in this study. Students who exercised regularly or who had a history of or currently had obstructive or restrictive types of respiratory diseases and were taking treatment for the same were excluded from this study. The experimental protocol was explained and demonstrated to all the volunteers to allay their apprehensions. Each subject signed the written informed consent form. Ethical clearance was obtained from the Human Ethics Committee, Department of Physiology, University of Calcutta.
Preparation of subjects
The age of each subject was calculated to the nearest year from the date of birth as obtained from the University records. The body height was measured with the subject standing barefoot with an accuracy of +0.50 cm, and the body mass was measured to an accuracy of +0.1 kg by using a weight measuring instrument fitted with a height measuring rod (Avery India Ltd., India) with the subject wearing minimum clothing. The body surface area (BSA) was calculated using DuBois and DuBois’s equation (34).
Determination of dynamic pulmonary function measurements
The dynamic pulmonary functions were recorded on a 9-L closed-circuit-type expirograph (Toshniwal Technologies Pvt. Ltd., India). The parameters measured were the tidal volume (TV), vital capacity (VC), forced vital capacity (FVC), forced expiratory volume in 1 s (FEV1), FEV1 as a percentage of FVC (FEV1%), mid expiratory flow rate (FEF25-75%), and forced expiratory time (FET). The peak expiratory flow rate (PEFR) was recorded using a Wright peak flow meter. The expirograph was calibrated daily using a Palmer respiratory hand pump. All the measurements were conducted according to Chatterjee et al., (14). The subjects were encouraged and motivated to attain the maximum possible effort. These tests were recorded at noon before lunch because the expiratory flow rates are highest at noon (35). For each volunteer, three satisfactory efforts were recorded with at least 3–5 minutes rest between the consecutive trials as per the standard norm (15). After a couple of practice runs, at least three trials were conducted, and the highest value among these was accepted (14,36). All pulmonary function measurements were performed at body temperature and pressure saturated with water vapour (BTPS). In one subject, all the records, i.e. anthropometric measurements and recording of pulmonary function measurements, were conducted in one sitting on the same day.
Statistical analysis
Data were expressed as mean (SD). Student’s one-sample t test was adopted to compare the pulmonary function measurements and physical parameters of the subjects with the mean values of similar parameters reported by Chatterjee et al., (14). Pearson’s product-moment correlation coefficient (r) was computed to test the significant relationship between two parameters. Regression analysis was adopted to compute the prediction norms for predicting pulmonary function measurements from different physical parameters. The level of significance was set at P < 0.05.
Results
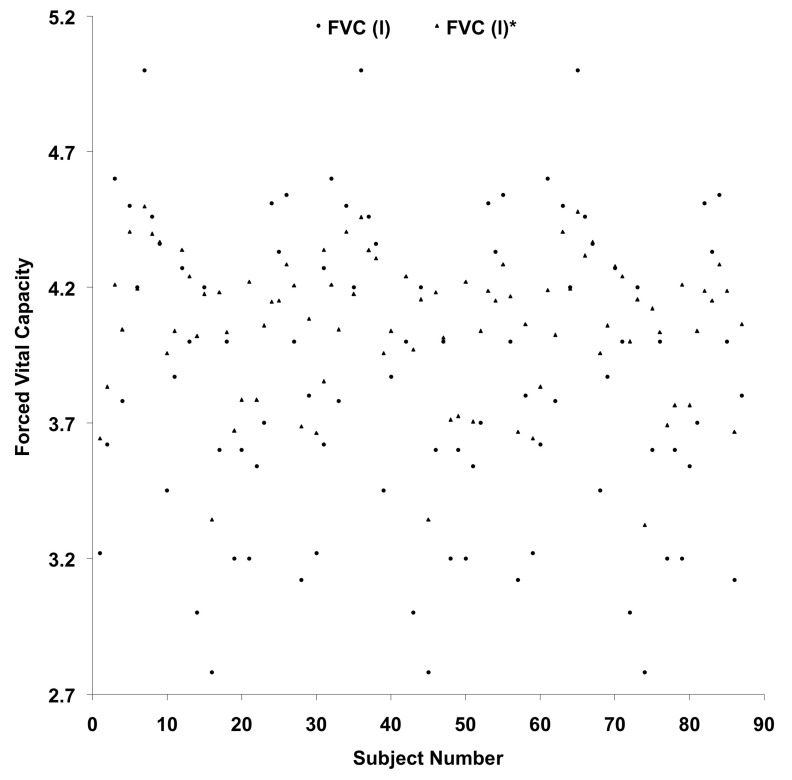
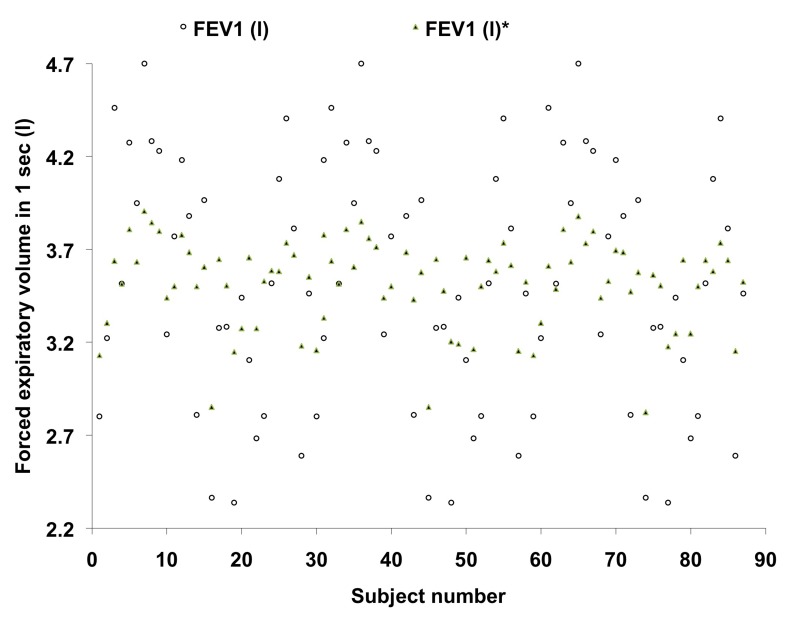
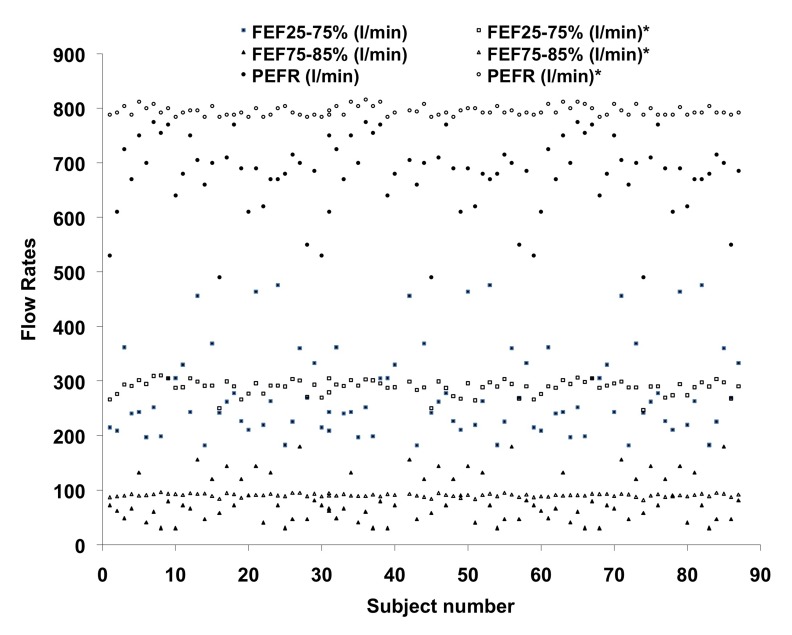
The mean (SD) age of the subjects in the present study is 21.74 years (SD 2.14). The values of other pulmonary function measurements recorded in the present study and reported in an earlier investigation conducted in a similar population by Chatterjee et al., (14) are tabulated in Table 1. A similar finding was observed when the values obtained in the present investigation were compared with the computed values from the regression norms proposed by Chatterjee et al., (14). Table 1 shows that FEV1% and PEFR (l.min-1) were significantly (P < 0.01) different than those reported by Chatterjee et al., (14).
Table 1.
Values of physical parameters and pulmonary function measurements
| Body Mass (kg) | Body Height (cm) | BSA (m2) | BMI (kg/m2) | TV (ml) | VC (l) | FVC (l) | FEV1 (l) | FEV1% (%) | FEF25-75% (l.min-1) | FEF75-85% (l.min-1) | PEFR (l.min-1) | |
|---|---|---|---|---|---|---|---|---|---|---|---|---|
| Present study (N = 87) | 58.34 (9.92) | 173.23 (5.96) | 1.65 (0.13) | 20.86 (2.18) | 587.24 (71.27) | 4.12 (0.58) | 3.87 (0.55) | 3.53 (0.66) | 90.68 (7.38) | 280.25 (82.19) | 80.58 (31.53) | 678.39 (69.37) |
| Chatterjee et al. (14) (N = 45) | 56.0 (5.34) | 167.40 (4.54)** | 1.626 (0.08) | 4.07 (0.50) | 4.05 (0.50) | 3.50 (0.46) | 86.70 (6.23)* | 290.00 (76.00) | 88.70 (27.40) | 607.00 (57.17)** |
Values are Mean (SD), *P < 0.01 and **P < 0.001 using student’s one-sample t test.
The body mass exhibited an insignificant correlation with pulmonary function measurements although age and body height were significantly correlated with VC, FVC, FEV1, FEV1%, and PEFR in the present study (Table 2). Simple and multiple regression equations have been computed for predicting the pulmonary functions in the studied population (Tables 3 and 4).
Table 2.
Values of correlation coefficients between pulmonary function measurements and physical parameters in male university students
| Age (years) | Body height (cm) | Body mass (kg) | |
|---|---|---|---|
| VC (l) | 0.75* | 0.89* | 0.17 |
| FVC (l) | 0.69* | 0.84* | 0.18 |
| FEV1 (l) | 0.71* | 0.87* | –0.08 |
| FEV1% (%) | 0.42* | 0.57* | 0.12 |
| FEF25-75% (l/min) | 0.12 | 0.26 | 0.08 |
| FEF75-85% (l/min) | 0.08 | 0.17 | 0.02 |
| PEFR (l/min) | 0.60* | 0.88* | 0.18 |
*P < 0.001.
Table 3.
Simple regression norms for the prediction of pulmonary function measurements from age and body height in the studied population
| Pulmonary Function Measurement | Regression Equation | R | R2 | SEE |
|---|---|---|---|---|
| VC (l) | VC = 0.206 A – 0.3558 | 0.75 | 0.56 | 0.38 |
| FVC (l) | FVC = 0.179 A – 0.0186 | 0.69 | 0.48 | 0.39 |
| FEV1 (l) | FEV1 = 0.219 A – 1.2328 | 0.71 | 0.50 | 0.46 |
| FEV1% (%) | FEV1% = 1.452 A + 59.106 | 0.42 | 0.18 | 6.74 |
| PEFR (l.min-1) | PEFR = 19.57 A + 252.78 | 0.60 | 0.36 | 55.61 |
| VC (l) | VC = 0.087 H – 10.45 | 0.89 | 0.79 | 0.27 |
| FVC (l) | FVC = 0.077 H – 9.03 | 0.84 | 0.70 | 0.30 |
| FEV1 (l) | FEV1 = 0.096 H – 12.48 | 0.87 | 0.76 | 0.33 |
| FEV1% (%) | FEV1% = 0.702 H – 26.78 | 0.57 | 0.32 | 6.12 |
| PEFR (l.min-1) | PEFR = 10.287 H – 1142.10 | 0.88 | 0.77 | 32.63 |
Abbreviation: A = Age, H = Body height, SEE = standard error of estimate.
Table 4.
Multiple regression norms for the prediction of pulmonary function measurements in the studied population
| Pulmonary Function Measurement | Regression Equation | R | R2 | SEE |
|---|---|---|---|---|
| VC (l) | VC = 0.0511 A + 0.0728 H – 9.1652 | 0.90 | 0.81 | 0.262 |
| FVC (l) | FVC = 0.0352 A + 0.068 H – 8.2668 | 0.84 | 0.71 | 0.293 |
| FEV1 (l) | FEV1 = 0.0405 A + 0.0854 H – 11.6318 | 0.87 | 0.76 | 0.321 |
| FEV1% (%) | FEV1% = –0.0586 A + 0.7216 H – 28.7192 | 0.57 | 0.32 | 0.323 |
| PEFR (l.min-1) | PEFR = –4.4409 A + 11.4414 H – 1138.4102 | 0.88 | 0.78 | 32.53 |
Abbreviation: A = Age, H = Body height, SEE = standard error of estimate.
Discussion
The values of the different pulmonary function parameters considered in this study are within the normal range. A comparison of the pulmonary function measurements of the present study with those of a foreign population is quite difficult owing to variations in anthropometric profiles that largely affect the lung function measurements (27). Therefore, according to Bandyopadhyay (27), the values of pulmonary function measurements reported in other studies were standardized age and height for a valid comparison.
FEV1% and PEFR recorded in the present investigation were significantly different from those reported by Chatterjee et al., (14), whereas the remaining parameters of pulmonary function measurements did not show any significant variation. The variation in FEV1% and PEFR was indicative of the changes in those parameters in university students of Kolkata over the last 24 years. The influence of instrumentation, standardization, and testing procedures does not arise in the present context because both studies have been conducted in the same laboratory using the same instruments and experimental protocol. However, one explanation might be that the age range was higher in Chatterjee et al.’s study (14), that showed a significant negative correlation between age and pulmonary function measurement parameters. Another probable explanation is that pulmonary function variables are directly proportional to a subject’s body height (37), which is significantly higher in the present study than in Chatterjee et al.’s study (14). Perhaps, the deleterious effects of increased industrialization and urbanization on pulmonary health outweighed the cumulative beneficial effects of physical activity and nutrition in the present population, who in turn exhibited significantly higher values of a few indices of pulmonary function (i.e., FEV1% and PEFR) than in Chatterjee et al.’s study (14). Furthermore, with the improvement in socioeconomic status as well as continuous health promotion campaigns organized by the governmental and non-governmental sectors, it may be expected that the health status of the studied population has improved in the last 24 years.
The pulmonary function measurements showed higher values than those in the case of the male populations of South India (38), Eastern India (14), Nepal (39), and West Pakistani workers in the UK (40). However, FVC was lower than that of age-matched Europeans (4,5), Americans (41), and Senegalese (29). The precise reason for these inter-ethnic differences is uncertain although it has been attributed to both genetic and environmental factors (14). Anthropometric variations might explain some of these differences considering the fact that the physical stature of Westerners on average is somewhat larger than that of Asians (23). The specific reason for the existence of differences in pulmonary function variables in different healthy populations is uncertain, although they may be attributable to sociodemographic factors, e.g. ethnicity, habitat, and anthropometric characteristics. (27). FVC and FEV1 values were higher than previously reported values among Malaysians (23,24). Such a difference might be attributed to the variation in habitat, ethnicity, and sociodemographic nature (15).
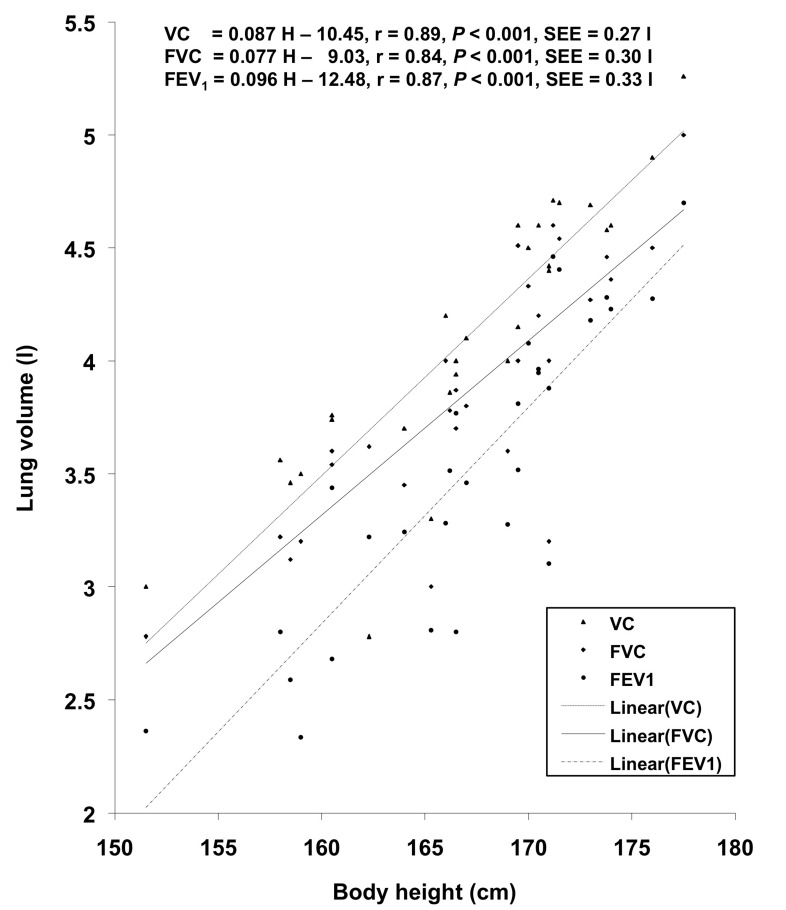
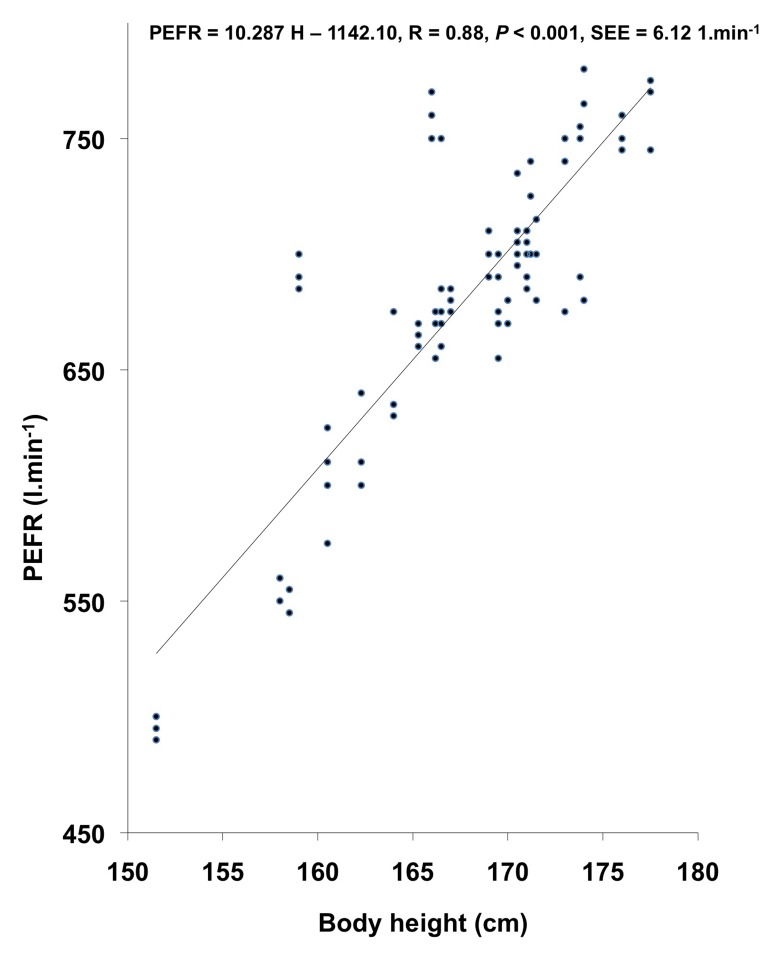
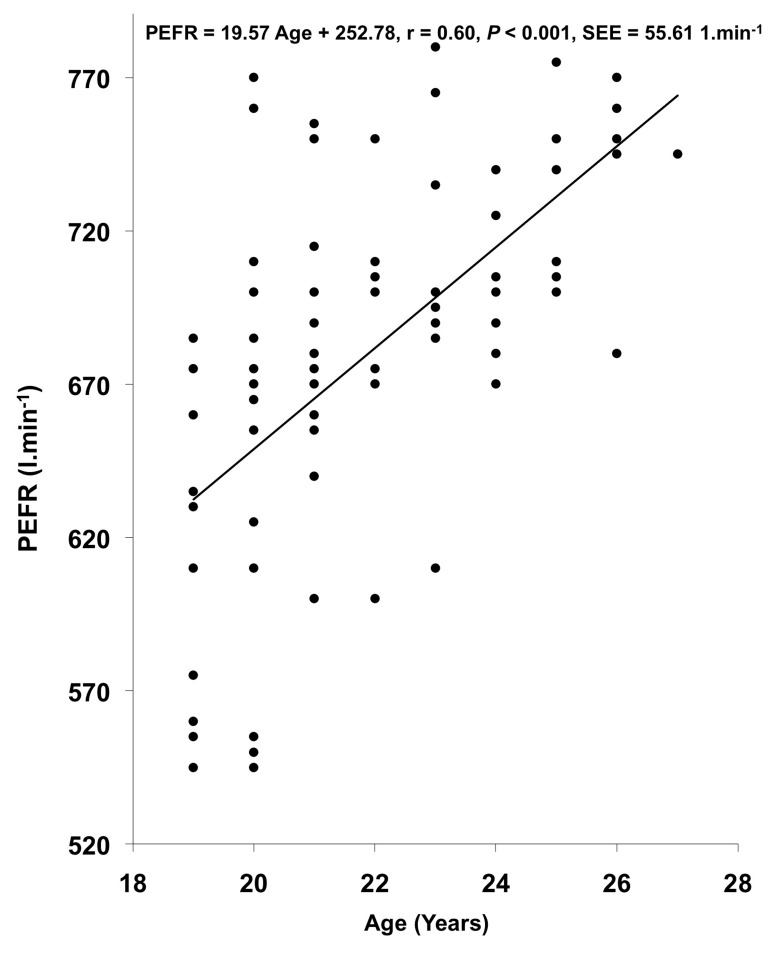
VC, FVC, FEV1, FEV1%, and PEFR exhibited significant correlation with age and body height. In other studies (14,19,23,24,42), age showed a significant negative correlation with pulmonary function measurements whereas in the present investigation, age showed a significant positive correlation with VC, FVC, FEV1, and FEV1%. This might be attributed to the smaller age range in the present investigation, as also reported by (27). The regression equations for predicting the pulmonary function measurements from physical parameters in the studied population have been computed on the basis of the existence of significant positive correlation between physical parameters and pulmonary function measurements; these regression lines have been plotted in Figures 1, 2, and 3.
Figure 1:
Relationship of body height with VC, FVC, and FEV1 in the studied population.
Figure 2:
Relationship of body height with PEFR in the studied population.
Figure 3:
Relationship of age with PEFR in the studied population.
FEV1% was within the normal range, indicating that subjects do not have obstructive pulmonary diseases. The value of FEV1% was in agreement with that of previous findings from different Indian and overseas populations. FEF25-75% did not show any significant correlation with physical parameters although PEFR, which is considered one of the most significant parameters indicating one’s pulmonary function status (19), showed significant positive correlation with age and body height.
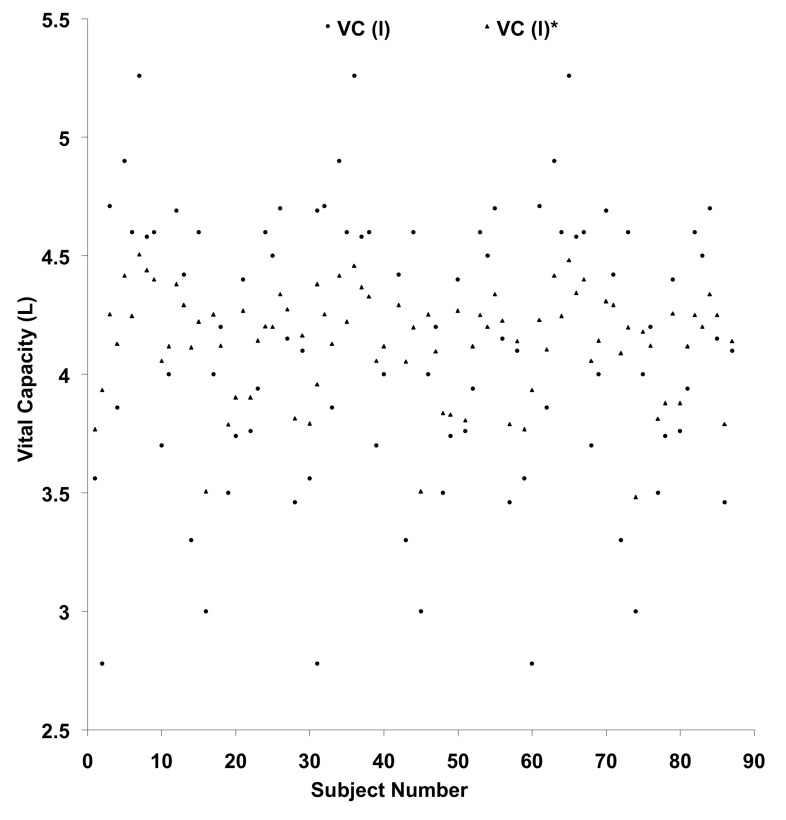
Simple and multiple regression equations have been computed to use as norms for predicting FVC, FEV1, and PEFR from the age and body height in the studied population. The standard errors of estimate (SEE) of the computed equations are sufficiently small to recommend these norms for practical use in epidemiological studies and also in clinical settings. The prediction of different lung volumes from currently derived equations and Chatterjee et al.’s equations (14) have been plotted in Figures 4, 5, 6, and 7.
Figure 4:
Plotting of vital capacity – comparison with the values predicted from currently derived equation and the standard norms proposed by Chatterjee et al., (1988).
Figure 5:
Plotting of forced vital capacity – comparison with the values predicted from currently derived equation and the standard norms proposed by Chatterjee et al., (1988).
Figure 6:
Plotting of forced expiratory volume in 1 sec – comparison with the values predicted from currently derived equation and the standard norms proposed by Chatterjee et al., (1988).
Figure 7:
Plotting of FEF25-75%, FEF75-85% and PEFR – comparison with the values predicted from the standard norms prescribed by Chatterjee et al. (1988).
The SEE of the simple and multiple regression equations computed from the present observation were almost 50% smaller than the earlier reported norms computed by Chatterjee et al., (14). This finding indicated that the regression equations computed from the present investigation would predict pulmonary function measurements more precisely and accurately in the studied population.
Conclusion
From the present investigation, it can be concluded that the pulmonary function of the university students of Kolkata, India, is within the normal range. FEV1% and PEFR have improved in this population relative to those in the previous study conducted by Chatterjee et al., (14) in 1988; i.e., 24 years back. The percentage of change in these two parameters was 4.6% and 11.7%, respectively. The remaining parameters did not show any significant change between the two studies. The SEE of the presently computed norms were substantially smaller than those reported by Chatterjee et al., (14), and therefore, these equations are considered suitable for a more precise and accurate prediction of pulmonary function measurements in the studied population.
Acknowledgments
Authors acknowledge the support of the participants to complete the study.
Footnotes
Conflict of interest
Authors do not have any conflict of interest.
Authors’ contributions
Conception and design, critical revision of the article for the important intellectual content and final approval of the article: AB, RD, SP
Analysis and interpretation of the data: AB, IB
Drafting of the article: AB, IB, RD, SP
Administrative, technical or logistic support: AB, IB, SP
Obtaining of funding: SP
Statistical expertise and collection and assembly of data: AB
References
- 1.Bandyopadhyay A, Tripathy S, Kamal RB, Basak AK. Peak expiratory flow rate in college students of Bareilly in Uttar Pradesh, India. Ind Biol. 2007;39(1):71–75. [Google Scholar]
- 2.Bergland E, Birath G, Bjure J. Spirometric studies in normal subjects. Forced expirograph in subjects 7 and 70 years of age. Acta Med Scand. 1963;173(2):185–192. [PubMed] [Google Scholar]
- 3.Cotes JE, Rossiter CE, Higgins ITT, Gilson JC. Average normal values for the forced expiratory volume in white Caucasian males. BMJ. 1966;1(5494):1016–1019. doi: 10.1136/bmj.1.5494.1016. [DOI] [PMC free article] [PubMed] [Google Scholar]
- 4.Quanjer PH. Standardised lung function testing. 5. Vol. 19. Luxembourg (LU): Bull Eur Physiopathol Resp; 1983. pp. 1–95. [PubMed] [Google Scholar]
- 5.Roca J, Sanchis J, Augusti-Vidal A. Spirometric reference values from a Mediterranean population. Bull Eur Physiopathol Resp. 1986;22(3):217–224. [PubMed] [Google Scholar]
- 6.Oxhj H, Jeppesen GM, Larson VH, Jorgensen B. Spirometry in healthy adult never-smokers. Clin Physiol. 1988;8(4):329–339. doi: 10.1111/j.1475-097x.1988.tb00276.x. [DOI] [PubMed] [Google Scholar]
- 7.Kory RC, Challahan R, Boren HG, Syner JC. The veterans administration army cooperative study of pulmonary function: Clinical spirometry in normal men. Am J Med. 1961;30(2):243–258. doi: 10.1016/0002-9343(61)90096-1. [DOI] [PubMed] [Google Scholar]
- 8.Cherniack RM, Raber MB. Normal standards for ventilatory functions using automated wedge spirometer. Am Rev Resp Dis. 1972;106(1):38–46. doi: 10.1164/arrd.1972.106.1.38. [DOI] [PubMed] [Google Scholar]
- 9.Dockery DW, Ware JH, Ferris BG. Distribution of forced expiratory volume in one second and forced vital capacity in healthy, white, adult never-smokers in six US cities. Am Rev Resp Dis. 1985;13(4):511–520. doi: 10.1164/arrd.1985.131.4.511. [DOI] [PubMed] [Google Scholar]
- 10.Rao MN, Gupta AS, Saha PN, Devi SA. Physiological norms in Indians: Pulmonary capacities in health. Indian J Med Res. 1961;38(Suppl):S1–S104. [PubMed] [Google Scholar]
- 11.Cotes JE, Malhotra MS. Differences in lung functions between Indians and Europeans. J Physiol. 1964;77(1):17–18. [Google Scholar]
- 12.Jain SK, Ramiah TJ. Normal standards of pulmonary function tests for healthy Indian men 15–40 years old. Indian J Med Res. 1969;57(8):1453–1466. [PubMed] [Google Scholar]
- 13.Malik SK, Jindal SK. Pulmonary function tests in healthy children. Indian Ped. 1985;22(9):677–681. [PubMed] [Google Scholar]
- 14.Chatterjee S, Saha D, Chatterjee BP. Pulmonary function studies in healthy non-smoking men of Calcutta. Ann Hum Biol. 1988;15(5):365–374. doi: 10.1080/03014468800009841. [DOI] [PubMed] [Google Scholar]
- 15.Chatterjee S, Mandal A. Pulmonary function studies in health school boys of West Bengal. Jpn J Physiol. 1991;41(5):797–808. doi: 10.2170/jjphysiol.41.797. [DOI] [PubMed] [Google Scholar]
- 16.Pande JN, Verma SK, Singh SPN, Guleria R, Khilnani GC. Respiratory pressures in normal Indian subjects. Ind J Chest Dis Allied Sci. 1998;40(4):251–256. [PubMed] [Google Scholar]
- 17.Virani N, Shah B, Celly A. Pulmonary function studies in healthy non-smoking adults in Sri Aurobindo Ashram, Pondicherry. Indian J Med Res. 2001;114(5):177–184. [PubMed] [Google Scholar]
- 18.Mandal A. Peak expiratory flow rates of school going girls from West Bengal. Ind Biol. 2002;34(2):41–45. [Google Scholar]
- 19.Bandyopadhyay A, Basak AK, Tripathy S, Bandyopadhyay P. Peak expiratory flow rate in female brick field workers of West Bengal, India. Ergonomics SA. 2006;18(1):22–27. [Google Scholar]
- 20.Wu M-C, Yang S-P. Pulmonary function studies in healthy Chinese. J Formos Med Assoc. 1962;61(2):110–131. [PubMed] [Google Scholar]
- 21.Chuan PS, Chia M. Respiratory function tests in normal adult Chinese in Singapore. Singapore Med J. 1969;10(4):265–271. [PubMed] [Google Scholar]
- 22.Da Costa JL. Pulmonary function studies in healthy Chinese adults in Singapore. Am Rev Resp Dis. 1971;104(1):128–131. doi: 10.1164/arrd.1971.104.1.128. [DOI] [PubMed] [Google Scholar]
- 23.Singh R, Singh HJ, Sirisinghe RG. Spirometric volumes in Malaysia males. South Eastern Asian J Tr Med. 1994;25(2):341–348. [PubMed] [Google Scholar]
- 24.Singh R, Singh HJ, Sirisinghe RG. Spirometric volumes in Malaysia males. Jap J Physiol. 1992;42(3):407–414. doi: 10.2170/jjphysiol.42.407. [DOI] [PubMed] [Google Scholar]
- 25.Omar BH, Henry RL. Ethnic differences in normal spirometric lung function of Malaysian children. Resp Med. 1994;88(5):349–356. doi: 10.1016/0954-6111(94)90040-x. [DOI] [PubMed] [Google Scholar]
- 26.Omar AH, Henry RL. Peak expiratory flow rate of Malaysian children. Med J Malaysia. 1991;46(1):8287. [PubMed] [Google Scholar]
- 27.Bandyopadhyay A. Pulmonary function studies in young healthy Malaysians of Kelantan, Malaysia. Indian J Med Res. 2011;134(5):653–657. doi: 10.4103/0971-5916.90990. [DOI] [PMC free article] [PubMed] [Google Scholar]
- 28.Johannsen ZM, Erasmus LD. Clinical spirometry in normal Bantu. Am Rev Resp Dis. 1968;97(4):985–997. doi: 10.1164/arrd.1968.97.4.585. [DOI] [PubMed] [Google Scholar]
- 29.Dufétel P, Pigearias B, Lonsdorfer J, Derossi DC, Faltot PJ. Spirometric reference values in Senegalese black adults. Eur Resp J. 1989;2(4):352–358. [PubMed] [Google Scholar]
- 30.Jones AY, Dean E, Lam PK, Lo SK. Discordance between lung function of Chinese university students and 20-year-old established norms. Chest. 2005;128(3):1297–1303. doi: 10.1378/chest.128.3.1297. [DOI] [PubMed] [Google Scholar]
- 31.Marek W, Marek EM, Muckenhoff K, Smith JH, Degens P, Kalhoff H, et al. Lung function in young adults: which references should be taken? Al Ameen J Med Sci. 2010;3(4):272–283. [Google Scholar]
- 32.Dupont WD, Plummer WD Jr. Power and sample size calculation for studies involving linear regression. Control Clin Trials. 1998;19(6):589–601. doi: 10.1016/s0197-2456(98)00037-3. [DOI] [PubMed] [Google Scholar]
- 33.American Thoracic Society Standard questionnaires on respiratory symptoms, tests of pulmonary function and chest radiographs. Am Rev Res Dis. 1978;118(1):10–23. [Google Scholar]
- 34.DuBois D, DuBois EF. Clinical Calorimetry: A formula to estimate approximate surface area if height and weight be known. Arch Int Med. 1916;17(6):863–871. [Google Scholar]
- 35.Hetzel MR. The pulmonary clock. Thorax. 1981;36(7):481–486. doi: 10.1136/thx.36.7.481. [DOI] [PMC free article] [PubMed] [Google Scholar]
- 36.Gregg I, Nunn AJ. Peak expiratory flow rate in normal subjects. Br Med J. 1973;3(5874):282–284. doi: 10.1136/bmj.3.5874.282. [DOI] [PMC free article] [PubMed] [Google Scholar]
- 37.Hochberg Y, Benjamini Y. More powerful procedure for multiple significance testing. Stat Med. 1990;9(7):811–818. doi: 10.1002/sim.4780090710. [DOI] [PubMed] [Google Scholar]
- 38.Kamat SR, Thiruvengadam KV, Rao TL. A study of pulmonary function among Indians & assessment of the Wright peak flow meter in relation to spirometry for field test. Am Rev Resp Dis. 1967;96(4):707–716. doi: 10.1164/arrd.1967.96.4.707. [DOI] [PubMed] [Google Scholar]
- 39.Bingham CRM, Veale KEA. Ventilatory capacity in healthy Nepalese. J Physiol. 1976;265(1):31P–32P. [PubMed] [Google Scholar]
- 40.Malik MA, Moss E, Lee WR. Prediction values for the ventilatory capacity in male West Pakistani workers in the United Kingdom. Thorax. 1972;27(5):611–619. doi: 10.1136/thx.27.5.611. [DOI] [PMC free article] [PubMed] [Google Scholar]
- 41.Miller A, Thornton JC, Warshaw R, Bernstein J, Selikoff IJ, Teirstein AS. Mean and instantaneous expiratory flows, FVC and FEV1: prediction equations from a probability sample of Michigan, a large industrial state. Bull Eur Physipathol Resp. 1986;22(6):589–597. [PubMed] [Google Scholar]
- 42.Paoletti P, Pistelli G, Fazzi P. Reference values for vital capacity and flow volume curves from a general population study. Bull Eur Physiopathol Resp. 1986;22(5):451–459. [PubMed] [Google Scholar]


