

Abstract
Objective
Cochlear implantation has become the mainstay of treatment for children with severe-to-profound sensorineural hearing loss (SNHL). Yet, despite mounting evidence on the clinical benefits of early implantation, little data are available on the long-term societal benefits and comparative effectiveness of this procedure across various ages of implantation--a choice parameter for parents and clinicians with high prognostic value for clinical outcome. As such, the aim of the current study is to evaluate a model of the consequences of the timing of this intervention from a societal economic perspective. Average cost-utility of pediatric cochlear implantation by age at intervention will be analyzed.
Design
Prospective, longitudinal assessment of health-utility and educational placement outcomes in 175 children recruited from 6 US centers between November 2002 and December 2004, who had severe-to-profound SNHL onset within 1 year of age, underwent cochlear implantation before 5 years of age, and had up to 6 years of post-implant follow-up that ended in November 2008 to December 2011. Costs of care were collected retrospectively and stratified by pre-operative, operative, and post-operative expenditures. Incremental costs and benefits of implantation were compared between the three age groups and relative to a non-implantation baseline.
Results
Children implanted at <18 months of age gained an average of 10.7 QALYs over their projected lifetime as compared to 9.0 and 8.4 QALYs for those implanted between 18 and 36 months and at >36 months of age, respectively. Medical and surgical complication rates were not significantly different between the 3 age groups. Additionally, mean lifetime costs of implantation were similar between the 3 groups, at approximately $2,000/child/year (77.5 year life expectancy), yielding costs of $14,996, $17,849, and $19,173 per QALY for the youngest, middle, and oldest implant age groups, respectively. Full mainstream classroom integration rate was significantly higher in the youngest group at 81% as compared to 57% and 63% for the middle and oldest groups, respectively (p<0.05) after six years of follow-up. After incorporating lifetime educational cost savings, cochlear implantation led to net societal savings of $31,252, $10,217, and $6,680 for the youngest, middle, and oldest groups at CI, respectively, over the child’s projected lifetime.
Conclusions
Even without considering improvements in lifetime earnings, the overall cost-utility results indicate highly favorable ratios. Early (<18 months) intervention with cochlear implantation was associated with greater and longer quality of life improvements, similar direct costs of implantation, and economically-valuable improved classroom placement, without a greater incidence of medical and surgical complications when compared to cochlear implantation at older ages.
Keywords: cost utility, comparative effectiveness, pediatric cochlear implants, age at implantation, classroom placement, health-related quality of life, post-operative complications, CDaCI
INTRODUCTION
Hearing loss is the most common sensory deprivation in developed countries, with severe-to-profound sensorineural hearing loss (SNHL) affecting 1 in 1,000 children born in the US (Smith, Bale, & White, 2005). The lifetime cost of onset of deafness before a child acquires speech and language capabilities (approximately 3 years of age) exceeds $1 million per child and currently affects as many as 60,000 children (Blanchfield, Feldman, Dunbar et al., 2001; Mohr, Feldman, & Dunbar, 2000). Cochlear implantation (CI) has been shown to be highly effective in treating deafness, with significantly improved spoken language and auditory outcomes observed at earlier ages of implantation (Holt & Svirsky, 2008; McConkey Robbins, Koch, Osberger, Zimmerman-Phillips et al., 2004; Nicholas & Geers, 2007; Niparko et al., 2010; Svirsky, Teoh, & Neuburger, 2004). An economic evaluation of CI provides an opportunity to model the cost-effectiveness of an early intervention to limit the impact a significant childhood disability from a societal perspective using a cost-utility approach. The purpose of a cost-utility analysis is to determine the ratio between the cost of a health-related intervention and the benefits, expressed in quality-adjusted life years (QALYs), which allows for health states that are considered less preferable to full health to be given quantitative values and for those values to vary over time.
Despite increasing evidence in support of early implantation and successful implementation of universal newborn hearing screening programs, implantation at younger ages continues to face considerable resistance. Barriers to early implantation include delayed identification of hearing loss, slow assessment and referrals from interventionists, parental delays, concerns regarding complications with early surgical intervention, and lack of health insurance reimbursement for the substantial travel costs and lost earnings due to CI-related medical visits, which may present a considerable burden for low-income families (Lester, Dawson, Gantz, & Hansen, 2011; Moeller, 2000).
As a result, families and healthcare professionals may devote a substantial amount of time in a developmentally critical period to trials of hearing aids and less expensive and intensive alternatives to CI. Concerns surrounding early CI would be reduced if the perceptual, developmental, and lifetime benefits of early implantation were shown to be substantial.
Previous investigations have shown CI to be highly cost-effective in the overall pediatric population in the US but were limited in population size, duration of follow-up, and generalizability of the model (Bichey & Miyamoto, 2008; Cheng et al., 2000). In one of the most comprehensive analyses of pediatric CI, a study by the Peninsula Technology Assessment Group (PenTAG) in the UK identified lack of longer-term health-utility data and analyses of potentially confounding factors such as age at intervention as major limitations to cost-utility analyses of pediatric CI (Bond et al., 2009). Building on these findings, the objective of the current study is to evaluate the comparative societal benefits of pediatric CI by age at implantation through the first cost-utility analysis of pediatric CI using data from a multicenter, longitudinal study in the US. The effects of long-term post-operative complications, differences in costs of care, and differential educational savings at the three different cohort ages of implantation are analyzed.
MATERIALS AND METHODS
Study Design and Study Population
A detailed discussion of the inclusion and exclusion criteria and the overall study design can be found in a previous publication (Fink et al., 2007). The Childhood Development after Cochlear Implantation (CDaCI) study is a multi-center, prospective cohort study aimed at measuring the outcomes of early childhood CI in the US. Children with severe-to-profound SNHL were recruited at 6 academic medical centers, including Johns Hopkins University, University of Miami, University of Michigan, University of Texas Southwestern, House Research Institute, and University of North Carolina. CI participants in the study had to be under 5 years of age at baseline, be pre- or post-lingually deaf (onset of deafness before or after onset of speech and language acquisition), and have developmental scores on the Bayley Scales of Infant Development Mental Scale or Motor Scale (BSID II) of at least 70. A total of 188 children with severe-to-profound SNHL were enrolled in the study. The study was approved by each center’s institutional review board, and written informed consent was obtained from the parents of each enrolled child.
For this cost-utility study, 175 CI children with up to 6 years of post implant follow-up, concluded in November 2008 to December 2011, were grouped in 3 cohorts corresponding to their age at implantation: less than 18 months, 18 to 36 months, and greater than 36 months of age at implantation. Given that a 3-6 month hearing aid trial is required as part of the cochlear implant candidacy evaluation process (Zwolan, Thomas, & Arbor, 1998), thirteen CI children who had an onset of hearing loss at an age greater than 12 months were excluded to minimize selection bias into the three implantation age categories.
This study includes both unilaterally and bilaterally implanted children. As the decision for bilateral implantation was made by the family on an individual basis, the impact of bilateral implantation was factored out in both the costs and the benefits calculations. The health-utility impact of the second implantation was controlled by creating a flag variable within the dataset that was “switched on” whenever a child received a second implantation. This allowed for the isolation of all health utility gains that were strictly associated with the second implantation. Removing the costs associated with the second implantation was more straightforward since the costs were developed in an itemized “ingredients based” approach.
Perspective and Time Horizon
A societal perspective was adopted for this analysis, in that both direct and indirect costs were examined. All costs, as well as QALYs related to CI were considered over an expected 77.5 average lifetime (74.9 years for men and 79.9 year for women) of children born in the US (“Expectation of Life at Birth, and Projections,” 2012). All costs and outcomes were discounted annually at 3%(Gold, Siegel, Russell, & Weinstein, 1996).
Measurement of Costs
Costs and reimbursements, in US Dollars, were collected retrospectively at the individual patient level from the study center with largest number of participants, Johns Hopkins University (JHU). These were further stratified into direct medical costs, including pre-operative, operative, and post-operative medical costs; and indirect costs, including lost wages, educational savings, and transportation costs incurred by the families. Full access to cost data from other study centers was prohibited by US antitrust regulations that prevent sharing of medical pricing information among individual hospitals. Instead, costs from other centers were based on clinical care models provided by these institutions that were priced out according to JHU costs and were incorporated as ranges in sensitivity analyses. In addition, a cost-adjustment factor (see Appendix, Supplemental Digital Content 1), determined by differences between JHU and the national average in payer-mix and geographically-adjusted healthcare utilization rates, was calculated using data provided by University HealthSystem Consortium (UHC), an alliance of 116 academic centers and 272 of their affiliated hospitals representing approximately 90% of the US non-profit academic medical centers, to adjust costs collected at JHU into more generalizable ones that reflect the payer mix and healthcare utilization rate of the greater part of the United States (University HealthSystem Consortium, 2012). All 6 of the CDaCI study centers are non-profit academic medical centers.
The costs utilized in this study represent direct hospital and physician charges for procedures and medical visits associated with CI and do not represent true economic (opportunity) costs. The latter would be obtained by determining the value of the next best use of each resource that is used to treat the children who receive CI and each resource that is saved as a result of CI rather than not having an implantation. Given the proven clinical superiority of CI over hearing aids in severe-to-profoundly deaf children, enrolling a hearing-aided control group for the purposes of the present study would not be ethically justified. As such, direct cost data was not available for hearing-aided non-implanted children. The exclusion of such data yields considerably less favorable cost-utility ratios (as charges are greater than costs) than would be present when considering true economic costs, which are not truly zero for the non-implantation group.
Educational costs were calculated based on classroom placement, which was tracked through annual parental questionnaires with classroom placement options including: (1) school for the deaf, (2) self-contained program within a mainstream school, (3) partially mainstream classroom placement with at least 50% of children having hearing impairment, and (4) a fully mainstream placement with mostly normal hearing children.
For the youngest cohort, with 6 years of follow-up data, classroom placement distribution was available through second grade. For the middle and oldest cohorts, classroom placement data was tracked through third and fourth grades respectively. It was noted that beyond 4 years post-implantation, there tended to be little further transition in classroom placement, and therefore, for the remaining school years, an assumption was made that educational placement would hold steady at the last observed distributions. Composite educational costs were calculated based on the weighted proportion of children in each type of classroom setting and the associated costs for these placements as provided by the US Department of Education. Costs were calculated through second, third, and fourth grades for the young, middle, and oldest age cohorts, respectively. Similarly, the educational costs for severe-to-profoundly deaf, non-implanted children was obtained using data on classroom placement from the Gallaudet Research Institute’s (GRI) Annual Survey of Deaf and Hard of Hearing Children and Youth (Gallaudet Research Institute, 2009) and applying similar composite educational cost calculations. The GRI survey is conducted annually and offers a representative sample of hearing-impaired children and adolescents in the US across all levels of hearing-impairment. GRI classroom placement data was analyzed for 1,517 severe-to-profoundly deaf, non-implanted, school-aged children, who comprise a subset of the overall population tracked by the GRI annual survey. Educational savings for implanted children were then calculated as the difference between the educational costs for CI children in the present study and those calculated for the non-implanted children derived from the GRI annual survey. All educational costs or savings were discounted annually at 3%.
Average expected cost of complications was stratified by costs of minor (nonsurgical) complications, costs of revisions, and costs of re-implantations, as calculated using prevalence of these events (complication rate) in the CDaCI cohort over 6 years of follow-up. When more than 1 revision/re-implantation event took place, costs for the first and second corrective surgeries were added in determining the average cost of corrective surgery for the overall cohort.
Measurement of Health Utility
Parent-proxy questionnaires were used at baseline and also at yearly post-implantation intervals to assess the health-utility of CI children in the CDaCI study. The measurement instrument in this study uses questions from both the Health Utility Index (John Horsman, 2003) Mark II (HUI2) and the Health Utility Index Mark III (HUI3) surveys. These surveys provide measurements of general health status and health-related quality of life stratified by hearing, speech, vision, emotion, pain, ambulation, dexterity, cognition, and self-care domains of health. Respondents’ overall health states were calculated using the prescribed methodology provided for the HUI3 instrument. Although not specifically designed for use in children under 5 years of age, parent–proxy questionnaires for HUI2 and HUI3 instruments have been used widely in younger children both in CI and non-CI literature (Barr et al., 1999; Barton, Stacey, Fortnum, & Summerfield, 2006b; Brisson & Edmunds, 2003; Insinga, Laessig, & Hoffman, 2002; Oostenbrink et al., 2002).
Analysis of the repeated measures of health-utility scores at baseline and at 12, 24, 36, 48, 60, and 72 months post-implantation was conducted. Generalized estimating equations (GEE) was used to estimate the parameters of a generalized linear model while allowing for correlation between observations. GEE can be used despite the unknown structure of correlation between measures of health utility at different times since implantation. Children implanted between 18 and 36 months of age were used as the reference group in estimating HUI scores at baseline and at each subsequent follow-up period. This allowed for adjustment for baseline differences in health-utilities and projected health utility gains stratified by age at implantation over a 77.5-year average life expectancy in the US(“Expectation of Life at Birth, and Projections,” 2012) taking baseline individual ages and gender into account. Change in QALY’s for the 3 CI groups was then calculated by annually compounding the difference in health-utility between each of the 3 CI groups and the non-implanted baseline across the projected life-expectancy of each of the 3 implanted groups.
Cost-utility Ratios and Sensitivity Analysis
All costs were reported in 2011 US dollars. Base case results were calculated for each age group at implantation using an average of 4 hours of lost wages based on an average 2 hour hospital stay and a 2 hour round trip travelling time as observed at the JHU study center, a once-a-year lifetime frequency of audiology appointments past study follow-up period, with and without consideration of educational savings, and the partial absorption of the device cost by the manufacturer warranty in instances of re-implantation due to device failures. One-way sensitivity analyses were performed varying these underlying assumptions, with sensitivity analysis parameters centered around those used in the base case.
Statistical Analysis
Baseline demographic, socioeconomic, and medical history factors, as defined in Table 1, were characterized as means and standard deviations for continuous variables and as frequency distributions and percent of total for categorical variables. Baseline comparisons stratified by age at implantation were tested using analysis of variance for continuous variables and χ2 for categorical variables. Classroom placement and complication rates were compared across age groups at implantation using analysis of variance.
Table 1.
Characteristics of Cohorts
| Cochlear Implantation | |||
|---|---|---|---|
| Characteristics, No. | <18 months (n=60) |
18-36 months (n=71) |
>36 months (n=44) |
| Age at implantation, mo, mean (SD) | 13.2 (2.4) | 26.4 (5.7) | 47.0 (7.9) |
| Duration of Deafness, mo, mean (SD)b | 13.0 (2.8) | 25.4 (6.8) | 45.2 (8.3) |
| Female (%)b | 25 (42) | 36 (51) | 31 (70) |
| Hispanic (%) | 7 (12) | 18 (25) | 11 (25) |
| Congenital SNHL (%)b | 51 (85) | 34 (48) | 20 (45) |
|
| |||
| 4-tone hearing threshold average, dB, better earb | 107.5 (16.3) | 106.7 (15.3) | 99.6 (16.0) |
|
| |||
| Race, No. (%) | |||
| White | 49 (82) | 48 (68) | 34 (77) |
| Black | 4 (7) | 9 (13) | 2 (5) |
| Asian | 2 (3) | 4 (6) | 3 (7) |
| Other | 5 (8) | 10 (14) | 5 (11) |
|
| |||
| Maternal education, No. (%) | |||
| <8th grade | 0 (0) | 0 (0) | 1 (2) |
| Some high school | 1 (2) | 5 (7) | 5 (11) |
| Graduated high school | 11 (18) | 11 (15) | 3 (7) |
| Some college | 13 (22) | 23 (32) | 14 (32) |
| Completed college | 35 (58) | 32 (45) | 21 (48) |
|
| |||
| Household Income, No. (%)c | |||
| <$15,000 | 1 (2) | 8 (11) | 4 (9) |
| $15,000-$29,000 | 7 (12) | 9 (13) | 5 (11) |
| $30,000-$49,999 | 8 (13) | 20 (28) | 10 (23) |
| $50,000-$74,999 | 14 (23) | 8 (11) | 7 (16) |
| $75,000-$99,999 | 12 (20) | 10 (14) | 3 (7) |
| >$100,000 | 11 (18) | 10 (14) | 9 (20) |
|
| |||
| Income<$50,000b | 16 (27) | 37 (52) | 19 (43) |
|
| |||
| HUI Scoresa, mean (SD) | |||
| Pre-implantationb | 0.26 (0.14) | 0.31(0.17) | 0.37 (0.21) |
| 6-years Post-implantation | 0.76 (0.14) | 0.72 (0.20) | 0.71 (0.17) |
| Changeb | 0.51 (0.21) | 0.41 (0.24) | 0.34 (0.24) |
|
| |||
| Cognitive status score, mean (SD) | |||
| Bayley PDI(<2y)b | 96.2 (17.4) | 95.0 (18.9) | 76.2 (19.0) |
| Leiter-R brief IQ (>2y) | 113.5 (15.8) | 94.8 (16.0) | 106.2 (21.0) |
| Combinedd | 100.4 (18.1) | 95.6 (20.1) | 91.4 (25.5) |
Abbreviations: SNHL, Sensorineural hearing loss; Bayley PDI, Bayley Psychomotor Development Index; Leiter-R brief IQ, Leiter International Performance Scale-Revised; HUI, Health Utilities Index.
Health Utilities Index measured using Mark III transforms – unadjusted scores (see Figure 1a).
Statistically significant differences among children undergoing cochlear implantation at <18 months, 18-36 months, and >36 months of age (p<0.05).
Though household income was not significantly different among implant age groups using the 6 family income categories reported above, grouping by family income below $50,000 results in significantly lower frequencies among families of children implanted at younger ages (p=0.012).
Cognitive status measured by Bayley physical developmental index for children under 24 months of age and by Leiter brief IQ composite score for children 24 months of age or older.
Health-utility gains from baseline to 72 months, at yearly intervals, after CI were modeled using the results of GEE analysis, allowing for consideration of within-subject correlation over time in the repeated measures. Independent variables included dichotomous indicators for age group at implantation, dichotomous indicators for time of follow-up (a value of 0 or 1 was assigned to indicate whether a given observation occurred at a particular time of follow-up), interaction terms between age group and time of follow-up, and an indicator for bilateral implantation.
A decision tree (supplementary Figure 1, Supplementary Digital Content 2) was used to compare the costs and outcomes of CI for the 3 age cohorts. Subsequent to the decision on the age of implantation, each child is faced with a chance node of a CI procedure that results in: no complications, minor complications, revision surgery, or re-implantation surgery. Revision surgeries include surgical procedures that are required in order to ensure correct functioning of the cochlear device without replacing the initial implanted device. Re-implantations most often result from device failures requiring the surgical team to replace the device in the same or opposite ear. The probabilities and costs of these events were based on clinical outcomes from the CDaCI study.
Microsoft Excel 2010 (Microsoft Corp., Redmond, WA) was used for decision tree modeling, and STATA version 12 (StataCorp, College Station, TX) was used for all other analyses.
RESULTS
Study Population
A total of 175 children were followed for 72 months after CI. Of these, 60 children were implanted before 18 months, 71 between 18 and 36 months, and 44 after 36 months of age, with a mean age at implantation of 13.2, 26.4, and 47.0 months, respectively. Table 1 shows the baseline characteristics of the study population stratified by age of implantation. The 3 groups differed by gender, age at onset of deafness, duration of deafness, 4-tone hearing threshold average (PTA) – a measure of pre-implantation residual hearing, socioeconomic status, baseline HUI scores, and baseline Bayley psychomotor development index, but were not significantly different by race, maternal education level, and other measures of baseline IQ.
Measurement of Health Utility
Children implanted at <18 months of age gained an average unadjusted health-utility improvement of 0.51 points in the first 6 years following implantation, compared to 0.41 points for the 18-36 month group, and 0.34 points for the >36 month age group at implantation (p<0.0001). Adjusting for differences in baseline HUI3 scores and controlling for rate of bilateral implantation using the GEE model led to a 0.49 point health-utility gain for the youngest group, a 0.44 point gain for the middle group, and a 0.43 point gain for the oldest group, which resulted in lifetime projected QALY gains of 10.7, 9.0, and 8.4 QALYs, respectively (Figure 1 and supplementary Table 1, Supplemental Digital Content 3).
Figure 1.
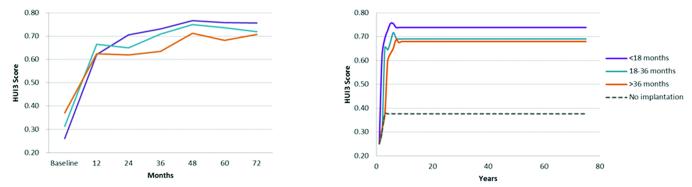
Health-Utility Gains Following Cochlear Implantation by Age at Baseline.
Left panel shows unadjusted Health Utilities Index Mark III gains in the first 6 years after implantation as observed in the CDaCI study. Right panel includes lifetime health-utility projections after adjusting for differences in baseline HUI scores and rates of bilateral implantation between the 3 age groups. Health-utility differences and gains from baseline were significantly different between all 3 age groups at implantation, through 6 years of follow-up on generalized estimating equations analysis (p<0.05). Average projected lifetime QALYs gained: 10.7 for <18 month group, 8.9 for 18-36 month group, and 8.2 for >36 month group.
Due to the absence of a specific hearing-aided control group in the CDaCI study, these utility gains were calculated relative to a non-implanted control constructed from the baseline HUI scores of the 3 CI groups as estimated by the GEE model (0.25, 0.30, and 0.38 for the youngest, middle, and oldest groups, respectively). This approach was used for 2 reasons: (1) this cross-over construct helps reduce potential biases that may be present if the non-implanted data were instead derived from outside literature, and (2) allows for short-run consideration of effect of maturation on health-utilities of non-implanted children. A weakness of this approach arises from the confounding effect of differences in baseline levels of hearing impairment across the 3 CI groups, a variable associated with HUI scores(Barton, Stacey, Fortnum, & Summerfield, 2006a). Barton et al. (2006) demonstrated that higher HUI was associated with a more favorable level of hearing loss in non-implanted children. As a result, one would expect the oldest group at CI (group with lowest 4-tone hearing threshold average at baseline) to attain highest pre-implantation HUI scores, as was indeed the case in the current study. The incorporation of this group would, therefore, conservatively bias the health-utility gains identified in the present analysis, particularly for the youngest and middle groups, making the results of the study less favorable.
Measurement of Costs
Classroom placement by 7 years of age (last year of follow-up for youngest cohort) differed significantly between the 3 cohorts, with the youngest having a higher rate of mainstream integration (81%) and a lower rate of school for the deaf attendance (5%) than the 2 older implantation groups (55% and 50% mainstream integration, respectively) (Table 2 and Figure 2). Following the older 2 cohorts for six years allowed for an assessment of their educational placement at ages older than 7, with full mainstream integration increasing to 57% and 56% for the middle and oldest groups, respectively by 8 years of age, and to 63% for the oldest group by 9 years of age. As a result, at six years of implant use, the youngest group had a significantly higher rate of mainstream integration at 81% as compared to 57% and 63% for the middle and oldest age groups, respectively (p<0.05). Moreover, GRI-derived classroom placement for severe-to-profoundly deaf hearing-aided non-implanted children had lower rates of mainstream integration than all implant cohort groups (12% for full and 14% for partial mainstream), a higher proportion of self-contained placement (28%), and a 46% school for the deaf attendance(Gallaudet Research Institute, 2009). Using these weights, mean projected educational costs for severe-to-profoundly deaf hearing-aided children were $293,070 from first through 12th grade. This represented mean educational cost-savings of $191,705, $170,805, and $167,736 per child for the youngest, middle, and oldest implanted groups, respectively, over the same time period.
Table 2.
Educational Placement and Cost Savings
| Classroom Placement1 | Difference from Non-Implanted Cohort | Costs and Savings2 | ||||||||
|---|---|---|---|---|---|---|---|---|---|---|
| Full Mainstream |
Partial Mainstream |
Self- Contained |
School for Deaf |
Full Mainstream |
Partial Mainstream |
Self- Contained |
School for Deaf |
Grade 1-12 Educational Costs |
Educational Cost Savings |
|
| <18 months (n=42) |
81% | 14% | 0% | 5% | 69% | 0% | −28% | −41% | $101,365 | $191,705 |
|
| ||||||||||
| 18-36 months (n=53) |
55% | 28% | 2% | 15% | 43% | 14% | −26% | −21% | $122,215 | $170,805 |
|
| ||||||||||
| 36+ months (n=32) |
50% | 34% | 0% | 16% | 38% | 20% | −28% | −30% | $125,334 | $167,736 |
|
| ||||||||||
| Not implanted3 |
12% | 14% | 28% | 46% | 0% | 0% | 0% | 0% | $293,070 | $0 |
Second grade classroom placement (average age 7 yrs for each of the groups) is reported in this table. Mean classroom placement was statistically different between the 3 age groups - p-value = 0.04. A portion of the children did not report classroom placement in each age group (18 children for youngest group, 18 for middle group, and 12 for oldest group at implantation).
Based on costs provided by US Department of Education, inflation adjusted to 2011 US Dollars: $7,042 for full mainstream, $8,540 for partial mainstream, $20,300 for self-contained in a regular school, and $39,480 for school for deaf placement. Educational costs and savings were calculated using differences between annually reported classroom placement for each of the 3 age groups at implantation during the CDaCI study follow-up period. Costs were discounted annually at a 3% rate for entire duration of secondary schooling.
Classroom placement of severe-to-profoundly deaf non-implanted children obtained from data provided by Gallaudet Research Institute.
Figure 2.

Classroom Placement Following Cochlear Implantation by Primary School Grade Level and Age at Implantation.
Top left panel shows full mainstream placement, top right panel - partial mainstream placement, and bottom panel - school for deaf placement. Young, Middle, and Old correspond to <18 months, 18-36 months, and >36 months at implantation, respectively. Mean classroom placement was significantly different between the 3 groups (p<0.05) in grades 1 and 2. All groups followed for 72 months after implantation – striped bars are projections based on last known observation for that age group. Self-contained placement omitted due to small subgroup size.
Direct medical costs were calculated on an individual patient basis for the entire duration of the CDaCI study, with mean costs presented in Table 3. Total medical cost differences between the 3 age groups were driven by differences in mean re-implantation rates, which were 5.9%, 7.5%, and 11.5% for the youngest, middle, and oldest group, respectively (p=0.40) across the 6 years of follow-up (see Table 4). However, none of these differences were significant. Revision surgery rates were 2.4%, 3.2%, and 3.9% for the youngest, middle, and oldest groups, respectively; again, none of these differences reached significance (p=0.95). As a result, total medical and surgical complication rates (see Table 4), which also included minor complications, were not statistically different between the 3 cohorts (p=0.59). The resulting total lifetime medical costs were $160,453 for the youngest group, $160,638 for the middle group, and $161,056 for the oldest group (Table 5). Incorporating the significantly different educational cost-savings from first through 12th grade across the 3 groups resulted in net lifetime societal savings of$31,252, $10,217, and $6,680 for the youngest, middle, and oldest cohorts, respectively. That is, early CI is estimated to yield more than $20,000 per child lifetime societal savings over implantation at older ages.
Table 3.
Average Lifetime Costs of Unilateral Pediatric Cochlear Implantation (2011 US Dollar)*
| Direct Costs | No. of Years |
Probability | Reimbursement, US $ | |
|---|---|---|---|---|
| Pre-operative | ||||
|
|
||||
| Audiology | 1 | 100% | $1,284 | |
|
|
||||
| Physician | 1 | 100% | $100 | |
|
|
||||
| Other | 1 | 100% | $287 | |
|
|
||||
| Operative | ||||
|
|
||||
| Cochlear implant device | 1 | 100% | $34,440 | |
|
|
||||
| Hospital and surgery charges | 1 | 100% | $5,724 | |
|
|
||||
| Medical complications cost | ||||
|
|
||||
| Minor complications |
1-6 | 4.76% | $459 | |
|
|
||||
| Revision | 1-6 | 3.03% | $5,534 | |
|
|
||||
| Re-implantation cost |
1-6 | 7.79% | $9,370 | |
|
|
||||
| Processor upgrade | 1-75 | 100% | $11,743 | |
|
|
||||
| Extended warranty | 3-75 | 100% | $11,859 | |
|
|
||||
| Insurance | 1-75 | 100% | $8,671 | |
|
|
||||
| Rechargeable batteries | 1-75 | 100% | $1,485 | |
| Post-operative | ||||
|
|
||||
| Physician | 1-75 | 100% | $125 | |
|
|
||||
| Audiology | 1-75 | 100% | $23,291 | |
|
|
||||
| Rehab | 1-75 | 100% | $12,151 | |
|
| ||||
|
Total Direct
Costs |
$126,523 | |||
|
| ||||
| Indirect Costs | ||||
|
|
||||
| Lost wages† | 1-75 | $30,799 | ||
|
|
||||
| Transportation cost‡ | 1-75 | $17,789 | ||
|
|
||||
| Educational savings | 1-75 | −$176,944 | ||
|
| ||||
| Total Indirect Costs | −$128,356 | |||
|
| ||||
| Total Costs | −$1,833 | |||
Using average age at implantation of 2.3 years, 75.2 remaining years of life, a 3% discount rate, once a year lifetime frequency of audiology followup, 4 hours of lost wages per medical visit, 7 processor upgrades at $2,834 average reimbursement for each upgrade, a $50 annual battery replacement cost, $400 annual extended warranty fee, and $289 annual device insurance fee.
Lost wages were calculated based on a $23.50 hourly rate and 4 hours away from work. Wage rate was obtained from the Bureau of Labor Statistics (http://www.bls.gov/eag/eag.us.htm).
Transportation cost was calculated based on 100 miles in travel and a travel reimbursement rate of $.555/mile.
Table 4.
Post-operative Complications
| Age Group | Number of People Implanted |
Number of Ears Implanted |
Minor Complications1 |
Revision Surgeries1 |
Re- implantation Surgeries1 |
Total Complications1 |
|---|---|---|---|---|---|---|
| <18 months |
60 | 85 | 5 (5.88%) | 2 (2.35%) | 5 (5.88%) | 12 (14.12%) |
| 18-36 months |
71 | 94 | 4 (4.26%) | 3 (3.19%) | 7 (7.45%) | 14 (14.89%) |
| 36+ months |
44 | 52 | 2 (3.85%) | 2 (3.85%) | 6 (11.54%) | 10 (19.23%) |
| All groups |
175 | 231 | 11 (4.76%) | 7 (3.03%) | 18 (7.79%) | 36 (15.58%) |
All complication rates as a percentage of number of ears implanted; none of the complication rates were statistically different at the 5% level between age groups - ANOVA p-values of 0.80, 0.95, 0.40, and 0.59 for minor complications, revision surgeries, re-implantation surgeries, and total complications across all age groups at implantation, respectively.
Table 5.
Cost-Utility and Sensitivity Analysis
| Cost-Utility Ratios | Total Lifetime Cost without Educational Savings |
Total Lifetime Savings with Educational Savings |
QALYs Gained | Cost/QALY without Educational Savings |
Interpretation |
|---|---|---|---|---|---|
| <18 months | $160,453 | $31,252 | 10.7 | $14,996 | Dominated |
| 18-36 months | $160,638 | $10,217 | 9.0 | $17,849 | |
| 36+ months | $161,056 | $6,680 | 8.4 | $19,173 | |
| Sensitivity Analysis | <18 months | 18-36 months | 36+ months | ||
| Variables | Base Estimate | Range of Estimate (Best to Worst) |
Cost-Utility Cost per QALY (Base $14,996) |
Cost-Utility Cost per QALY (Base $17,849) |
Cost-Utility Cost per QALY (Base $19,173) |
| Discount Rate | 3% | 0 - 6 | $10,716-$29,005 | $12,761-$34,504 | $13,723-$37,018 |
| Direct Medical cost: | |||||
| Frequency of Lifetime audiology |
1/year | 1 to 4 | $14,996-$19,060 | $17,849-$22,681 | $19,173-$24,351 |
| Reimplantation cost | $9,370 | $0-$40,164 | $15,165-$14,944 | $18,103-$17,771 | $19,045-$19,596 |
| Extended Warranty | $400/year | $300-$500 | $14,718-$15,273 | $17,519-$18,178 | $18,820-$19,526 |
| Frequency of device upgrade |
7/Lifetime | 5-10/Lifetime | $14,660-$15,452 | $17,448-$18,387 | $18,740-$19,615 |
| Total lifetime medical cost |
$111,968 | $55,984-$167,953 | $9,801-$20,190 | $11,673-$24,024 | $12,557-$25,790 |
| Time off Work, hours per visit |
4 | 3-5 | $14,304-$15,686 | $17,026-$18,669 | $18,292-$20,053 |
| Parental salary, hourly wage |
$23.50 | 18-30 | $14,322-$15,792 | $17,048-$18,795 | $18,315-$20,187 |
| Non-implanted health- utility |
0.38 | 0.26-0.56 | $11,143-$23,254 | $14,472-$30,892 | $19,173-$35,012 |
Cost-Utility Ratios and Sensitivity Analyses
Driven by these findings, CI for the youngest subgroup dominated the other 2 alternatives in the base case and sensitivity analyses (Table 5). The base case analysis yielded $14,996/QALY gained when compared to non-implantation alternatives for the youngest group, $17,849/QALY for the middle group, and $19,173/QALY for the oldest age group at implantation. When incorporating lifetime educational cost savings, these net costs become negative (reflecting net societal savings from pediatric CI), preventing the use of cost-utility ratios as outcome measures.
Sensitivity analyses were conducted by varying underlying assumptions of the model. By increasing the lifetime audiology appointments to twice a year, cost/QALY increases slightly to a range of $15,610 to $20,531. Additionally, assuming 4 audiology visits per year increases the $/QALY ratio to $18,312 to $24,071. Relaxing the assumption that a re-implantation is partially covered by manufacturer’s warranty increased the cost of re-implantation to be equal to that of the initial surgery and yielded a cost-utility ratio of $14,426 to $19,194 per QALY gained. Lastly, sensitivity analyses were performed on health-utility attainment of the constructed non-implanted control group. These included comparing each implanted group only to their own pre-implantation baseline on one extreme and allowing for more significant effects of maturation on health-utility in the non-implanted group on the other extreme. In the latter scenario, a new non-implanted baseline was modeled after the HUI3 attainment of a group of hearing-aided adults reported by Barton et al. (2005)(Barton, Bankart, & Davis, 2005).
The study reported an average HUI3 health-utility score of 0.56 for a group of patients with a mean age of 69.5 years and 4-tone hearing threshold average of 39 dB (better ear). Despite the considerably lower average level of hearing loss in the Barton et al.(2005) than in the current study, a conservative assumption was made to linearly model a health-utility increase from the last known HUI3 score of the non-implanted group (0.38 at 46 months of age) to an HUI3 score of 0.56 by 21 years of age, after which the health-utility of the non-implanted control does not continue to grow. This scenario yielded cost-utility ratios of $23,254, $30,892, and $35,012 for the youngest, middle, and oldest groups, respectively. Of note, cost-utility ratios for the youngest age group consistently outperformed those for the older cohorts across all of the sensitivity analyses. Moreover, even under the most conservative scenarios, these ratios did not approach the $50,000/QALY threshold for cost-effective procedures used in the US (Owens, 1998).
DISCUSSION
These data show that even without considering improvements in lifetime earnings, pediatric CI remains cost-effective in any age group (<$50,000/QALY;Owens, 1998). The $50,000/QALY threshold also translates to approximately one times the per capita US GDP, which is noted by the World Health Organization to be highly cost-effective(World Health Organization, 2012). Early implantation (<18 months) consistently dominated all quality of life and societal cost outcomes, with equal or lower rates of post-operative complications when compared to 18-36 months and >36 months of age at implantation. While the middle cohort consistently outperformed the oldest age group at implantation, the differences in outcome metrics between these 2 groups were marginal and significantly lower than the difference between the middle to youngest age group at implantation. This suggests the presence of a critical age threshold below 18 months of age, after which benefits from CI are significantly reduced and are not regained with longer-term experience with the implant.
Barriers to early implantation are, in part, due to concerns of heightened risk in implanting young children. The current analysis demonstrates that, when performed at academic medical institutions with large, established CI programs, early implantation is as safe as implantation at later ages, with statistically equivalent, though lower rates of revision and re-implantation surgeries. Across all age groups at intervention, implanted children had no mortalities or life-threatening post-operative complications; encountered complications were minor, but there were several that required reoperation. These findings are in agreement with recent literature demonstrating the safety of CI in children under 12 months of age (Colletti et al., 2005; Dettman, Pinder, Briggs et al., 2007; James & Papsin, 2004; Miyamoto, Houston, & Bergeson, 2005; Valencia, Rimell, Friedman et al., 2008). In contrast to the present analysis, these studies reported lower or no complications after implantation but were limited to a smaller and less representative sample (less than 25 children, all from 1 study center; Colletti et al., 2005; James & Papsin, 2004; Miyamoto et al., 2005; Valencia et al., 2008) and shorter follow-up duration (Dettman et al., 2007). Previous studies using larger patient populations (all pediatric CI recipients) and longer duration of follow-up reported similar rates of complications to those observed in the current analysis (Bhatia, Gibbin, Nikolopoulos et al., 2004; Kandogan, Levent, & Gurol, 2005; Kempf, Johann, & Lenarz, 1999).
Another barrier to early implantation relates to potential uncertainty surrounding the initial diagnosis and treatment follow-up (White, Forsman, Eichwald, & Munoz, 2010). Though newborn hearing screening (NBHS) programs have been widely adopted in the US since the early 1990s, increasing the detection of congenital hearing loss in infants from 3% to 94% over the last 2 decades, a nearly 2% false positive rate (Clemens, Davis, & Bailey, 2000) requires further audiologic testing to rule out transient hearing loss and artifact-associated test errors, as well as to determine the etiology of hearing loss in those with confirmed hearing impairment. Despite the importance of early intervention, significant delays continue to exist in patient follow-up for confirmatory testing and in subsequent treatment for pre-lingual deafness (Morton & Nance, 2006; White et al., 2010). The main factors associated with these delays include shortage of qualified pediatric audiologists, lack of knowledge among health providers about the importance and urgency of follow-up testing (particularly primary care physicians who rarely encounter pediatric hearing loss), and family delays in seeking treatment (Lester et al., 2011; Shulman et al., 2010). Recognizing these delays, the 7 national goals for Early Hearing Detection and Intervention (EHDI) programs developed by the CDC include implementation of a confirmatory audiologic evaluation before 3 months of age and appropriate early intervention services by 6 months of age for all infants who screen positive on NBHS (Kemp, 1978). The success of these initiatives will largely depend on additional training of health professionals (Sorkin, 2011) and implementation of more effective patient tracking and record management systems to enable timely follow-up and treatment compliance on the part of the patient’s family.
These data also show that families with lower annual income were less likely to seek early implantation (in our study setting where all SNHL onset before 1 years of age), which may present a critical target for national hearing care initiatives. Prior literature has identified a similar association between delays in implantation and lower socioeconomic class(Fortnum, Marshall, & Summerfield, 2002), with some studies specifically linking delayed CI to the presence of Medicaid insurance, likely serving as an indicator for socioeconomic status(Lester, Dawson, Gantz, & Hansen, 2011). While patients with Medicaid may receive the same access to medical care as those using private insurance,(Morton & Nance, 2006) the considerable expenses imposed on families of implanted children by the indirect and downstream costs of implantation, as shown in our analyses, are not reimbursed by health insurance and may present a challenge for low-income families (Chang, Ko, Murray, Arnold, & Megerian, 2010). Specifically, the pre-implantation evaluation process and extensive follow-up require considerable parental involvement and missed time from work, sometimes traveling several hours to the nearest CI center. Several of the centers participating in this study, for example, recommend at least 2 years of weekly rehabilitation appointments following surgery to achieve maximal benefit from implantation. In turn, these responsibilities are communicated to parents during the initial screening process and may serve as a deterrent to early implantation and lead to the alternative of placing a longer emphasis on treatments requiring less intensive follow-up. Unfortunately, prolonging the decision to seek implantation incurs greater downstream costs to the implanted children, their families and the society at large.
These data also show that the major cost drivers related to CI included the cost of the device and warranty, the surgery, and post-operative rehabilitation and audiology follow-up. Varying all of these factors to 150% of the base case level continued to yield favorable cost-utility ratios - under $25,790/QALY for all age groups at implantation- among the most cost-effective procedures undertaken in the US (Tengs et al., 1995). Improvements in post-implantation classroom placement were among the largest value drivers of the present analysis. Though limited in duration of follow-up, these data show that early CI had a significantly higher and sustained rate of mainstream integration than the 2 older groups. This result agrees with the findings of a previous analysis by Schulze-Gattermann et al. (2002), which tracked classroom placement of 158 children in Germany by age at implantation (Schulze-Gattermann, Illg, Schoenermark, Lenarz, & Lesinski-Schiedat, 2002). When considering these differential educational cost savings, early pediatric CI actually leads to net societal savings up to $31,000 per child relative to non-implantation (negative cost-utility ratios). To put this in perspective, beta blocker therapy to reduce mortality from cardiovascular disease has a positive cost-utility ratio of $5,000/QALY(Weinstein & Stason, 1985); combination anti-retroviral therapy for human immunodeficiency virus - $23,000/QALY (Freedberg, Losina, Weinstein et al., 2001); and dialysis for end-stage renal disease - $50,000-$60,000/QALY (Garner & Dardis, 1987).
The use of the national CDaCI study, with access to baseline and long-term multi-center data, detailed tracking of educational placement, direct medical costs and reimbursements, and long-term quality of life outcomes, allows for greater generalizability of results than previously feasible. In particular, the inclusion of longer-term health-utility follow-up and subgroup analysis by age at implantation addresses 2 of the limitations of the PenTAG report (Bond et al., 2009). By tracking actual hospital and physician reimbursement data at the individual patient level across the entire duration of the study, this model expands prior analyses of pediatric CI that relied on Centers for Medicare and Medicaid Services reimbursement data or shorter-term patient follow-up – factors which appear to understate the costs associated with this procedure. As a result, at approximately $112,000 across all age groups, the total direct lifetime cost of CI was considerably higher after inflation adjustment than that reported by Cheng et al. (2000;Cheng et al., 2000). Despite these higher costs, the substantial gains in health-utility over the lifetime of an implanted child still resulted in highly favorable cost-utility ratios, particularly at younger ages.
The approximate average increment of $20,000 of realized lifetime savings from early CI, relative to that observed with implantation in the 2 older groups, results in nearly $1.26 billion of societal savings over the lifetime of the current 60,000 pediatric cochlear implant candidates in the US. An average 1.5-year delay in CI, the age difference between the youngest and middle groups, would diminish these savings to $212 million and would abolish all saving with a 3-year delay in implantation. This steep transition from the youngest to middle groups at implantation further supports the presence of a critical threshold period, which has also been suggested from a spoken language and auditory perspective.(McConkey Robbins et al., 2004; Nicholas & Geers, 2007; Svirsky et al., 2004) The significant association between baseline PTA threshold and age at implantation in the current study, with children implanted at younger ages having more severe hearing impairment at baseline, is in agreement with the results of the above investigations. These investigations concluded that age at implantation was strongly influenced by progression and degree of hearing loss, and, therefore, related to the extent of auditory experience with hearing aids pre-implant. While potentially confounding the effect of age at implantation on post-CI outcomes, these findings suggest that despite allowing for higher pre-implantation PTA thresholds from longer hearing-aid use, delaying CI in the hopes of longitudinally assessing hearing aid benefit can lead to significant and sustained declines in patient quality of life, poorer educational outcomes, and, in turn, lost educational and societal savings.
There are several limitations to the use of CDaCI data that may influence our findings. The inability to conduct an RCT due to ethical considerations forces the use of pre-implantation health-utility scores as proxies for quality of life attainment of children who would be cochlear implant candidates. The inability to measure costs directly from all study centers due to antitrust regulation led to the need to estimate these by using adjustment factors from a third party source to generalize the detailed cost data collected at the JHU study center to other geographically dispersed academic medical centers. Additionally, classroom placement was used as a proxy for educational costs, but truly assessing costs associated with each type of classroom placement for CI children requires more detailed data than currently available. As noted, the use of parent-proxy questionnaires in measuring HUI score is recommended in children over 5 years of age(John Horsman, 2003), which could decrease the reliability of the utility measures used in our study. However, since the present study longitudinally compares health-utility gains between three implanted groups and a non-implanted control constructed from their pre-implantation baselines, these potential biases would be systematically present across all age groups and time periods, and should be partially mitigated in the ensuing comparisons (Franks, Hanmer, & Fryback, 2006).
CONCLUSIONS
The results of this study add an important dimension to existing evidence on the benefits of early CI on auditory and language outcomes, informing policy-makers and clinicians of the societal savings and improved economic outcomes that arise from earlier, critical assessment and implantation of cochlear implant candidates. As a result, emphasizing intensive early intervention and bolstering early support of families of implanted children could help mitigate the factors associated with auditory deprivation and permanent delays in spoken language learning associated with delayed intervention, improving the lives of implanted children and leading to considerable societal savings.
Supplementary Material
Acknowledgements
The authors would like to thank Dr. Catherine D. DeAngelis, M.D., M.P.H., Department of Pediatrics, Johns Hopkins University School of Medicine, for her critical review of this manuscript and many helpful comments. The authors would also like to thank Robert Browne and David Troland of University HealthSystem Consortium for their assistance in acquiring nationwide cost data, and Kay Lam of Gallaudet Research Institute for her help in acquiring and analyzing classroom placement data. The authors also thank Chunhua Lu of The Johns Hopkins University Financial Analysis Unit and Kathryn Ries of The Johns Hopkins University Department of Otolaryngology Head & Neck Surgery for their contribution to collecting financial data for the study.
Funding/Support: The CDaCI was supported by grant R01 DC004797 from the National Institute on Deafness and Other Communication Disorders, the CityBridge Foundation, and the Sidgmore Family Foundation. Warranties on the implant devices used by children with implants in this study were discounted by 50% by the Advanced Bionics Corporation, Cochlear Corporation, and the MedEl Corporation.
Role of the Sponsor: The sponsors had no role in the design and conduct of the study; in the collection, analysis, and interpretation of the data; or in the preparation, review, or approval of the manuscript.
Footnotes
CDaCI Investigative Team House Research Institute, Los Angeles: Laurie S. Eisenberg, PhD, CCC-A (PI); Karen Johnson, PhD, CCCA (coordinator); William Luxford, MD (surgeon); Leslie Visser-Dumont, MA, CCC-A (data collection); Amy Martinez, MA, CCC-A (data collection); Dianne Hammes Ganguly, MA (data collection); Jennifer Still, MHS (data collection); Carren J. Stika, PhD (data collection).
Johns Hopkins University, Listening Center, Baltimore: John K. Niparko, MD (PI); Steve Bowditch, MS, CCC-A (data collection); Jill Chinnici, MA, CCC-A (data collection); James Clark, MD (data assembly); Howard Francis, MD (surgeon); Jennifer Mertes, AuD, CCC-A (coordinator); Rick Ostrander, EdD (data collection); Jennifer Yeagle, MEd, CCC-A (data collection); Dawn Marsiglia, MA, CCC-A/SLP (data collection).
Johns Hopkins University, The River School, Washington, DC: Nancy Mellon, MS (administration); Meredith Dougherty, MS (data collection); Mary O’Leary Kane, MA, CCC-SLP (former coordinator, data assembly); Meredith Ouellette, MS (coordinator); Julie Verhoff, AuD, CCC-A (data collection).
University of Miami, Miami: Annelle Hodges, PhD, CCC-A (PI); Thomas Balkany, MD (surgeon); Alina Lopez, MA, CCC-SLP/A (coordinator); Leslie Goodwin, MSN, CCRC (data collection).
University of Michigan, Ann Arbor: Teresa Zwolan, PhD, CCC-A (Principal Investigator); Caroline Arnedt, MA, CCC-A (clinic coordinator); Hussam El-Kashlam, MD (surgeon); Kelly Starr, MA, CCC-SLP (data collection); Ellen Thomas, MA, CCC-SLP, Cert AVT.
University of North Carolina, Carolina Children’s Communicative Disorders Program, Chapel Hill: Holly F.B. Teagle, AuD, CCC-A (PI); Craig A. Buchman, MD (surgeon); Carlton Zdanski, MD (surgeon); Hannah Eskridge, MSP (data collection); Harold C. Pillsbury, MD (surgeon); Jennifer Woodard (coordinator).
University of Texas at Dallas, Dallas Cochlear Implant Program, Callier Advanced Hearing Research Center, Dallas: Emily A. Tobey, PhD, CCC-SLP (PI); Lana Britt, AuD, (Co-coordinator); Janet Lane, MS, CCC-SLP (data collection); Peter Roland, MD (surgeon); Sujin Shin, MA (data collection); Madhu Sundarrajan, MS, CCC-SLP (data collection); Andrea Warner-Czyz PhD CCC-A (co-coordinator).
Resource Centers Data Coordinating Center, Johns Hopkins University, Welch Center for Prevention, Epidemiology & Clinical Research, Baltimore: Nae-Yuh Wang, PhD (PI, biostatistician); Christine Carson, ScM (study manager, data analysis); Nancy E. Fink, MPH (Former PI); Thelma Grace (data assembly); Patricia Bayton (data assembly).
Psychometrics Center, University of Miami, Department of Psychology, Coral Gables: Alexandra Quittner, PhD (PI); David Barker, PhD (data analysis); Ivette Cruz, PhD (data analysis); Cara Kimberg (data assembly); Sandy Romero (data assembly); Mary Beth Grimley (data assembly).
Study Oversight Committees Executive Committee: John K. Niparko, MD (chair); Laurie S. Eisenberg, PhD; Nancy E. Fink, MPH (former member); Alexandra L. Quittner, PhD; Donna Thal, PhD; Emily A. Tobey, PhD; Nae-Yuh Wang, PhD.
External Advisors: Noel Cohen, MD; Julia Evans, PhD; Ann Geers, PhD; Karen Iler Kirk, PhD.
Author Contributions: Yevgeniy Semenov had full access to all of the data in the study and takes responsibility for the integrity of the data and the accuracy of the data analysis.
Study concept and design: Semenov, Yeh, Seshamani, Frick, Niparko,
Acquisition of data: Semenov, Wang, Tobey, Eisenberg, Quittner, Niparko
Analysis and interpretation of data: Semenov, Yeh, Seshamani, Wang, Frick, Niparko.
Drafting of the manuscript: Semenov, Yeh, Seshamani, Frick, Niparko.
Critical revision of the manuscript for important intellectual content: Semenov, Seshamani, Wang, Frick, Niparko.
Statistical analysis: Semenov, Yeh, Frick.
Obtained funding: Niparko, Tobey, Eisenberg, Quittner, Wang.
Administrative, technical, or material support: Niparko, Tobey, Eisenberg, Quittner, Wang.
Study supervision: Niparko.
Financial Disclosures: Dr Niparko reported serving on advisory boards without remuneration for 2 cochlear implant manufacturers, Advanced Bionics Corporations and the Cochlear Corporation, and serving on the board of directors for a school for children with hearing loss that has received gifts from cochlear implant manufacturers. The terms of these arrangements are being managed by the Johns Hopkins University in accordance with its conflict-of-interest policies. External advisors received honoraria for their review of the study protocol and progress reports. No other disclosures were reported.
The CDaCI Investigators are listed in the Appendix.
This is a PDF file of an unedited manuscript that has been accepted for publication. As a service to our customers we are providing this early version of the manuscript. The manuscript will undergo copyediting, typesetting, and review of the resulting proof before it is published in its final citable form. Please note that during the production process errors may be discovered which could affect the content, and all legal disclaimers that apply to the journal pertain.
References
- AMA Standardizing CPT Codes, Guidelines, and Conventions. 2009 Retrieved from http://www.ama-assn.org/ama/pub/physician-resources/practice-management-center/practice-operations/automating-the-practice/advocates-adminstration-simplification/whitepapers.page.
- Brisson M, Edmunds WJ. Varicella vaccination in England and Wales: cost-utility analysis. Archives of disease in childhood. 2003;88(10):862–9. doi: 10.1136/adc.88.10.862. [DOI] [PMC free article] [PubMed] [Google Scholar]
- Barr R, Simpson T, Whitton A, Rush B, Furlong W, Feeny D. Health-related quality of life in survivors of tumours of the central nervous system in childhood—a preference-based approach to measurement in a cross-sectional study. European Journal of Cancer. 1999;35(2):248–255. doi: 10.1016/s0959-8049(98)00366-9. [DOI] [PubMed] [Google Scholar]
- Barton GR, Bankart J, Davis AC. A comparison of the quality of life of hearing-impaired people as estimated by three different utility measures. International Journal of Audiology. 2005;44(3):157–163. doi: 10.1080/14992020500057566. [DOI] [PubMed] [Google Scholar]
- Barton GR, Stacey PC, Fortnum HM, Summerfield a Q. Hearing-impaired children in the United Kingdom, IV: cost-effectiveness of pediatric cochlear implantation. Ear and hearing. 2006a;27(5):575–88. doi: 10.1097/01.aud.0000233967.11072.24. [DOI] [PubMed] [Google Scholar]
- Barton GR, Stacey PC, Fortnum HM, Summerfield AQ. Hearing-Impaired Children in the United Kingdom , IV : Cost-Effectiveness of Pediatric Cochlear Implantation. Children. 2006b doi: 10.1097/01.aud.0000233967.11072.24. [DOI] [PubMed] [Google Scholar]
- Beck DE, Margolin D. a. Physician coding and reimbursement. The Ochsner journal. 2007;7(1):8–15. [PMC free article] [PubMed] [Google Scholar]
- Bhatia K, Gibbin KP, Nikolopoulos TP, O’Donoghue GM. Surgical complications and their management in a series of 300 consecutive pediatric cochlear implantations. Otology & neurotology. 2004;25(5):730–9. doi: 10.1097/00129492-200409000-00015. [DOI] [PubMed] [Google Scholar]
- Bichey BG, Miyamoto RT. Outcomes in bilateral cochlear implantation. Otolaryngology--head and neck surgery. 2008;138(5):655–61. doi: 10.1016/j.otohns.2007.12.020. [DOI] [PubMed] [Google Scholar]
- Blanchfield BB, Feldman JJ, Dunbar JL, Gardner EN. The severely to profoundly hearing-impaired population in the United States: prevalence estimates and demographics. Journal of the American Academy of Audiology. 2001;12(4):183–9. [PubMed] [Google Scholar]
- Bond M, Mealing S, Anderson R, Elston J, Weiner G, Taylor RS, Hoyle M, et al. The effectiveness and cost-effectiveness of cochlear implants for severe to profound deafness in children and adults: a systematic review and economic model. Health technology assessment (Winchester, England) 2009;13(44):1–330. doi: 10.3310/hta13440. [DOI] [PubMed] [Google Scholar]
- Chang DT, Ko AB, Murray GS, Arnold JE, Megerian CA. Lack of financial barriers to pediatric cochlear implantation: impact of socioeconomic status on access and outcomes. Archives of otolaryngology--head & neck surgery. 2010;136(7):648–57. doi: 10.1001/archoto.2010.90. [DOI] [PubMed] [Google Scholar]
- Cheng a K., Rubin HR, Powe NR, Mellon NK, Francis HW, Niparko JK. Cost-utility analysis of the cochlear implant in children. JAMA. 2000;284(7):850–6. doi: 10.1001/jama.284.7.850. [DOI] [PubMed] [Google Scholar]
- Clemens CJ, Davis S. a, Bailey a R. The false-positive in universal newborn hearing screening. Pediatrics. 2000;106(1):E7. doi: 10.1542/peds.106.1.e7. [DOI] [PubMed] [Google Scholar]
- Colletti V, Carner M, Miorelli V, Guida M, Colletti L, Fiorino FG. Cochlear implantation at under 12 months: report on 10 patients. The Laryngoscope. 2005;115(3):445–9. doi: 10.1097/01.mlg.0000157838.61497.e7. [DOI] [PubMed] [Google Scholar]
- Dettman SJ, Pinder D, Briggs RJS, Dowell RC, Leigh JR. Communication development in children who receive the cochlear implant younger than 12 months: risks versus benefits. Ear and hearing. 2007;28(2 Suppl):11S–18S. doi: 10.1097/AUD.0b013e31803153f8. [DOI] [PubMed] [Google Scholar]
- Expectation of Life at Birth, and Projections United States Census. 2012 Retrieved from http://www.census.gov/compendia/statab/cats/births_deaths_marriages_divorces/life_expectancy.html.
- Fink NE, Wang N-Y, Visaya J, Niparko JK, Quittner A, Eisenberg LS, Tobey EA. Childhood Development after Cochlear Implantation (CDaCI) study: design and baseline characteristics. Cochlear implants international. 2007;8(2):92–116. doi: 10.1179/cim.2007.8.2.92. [DOI] [PubMed] [Google Scholar]
- Fortnum HM, Marshall DH, Summerfield AQ. Epidemiology of the UK population of hearing-impaired children, including characteristics of those with and without cochlear implants--audiology, aetiology, comorbidity and affluence. International journal of audiology. 2002;41(3):170–9. doi: 10.3109/14992020209077181. [DOI] [PubMed] [Google Scholar]
- Franks P, Hanmer J, Fryback DG. Relative Disutilities of 47 Risk Factors and Conditions Assessed with Seven Preference-Based Health Status. 2006;44(5):12–14. doi: 10.1097/01.mlr.0000207464.61661.05. [DOI] [PubMed] [Google Scholar]
- Freedberg KA, Losina E, Weinstein MC, Paltiel AD. The cost effectiveness of combination antiretroviral therapy for HIV disease. The New England Journal of Medicine. 2001;344(11):824–31. doi: 10.1056/NEJM200103153441108. [DOI] [PubMed] [Google Scholar]
- Gallaudet Research Institute Annual Survey of Deaf and Hard of Hearing Children and Youth. 2009 Retrieved from http://research.gallaudet.edu/Demographics.
- Garner TI, Dardis R. Cost-effectiveness analysis of end-stage renal disease treatments. Medical care. 1987;25(1):25–34. doi: 10.1097/00005650-198701000-00004. [DOI] [PubMed] [Google Scholar]
- Gold MR, Siegel JE, Russell LB, Weinstein MC. Cost-effectiveness in Health and Medicine. Oxford University Press; New York: 1996. [Google Scholar]
- Holt RF, Svirsky M. a. An exploratory look at pediatric cochlear implantation: is earliest always best? Ear and hearing. 2008;29(4):492–511. doi: 10.1097/AUD.0b013e31816c409f. [DOI] [PMC free article] [PubMed] [Google Scholar]
- Insinga RP, Laessig RH, Hoffman GL. Newborn screening with tandem mass spectrometry: examining its cost-effectiveness in the Wisconsin Newborn Screening Panel. The Journal of pediatrics. 2002;141(4):524–31. doi: 10.1067/mpd.2002.128116. [DOI] [PubMed] [Google Scholar]
- James AL, Papsin BC. Cochlear implant surgery at 12 months of age or younger. The Laryngoscope. 2004;114(12):2191–5. doi: 10.1097/01.mlg.0000149456.75758.4c. [DOI] [PubMed] [Google Scholar]
- John Horsman WF. The Health Utilities Index (HUI): concepts, measurement properties and applications. Health and Quality of Life Outcomes. 2003 doi: 10.1186/1477-7525-1-54. [DOI] [PMC free article] [PubMed] [Google Scholar]
- Kandogan T, Levent O, Gurol G. Complications of paediatric cochlear implantation: experience in Izmir. The Journal of laryngology and otology. 2005;119(8):606–10. doi: 10.1258/0022215054516331. [DOI] [PubMed] [Google Scholar]
- Kemp DT. Stimulated acoustic emissions from within the human auditory system. The Journal of the Acoustical Society of America. 1978;64(5):1386–91. doi: 10.1121/1.382104. [DOI] [PubMed] [Google Scholar]
- Kempf HG, Johann K, Lenarz T. Complications in pediatric cochlear implant surgery. European archives of oto-rhino-laryngology. 1999;256(3):128–32. doi: 10.1007/s004050050124. [DOI] [PubMed] [Google Scholar]
- Lester EB, Dawson JD, Gantz BJ, Hansen MR. Barriers to the Early Cochlear Implantation of Deaf Children. Otology & Neurotology. 2011;32(3):406–412. doi: 10.1097/MAO.0b013e3182040c22. [DOI] [PMC free article] [PubMed] [Google Scholar]
- McConkey Robbins A, Koch DB, Osberger MJ, Zimmerman-Phillips S, Kishon-Rabin L. Effect of age at cochlear implantation on auditory skill development in infants and toddlers. Archives of otolaryngology--head & neck surgery. 2004;130(5):570–4. doi: 10.1001/archotol.130.5.570. [DOI] [PubMed] [Google Scholar]
- Miyamoto RT, Houston DM, Bergeson T. Cochlear implantation in deaf infants. The Laryngoscope. 2005;115(8):1376–80. doi: 10.1097/01.mlg.0000172039.26650.9b. [DOI] [PubMed] [Google Scholar]
- Moeller MP. Early Intervention and Language Development in Children Who Are Deaf and Hard of Hearing. Pediatrics. 2000;106(3):e43–e43. doi: 10.1542/peds.106.3.e43. [DOI] [PubMed] [Google Scholar]
- Mohr PE, Feldman JJ, Dunbar JL. The societal costs of severe to profound hearing loss in the United States. Policy analysis brief. H series / Project Hope, Center for Health Affairs. 2000;2(1):1–4. [PubMed] [Google Scholar]
- Morton CC, Nance WE. Newborn hearing screening--a silent revolution. The New England journal of medicine. 2006;354(20):2151–64. doi: 10.1056/NEJMra050700. [DOI] [PubMed] [Google Scholar]
- Nicholas JG, Geers AE. Will they catch up? The role of age at cochlear implantation in the spoken language development of children with severe to profound hearing loss. Journal of speech, language, and hearing research. 2007;50(4):1048–62. doi: 10.1044/1092-4388(2007/073). [DOI] [PMC free article] [PubMed] [Google Scholar]
- Niparko JK, Tobey EA, Thal DJ, Eisenberg LS, Wang N-Y, Quittner AL, Fink NE. Spoken language development in children following cochlear implantation. JAMA : the journal of the American Medical Association. 2010;303(15):1498–506. doi: 10.1001/jama.2010.451. [DOI] [PMC free article] [PubMed] [Google Scholar]
- Oostenbrink R, Oostenbrink JB, Moons KGM, Derksen-Lubsen G, Essink-Bot M-L, Grobbee DE, Redekop WK, et al. Cost-utility analysis of patient care in children with meningeal signs. International journal of technology assessment in health care. 2002;18(3):485–96. [PubMed] [Google Scholar]
- Owens DK. Interpretation of cost-effectiveness analyses. Journal of general internal medicine. 1998;13(10):716–7. doi: 10.1046/j.1525-1497.1998.00211.x. [DOI] [PMC free article] [PubMed] [Google Scholar]
- Schulze-Gattermann H, Illg a, Schoenermark M, Lenarz T, Lesinski-Schiedat A. Cost-benefit analysis of pediatric cochlear implantation: German experience. Otology & neurotology. 2002;23(5):674–81. doi: 10.1097/00129492-200209000-00013. [DOI] [PubMed] [Google Scholar]
- Shrestha LB. CRS Report for Congress: Life Expectancy in the United States. 2006.
- Shulman S, Besculides M, Saltzman A, Ireys H, White KR, Forsman I. Evaluation of the universal newborn hearing screening and intervention program. Pediatrics. 2010;126(Supplement_1):S19–27. doi: 10.1542/peds.2010-0354F. Suppl. Retrieved from. [DOI] [PubMed] [Google Scholar]
- Smith RJH, Bale JF, White KR. Sensorineural hearing loss in children. Lancet. 2005;365(9462):879–90. doi: 10.1016/S0140-6736(05)71047-3. [DOI] [PubMed] [Google Scholar]
- Sorkin DL. Cochlear Implantation and Knowledge Needs of Early Intervention Professionals. EHDI Conference; 2011.2011. [Google Scholar]
- Svirsky MA, Teoh S-W, Neuburger H. Development of language and speech perception in congenitally, profoundly deaf children as a function of age at cochlear implantation. Audiology & neuro-otology. 2004;9(4):224–33. doi: 10.1159/000078392. [DOI] [PubMed] [Google Scholar]
- Tengs TO, Adams ME, Pliskin JS, Safran DG, Siegel JE, Weinstein MC, Graham JD. Five-hundred life-saving interventions and their cost-effectiveness. Risk analysis. 1995;15(3):369–90. doi: 10.1111/j.1539-6924.1995.tb00330.x. [DOI] [PubMed] [Google Scholar]
- University HealthSystem Consortium [Retrieved May 29, 2012];2012 from http://www.uhc.edu.
- Valencia DM, Rimell FL, Friedman BJ, Oblander MR, Helmbrecht J. Cochlear implantation in infants less than 12 months of age. International journal of pediatric otorhinolaryngology. 2008;72(6):767–73. doi: 10.1016/j.ijporl.2008.02.009. [DOI] [PubMed] [Google Scholar]
- Weinstein MC, Stason WB. Cost-effectiveness of interventions to prevent or treat coronary heart disease. Annual review of public health. 1985;6:41–63. doi: 10.1146/annurev.pu.06.050185.000353. [DOI] [PubMed] [Google Scholar]
- White KR, Forsman I, Eichwald J, Munoz K. The evolution of early hearing detection and intervention programs in the United States. Seminars in perinatology. 2010;34(2):170. doi: 10.1053/j.semperi.2009.12.009. [DOI] [PubMed] [Google Scholar]
- World Health Organization Cost-effectiveness thresholds. 2012 Retrieved from http://www.who.int/choice/costs/CER_thresholds/en/index.html.
- Zwolan TA, Thomas E, Arbor A. Contemporary Protocols for Evaluating Cochlear Implant Candidacy of Children. 1998. pp. 4–13.
Associated Data
This section collects any data citations, data availability statements, or supplementary materials included in this article.