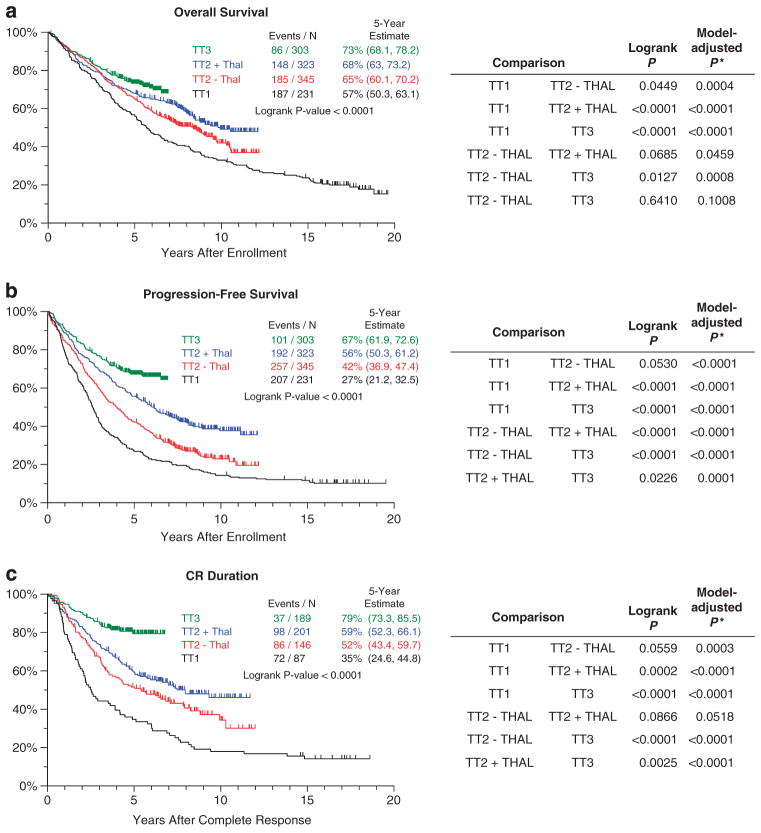
Figure 1.
Kaplan–Meier plots of OS (a), PFS (b) and CR duration (c) for TT trials. Significant improvements were observed in OS, PFS and CR duration with the transitions from earlier trials to later trials that incorporated new agents, greater intensity of induction therapy and consolidation therapy after transplantation. This was especially apparent in the Cox model-derived comparisons adjusted for baseline prognostic factors. Black, TT1; red, TT2 − Thal; blue, TT2 + Thal; and green, TT3. *Model-adjusted P-value based on Cox regression model including terms for TT protocol, age, β-2microglobulin >5.5 mg/l, lactate dehydrogenease ≥190 U/l and the presence of CA.

