Abstract
Spo0A is the regulator of stationary-phase events and is required for transcription of solvent formation genes in Clostridium acetobutylicum. In order to elucidate the role of spo0A in differentiation, we performed transcriptional analysis of 824(pMSPOA) (a spo0A-overexpressing C. acetobutylicum strain with enhanced sporulation) against a plasmid control strain. DNA microarray data were contrasted to data from a spo0A knockout strain (SKO1) that neither sporulates nor produces solvents. Transcripts of fatty acid metabolism genes, motility and chemotaxis genes, heat shock protein genes, and genes encoding the Fts family of cell division proteins were differentially expressed in the two strains, suggesting that these genes play roles in sporulation and the solvent stress response. 824(pMSPOA) alone showed significant downregulation of many glycolytic genes in stationary phase, which is consistent with metabolic flux analysis data. Surprisingly, spo0A overexpression resulted in only nominal transcriptional changes of regulatory genes (abrB and sigF) whose expression was significantly altered in SKO1. Overexpression of spo0A imparted increased tolerance and prolonged metabolism in response to butanol stress. While most of the differentially expressed genes appear to be part of a general stress response (similar to patterns in two plasmid control strains and a groESL-overexpressing strain), several genes were expressed at higher levels at early time points after butanol challenge only in 824(pMSPOA). Most of these genes were related to butyryl coenzyme A and butyrate formation and/or assimilation, but they also included the cell division gene ftsX, the gyrase subunit-encoding genes gyrB and gyrA, DNA synthesis and repair genes, and fatty acid synthesis genes, all of which might play a role in the immediate butanol stress response, and thus in enhanced butanol tolerance.
Stationary-phase events in gram-positive bacteria, including Bacillus subtilis and the solventogenic clostridia Clostridium acetobutylicum (13) and C. beijerinckii (24), are regulated by Spo0A, a response regulator that acts as both an activator and a repressor of gene expression. The effects of Spo0A have been examined in several sporulation studies of B. subtilis (11, 27), but these events occur under nutrient-limiting conditions and involve several genes not found in C. acetobutylicum (21). Expression of spo0A in C. acetobutylicum is of particular interest because it promotes expression of the solvent formation genes (aad, ctfA, ctfB, and adc) during stationary phase and therefore promotes the conversion of acetate and butyrate into acetone, butanol, and ethanol (13). In order to metabolically engineer strains of C. acetobutylicum that can withstand a toxic solvent environment, it would be necessary to understand the expression and regulation of the events that occur in the transitional and stationary phases of culture. While inactivation of spo0A has been examined extensively in B. subtilis (11) and to some extent in C. acetobutylicum (13), overexpression of spo0A has been reported only for C. acetobutylicum (13). Inactivation of spo0A in C. acetobutylicum (strain SKO1) results in an asporogenic, nonsolventogenic phenotype. Overexpression of spo0A [strain 824(pMSPOA)] results in accelerated differentiation. 824(pMSPOA) expresses the solventogenic transcript aad-ctfAB sooner (13). However, the impact of spo0A overexpression on the major transcriptional programs of the cell remains unexplored.
DNA microarray analysis has become an important tool in elucidating the transcriptional programs of mutant strains. Fawcett et al. examined B. subtilis strains deficient in either spo0A or sigF to identify 520 genes whose expression levels differed at least threefold and were dependent on Spo0A but not σF and 66 genes whose expression depended on both (11). Characterization of SKO1 by DNA microarray analysis reveals downregulation of solventogenic, sporulation, and carbohydrate metabolism genes and upregulation of flagellar and chemotaxis genes (30). The advantage of performing transcriptional analysis of 824(pMSPOA) is that accelerated differentiation may reveal more genes that are differentially expressed in stationary phase. Also, stress response is associated with solvent production; this response cannot be observed in strain SKO1, since it does not produce significant amounts of solvents.
Butanol stress and tolerance have recently been examined in a groESL-overexpressing strain (31, 32). Overexpression of groESL imparts enhanced solvent production (32) and tolerance (31). Butanol toxicity and tolerance have typically been associated with effects on the cell membrane's biophysical properties (31). Since cell differentiation and sporulation involve drastic changes in membrane properties and spore coat formation, we hypothesized that changes in the cell's differentiation program by spo0A overexpression might alter the response of the cells to butanol stress. We examined this hypothesis by subjecting strain 824(pMSPOA) and its plasmid control strain [824(pIMP1)] to butanol challenges and examining the transcriptional differences of these challenges.
MATERIALS AND METHODS
Bacterial strains and plasmids.
pIMP1 contains gram-positive and gram-negative origins of replication and ampicillin and macrolide, lincosamide, and streptogramin B resistance genes (19). pMSPOA has the spo0A gene and its natural promoter inserted into pIMP1 (13). Each plasmid was transformed into C. acetobutylicum ATCC 824 (American Type Culture Collection, Manassas, Va.).
Analytical methods.
Cell growth was determined by measuring absorbance at 600 nm (A600) with a Thermo Spectronic (Rochester, N.Y.) BioMate3 spectrophotometer. Absorbance readings were kept below 0.40 by dilution with the appropriate media. Culture supernatants from bioreactor samples were analyzed for glucose, acetate, butyrate, acetoin, ethanol, acetone, and butanol by using a Waters (Milford, Mass.) high-performance liquid chromatography system (5, 33).
Growth conditions and maintenance.
Strains were stored at −85°C in clostridial growth medium (CGM) (35) with 15% glycerol and were grown at 37°C in an anaerobic chamber (Forma Scientific, Marietta, Ohio) in tubes containing 10 ml of CGM with 80 g of glucose/liter or on agar-solidified 2×YTG plates supplemented with erythromycin (100 μg/ml in liquid; 40 μg/ml on plates; Sigma, St. Louis, Mo.). Individual colonies were transferred to 10-ml CGM tubes and heat shocked at 70 to 80°C for 10 min to induce sporulation.
Bioreactor experiments.
Preinoculum flasks were grown to an A600 of 0.2, and the cultures were transferred to either a BioStat M (working volume, 1.6 liters; B. Braun, Allentown, Pa.) or a BioFlo II (working volume, 3.6 liters; New Brunswick Scientific, Edison, N.J.) reactor in a 10-fold dilution of CGM supplemented with 75 μg of clarithromycin (Abbott Laboratories, Abbott Park, Ill.)/ml. Fermentations were pH controlled at a low end of 5.0 with 6 N NH4OH. Anaerobic conditions were maintained by using nitrogen at flow rates of 55 and 125 ml/min, respectively, for an A600 below 1.0 and 11 and 25 ml/min for an A600 above 1.0.
Butanol challenge experiments.
Static flask cultures (800 ml) supplemented with 75 μg of clarithromycin/ml were grown to an A600 of 0.6 to 0.7 and then were divided equally (working volume, 200 ml) into four 250-ml bottles. Three bottles were challenged with butanol (0.2%, 0.4%, and 0.6% [vol/vol]; Sigma). RNA samples were taken from challenged and unchallenged cultures at 0.17, 0.5, 1, 2, 6, 12, and 24 h poststress, where the indicated time is when samples were first placed in the centrifuge to be spun down.
RNA purification and cDNA labeling.
Isolation of RNA and reverse transcription labeling of cDNA probes were performed as previously described (30).
cDNA arrays and hybridizations.
The targeted 1,019-gene microarrays used in these experiments and the hybridization protocol have been described previously (30). To minimize labeling biases, dyes were swapped when hybridizations were repeated for the same time point. Samples from the 824(pMSPOA) bioreactor experiments were hybridized against oppositely labeled (Cy3 or Cy5) 824(pIMP1) samples based on similarity in growth stages. Samples from butanol-challenged cultures were hybridized against oppositely labeled unchallenged samples from the same strain.
Microarray analysis.
Microarray data were normalized by using a segmental nearest-neighbor approach that has been shown to be superior to other normalization methods (36). The microarray analysis methodology has been published previously (30) and was used here with the following modification. The constant β used in the filtering criterion was set to 1.282 so that the channel intensity with background and nonspecific binding subtracted was greater than the noise of the background to a 90% confidence interval. All previous results were renormalized by using the same criterion, and it was verified that this reanalysis had little to no effect on the general expression patterns of the previously published data (data not shown).
Differentially expressed genes were grouped on the basis of similarity in expression profile by using self-organizing maps (SOMs) (GeneCluster, version 2.0 [28]) or by average linkage hierarchical clustering (Cluster [10]) and were visualized using TreeView (10).
Metabolic flux analysis.
Metabolic flux analysis uses measurable substrate and product data to solve a system of linear equations based on metabolic reaction stoichiometry to determine in vivo fluxes (22). We used a program specifically designed for C. acetobutylicum (9) to examine pathway fluxes (expressed in millimolar concentrations per hour per gram of cell weight) obtained in this study.
RESULTS
Transcriptional analysis of 824(pMSPOA) and 824(pIMP1) fermentations.
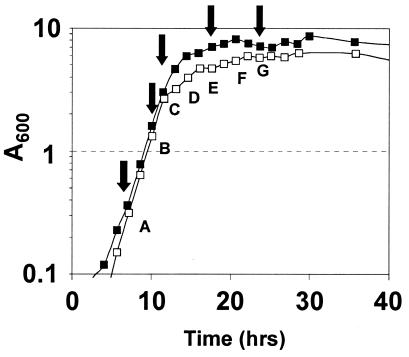
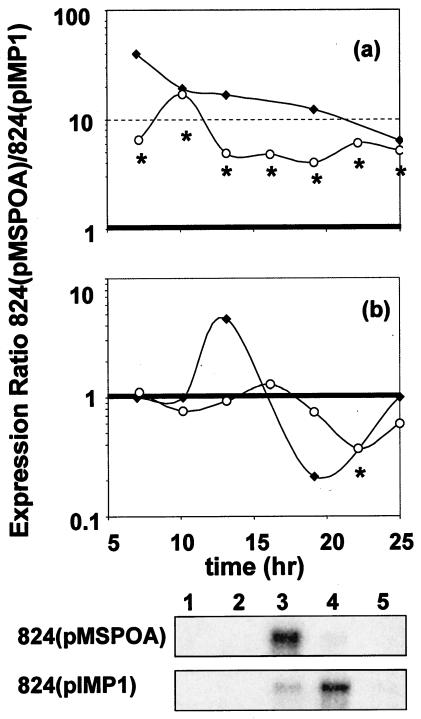
Fermentation profiles of 824(pMSPOA) (n = 4) (data not shown) were similar to those of the plasmid control 824(pIMP1) (n = 2) and essentially identical to data reported previously (13). Average total production of solvents in 824(pMSPOA) was 250 mM (137 mM butanol, 90 mM acetone, 23 mM ethanol) compared to 248 mM in 824(pIMP1) (150 mM butanol, 77 mM acetone, 21 mM ethanol). Overexpression of spo0A enhanced cell growth: A600 reached a peak of 8.3 compared to 6.1 in the plasmid control (Fig. 1). Microarray analysis was performed at seven time points (Fig. 1), with two arrays at each time point except time points F (three arrays) and G (one array). Microarray analysis of spo0A agrees with previously published Northern hybridization data for 824(pMSPOA) and 824(pIMP1) (Fig. 2a) (13). Harris et al. (13) also noted a shift in the peak expression of the aad-ctfAB transcript, which was maximally expressed in the third sample (t = 14 h) from 824(pMSPOA) and the fourth (t = 19 h) from 824(pIMP1). This accelerated transcription was attributed to spo0A overexpression. Microarray analysis shows (Fig. 2b) the shift in transcription as an apparent upregulation peaking at time point D and a downregulation at time point F. It is at time point F that all three genes were identified as differentially expressed. Similar comparisons for other transcripts (thl, adc, and ptb-buk) (data not shown) demonstrate that microarray data underestimate the actual fold differences while following the same general expression pattern (lower or higher expression compared to that in the control strain). These results and previous comparisons of similar arrays to Northern blot analysis data (30) show that our microarray analysis can be used to conservatively evaluate transcriptional effects in 824 (pMSPOA) experiments.
FIG. 1.
Growth profiles for 824(pMSPOA) (solid squares) and 824(pIMP1) (open squares). Capital letters indicate the times at which microarray analyses were performed (this study), and the arrows show the times at which Northern blot analyses were performed previously (13).
FIG. 2.
Comparison of ratios between 824(pMSPOA) and 824(pIMP1) spo0A (a) and aad-ctfAB (b) transcripts from microarrays (open circles) (this study) and Northern blot analysis (solid diamonds) (13). Asterisks indicate differential expression with a confidence level of at least 95% at the time point for the microarray data. The aad-ctfAB Northern blots are shown below the plots. Lanes indicate time points: 1 and 2, exponential growth, 3, transitional growth; 4 and 5, early-stationary phase. Total radioactive counts have been reported previously (13), and time points 1, 2, and 5 were treated as having equal (background) counts.
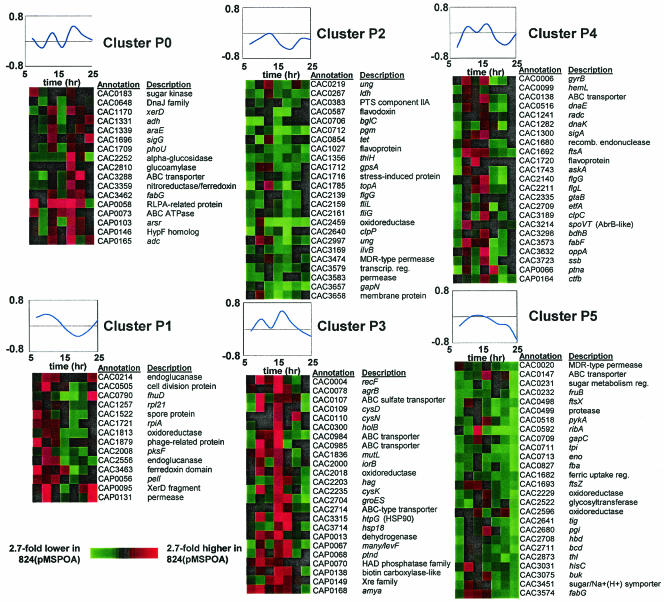
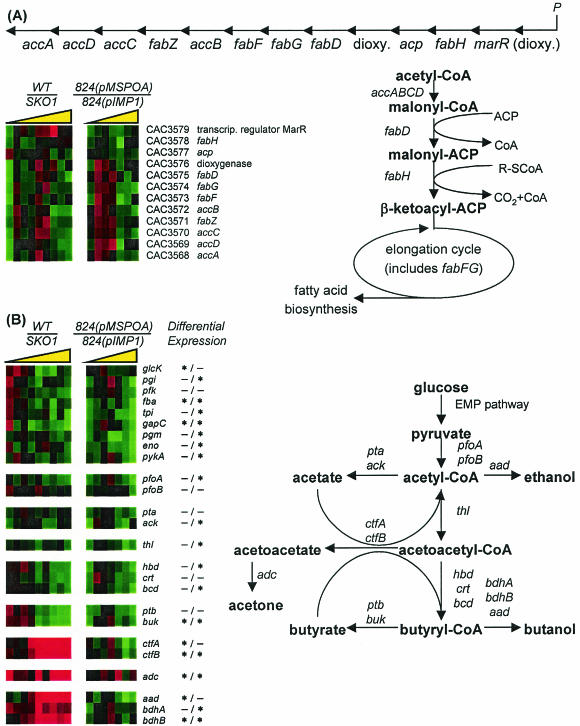
Comparative transcriptional analysis by microarrays of 824(pMSPOA) and 824(pIMP1) fermentations (Fig. 3) identified 123 genes as being differentially expressed for at least two time points. A complete list of these results can be found at http://www.chem-eng.northwestern.edu/Faculty/papou.html. These genes were grouped into six clusters (Fig. 3) based on normalized expression profiles using SOMs (28). Overexpression of spo0A results in accelerated sporulation (13) and, by implication, accelerated stationary-phase events including decreased motility and chemotaxis. In agreement with this assessment, we found that several genes related to the flagellar machinery had lower expression in 824(pMSPOA) than in 824(pIMP1) and were grouped in clusters P2 (flgG, fliL, fliG) and P4 (flgG, flgL). It should also be noted that in B. subtilis, synthesis of the flagellar biosynthesis operon fla/che was recently shown to be under the negative control of Spo0A (20). The cell division protein FtsA is required for normal sporulation in B. subtilis (17) and has a direct role in cell division with FtsZ (12). The corresponding C. acetobutylicum gene ftsZ (CAC1693) was included in cluster P5, and ftsA (CAC1692) was included in cluster P4; both showed the same general pattern of higher expression near 11 h followed by lower expression in stationary phase. ftsZ was previously shown to have an expression profile in SKO1 (a spo0A knockout strain [13]) consistent with genes that are directly or indirectly inhibited by Spo0A (30). Consistent with previous Northern blot analysis data (13), overexpression of spo0A resulted in earlier transcription of the solventogenic-gene transcript aad-ctfAB (Fig. 2). The fatty acid metabolism genes fabF and fabG (CAC3573 and CAC3574) were differentially expressed and were assigned to clusters P4 and P5, respectively. These genes, along with the others in their predicted operon (CAC3568 to CAC3579) (Fig. 4A) (30) and gpsA (CAC1712, encoding glycerol 3-phosphate dehydrogenase; cluster P2), show the same general pattern of higher expression in the 824(pMSPOA) strain at 9 to 13 h followed by apparent downregulation [higher expression in 824(pIMP1)]. It is known that de novo fatty acid synthesis is required for spore formation and activation of σE in B. subtilis (26), and it has been shown that in B. subtilis, expression of the acetyl coenzyme A (acetyl-CoA) carboxylase subunits accD and accA is positively regulated by Spo0A (20). Thus, these transcriptional observations may be attributed to the documented accelerated sporulation of 824(pMSPOA) (13). The transcriptional data of Fig. 4A also suggest that these genes may be organized into two operons (one ending at CAC3577 and the other starting at CAC3576) or that there is a secondary regulation of mRNA abundance for some genes within an operon.
FIG. 3.
Expression profiles for all differentially expressed (95% confidence interval) genes; the ratio is 824(pMSPOA)/824(pIMP1). Plots indicate the time course of the average normalized expression ratios within the cluster.
FIG. 4.
(A) Structure and comparison of expression profile in a predicted fatty acid synthesis operon (CAC3568 to CAC3579). The gene identified as CAC3580 (annotated as related to 2-nitropropane dioxygenase) was omitted from analysis for missing too many data points. The fatty acid synthesis pathway is based on the work of de Mendoza et al. (8) and the Kyoto Encyclopedia of Genes and Genomes (KEGG; www.genome.ad.jp/kegg/kegg2.html). P, predicted promoter; ACP, acyl carrier protein; R-ScoA, straight- or branched-chain acyl-CoA primer. (B) Structure and comparison of primary metabolism expression profiles in C. acetobutylicum spo0A strains as generated by microarrays. The last column indicates whether differential expression was achieved in each experiment to a 95% confidence interval on at least one array for at least two time points; an asterisk before the slash indicates differential expression in the wild-type (WT)/SKO1 experiment, and an asterisk after the slash indicates differential expression in the 824(pMSPOA)/824(pIMP1) experiment. The colorimetric ratio is on the same scale as in Fig. 3, and the yellow triangle represents the direction of increasing culture time.
Several differentially expressed genes are related to glucose metabolism. Cluster P5 features strongly downregulated genes in the stationary phase. These include genes involved in glycolysis (fba, tpi, gapC, eno, pykA), two genes annotated as being involved in fructose metabolism (CAC0231, a potential regulator of sugar metabolism, and CAC0232 [fruB]), genes involved in primary metabolism (thl, hbd, bcd) and acidogenesis (buk), and a sugar symporter gene (CAC3451). We compared the expression ratios of the metabolic genes in these experiments with previously published microarray results (30) that compared the spo0A knockout strain SKO1 with the wild type (Fig. 4B). In order to simplify comparisons of the strains, we inverted the earlier results (30) so that the strain expressing higher levels of spo0A was in the numerator (WT/SKO1). Deletion of the spo0A gene resulted in differentially lower expression of several solventogenic genes (ctfA, ctfB, adc, aad, bdhB) and higher expression of primary metabolism (hbd, crt, bcd) and butyrate formation (ptb, buk) genes during stationary phase. While many of the glycolytic genes were expressed at higher levels in SKO1 than in the parent strain, in 824(pMSPOA) the genes were expressed at lower levels in concert, as evidenced by the number of Embden-Meyerhof-Parnas pathway genes (seven out of nine genes) identified as differentially downregulated with a 95% confidence interval.
We also examined if lower expression of glycolytic-pathway genes in 824(pMSPOA) resulted in a corresponding decrease in metabolic flux through glycolysis. Metabolic flux analysis was performed using fermentation data (generated from the same experiment), and the ratio of fluxes [824(pMSPOA)/824(pIMP1)] was calculated (data not shown). At times corresponding to stationary-phase growth, rGLY1, the flux corresponding to the glucose→pyruvate pathway, and rGLY2, the pyruvate→acetyl-CoA pathway flux, were lower in 824(pMSPOA) than in 824(pIMP1). At microarray time point F (t = 22 h) rGLY1 was 38% lower in 824(pMSPOA), and at time point G (t = 25 h), rGLY2 was 42% lower in 824(pMSPOA). Therefore, the downregulation of several glycolytic-pathway genes in 824(pMSPOA) corresponds with lower metabolic fluxes.
A number of heat shock-related genes also had a pattern of higher expression at early times in 824(pMSPOA); these genes included groES (CAC2704), htpG (hsp90 [CAC3315]), and hsp18 (CAC3714) and were included in cluster P3. Also included in this cluster were three genes that are apparently in the cysteine biosynthesis pathway: an ABC sulfate transporter (CAC0107; a cysP homolog), cysD (CAC0109), and cysK (CAC2235). Cluster P0 included a DnaJ-family molecular chaperone (CAC0648), the solventogenic gene adc (CAP0165), a second fabG transcript (CAC3462), an alcohol dehydrogenase gene (CAC1331), and the sigma factor sigG (CAC1696). Cluster P1 included two endoglucanases (CAC0214 and CAC2556).
824(pMSPOA) exhibits increased tolerance and prolonged and enhanced solvent production under butanol stress.
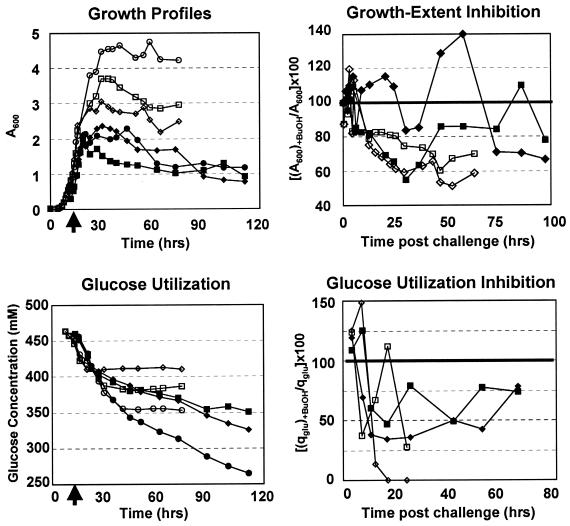
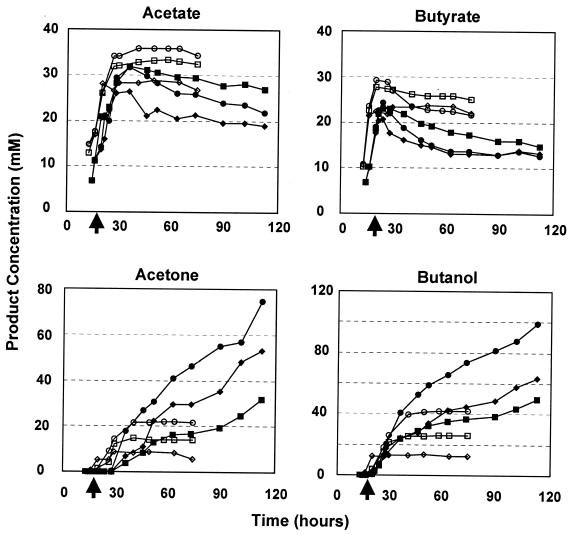
Static flask cultures (n = 3) of 824(pMSPOA) and 824(pIMP1) were grown to exponential phase (A600, ∼0.6 to 0.7) and then split into four separate flasks, three of which were challenged with 0.2, 0.4, or 0.6% (vol/vol) butanol. The challenged cultures were not typically inhibited within the first 5 h postchallenge (Fig. 5). Butanol-challenged 824(pIMP1) cultures showed 60 to 80% of the unchallenged culture density in stationary phase (t = 25 to 70 h postchallenge). In contrast to the results of bioreactor fermentation experiments (Fig. 1), 824(pMSPOA) grew to significantly lower cell densities than 824(pIMP1) in static flask cultures (n = 3) (Fig. 5). In contrast again to bioreactor experiments (Fig. 1), 824(pMSPOA) produced significantly larger amounts of solvents (despite the lower cell densities) than 824(pIMP1) in static flask cultures (Fig. 6). We have no explanation for these differences, which are presumably due to pH control-associated effects. 824(pMSPOA) cultures challenged with 0.2 and 0.6% butanol typically showed densities 60 to 85% of the unchallenged culture density. In three independent butanol challenge experiments with strain 824(pMSPOA), there was significantly more variability in the cellular response to various butanol levels (0.2, 0.4, and 0.6%) than with other strains [the wild type, 824(pIMP1), and the two strains in reference 31] (data not shown). In some experiments the challenged culture grew better than the unchallenged culture. We believe that this is due to the highly heterogeneous population of the faster-differentiating cells and the very viscous and clumping nature of the 824(pMSPOA) cells (see also reference 13). This apparently results in somewhat different cell populations in the smaller flasks when the larger mother flask is split into four flasks for the butanol challenge experiments (see Materials and Methods). Nevertheless, in all experiments, 824(pMSPOA) cultures showed significantly higher tolerance to butanol challenges than plasmid control cultures or the wild type (data not shown). Unchallenged and challenged 824(pIMP1) cultures stopped utilizing glucose 30 h postchallenge, while 824(pMSPOA) continued to consume glucose over 100 h after the butanol challenge (Fig. 5). 824(pIMP1) cultures challenged with 0.6% butanol could utilize glucose at only 13% of the rate of the unchallenged culture at 9 h postchallenge, and with a 0.2% butanol challenge the glucose utilization rate was 27% that of the unchallenged culture at 18 h postchallenge. 824(pMSPOA) cultures were less inhibited at both the 0.2 and 0.6% challenge levels, with glucose utilization rates at 45 to 75% that of the unchallenged culture up to 70 h postchallenge.
FIG. 5.
Growth and glucose utilization and inhibition profiles for 824(pMSPOA) (solid symbols) and 824(pIMP1) (open symbols) cultures challenged with butanol. Circles, unchallenged cultures; squares and diamonds, cultures challenged with 0.2 and 0.6% butanol, respectively. Arrows on the x axis indicate time of butanol challenge.
FIG. 6.
Product profiles for butanol-challenged cultures of 824(pMSPOA) (solid symbols) and 824(pIMP1) (open symbols). Circles, unchallenged cultures; squares and diamonds, cultures challenged with 0.2 and 0.6% butanol, respectively. Arrows on the x axis indicate time of butanol challenge.
The ability of challenged 824(pMSPOA) cultures to utilize more glucose resulted in a concomitant increase in solvent production (Fig. 6). Unchallenged 824(pMSPOA) cultures produced as much as 100 mM butanol and 75 mM acetone; cultures challenged with 0.2 and 0.6% butanol produced 50 to 65 mM butanol and 30 to 52 mM acetone, respectively. These cultures continued to produce solvents even at the end of the experiment (112 h postchallenge). Unchallenged 824(pIMP1) cultures produced 42 mM butanol and 22 mM acetone at 40 h (28 h postchallenge). Butanol challenge severely inhibited the ability of 824(pIMP1) to produce solvents; cultures challenged with 0.6% butanol could produce only 13 mM butanol and 8 mM acetone. 824(pIMP1) cultures produced higher peak levels of acetate and butyrate: as much as 35 mM acetate (with very little reassimilated to produce solvents) and 25 mM butyrate. We conclude that accelerated differentiation of the 824(pMSPOA) cells allows them to utilize more glucose and produce more solvents under butanol stress than the plasmid control strain.
Transcriptional analysis of butanol-stressed 824(pMSPOA) cultures.
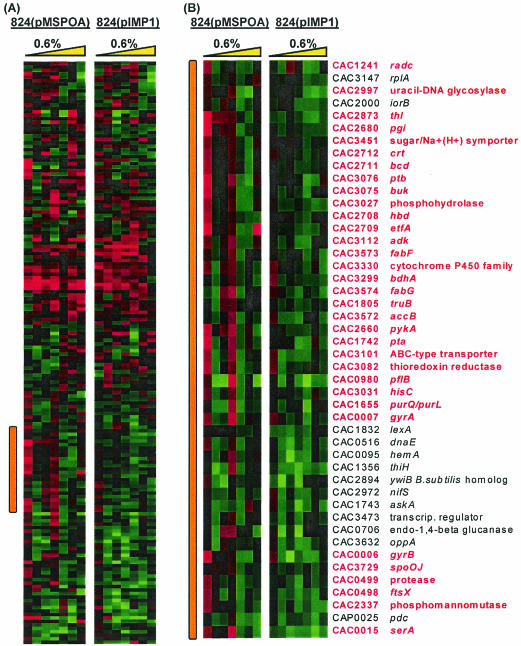
RNA samples of the challenged (0.6% [vol/vol] butanol) and unchallenged cultures were taken at 0.17, 0.5, 1, 2, 6, 12, and 24 h after butanol challenge. Two microarray slides (with dye swap) were hybridized for each time point with the exception of the 2- and 6-h samples from 824(pIMP1), where three hybridizations were performed. Data were normalized, and differentially expressed genes were identified to a 95% confidence interval (36). For further analysis, 168 genes that had differential expression at two or more time points in the two experiments were identified (Fig. 7A); these genes were organized using average linkage hierarchical clustering (10).
FIG. 7.
(A) Expression ratio profiles for all 168 differentially expressed genes in butanol-challenged 824(pMSPOA) and 824(pIMP1) cultures. (B) Detail from panel A (location marked by orange vertical bar) identifying genes that show significant upregulation in 824(pMSPOA) (designations printed in red). Samples were taken at 0.17, 0.5, 1, 2, 6, 12, and 24 h post-butanol stress. Yellow triangle represents the direction of increasing time following butanol stress.
The patterns of higher and lower expression after stress were generally consistent for the two strains. Within the cluster of genes that were predominantly expressed at lower levels, there were several genes that exhibited higher expression at 0.17 and/or 2 h in the challenged 824(pMSPOA) culture only (Fig. 7B). Many of these genes were expressed at lower levels in the transitional or stationary phase of the fermentation cultures (Fig. 3). For example, several genes related to butyrate formation, including hbd (CAC2708, encoding β-hydroxybutyryl-CoA dehydrogenase), bcd (CAC2711, encoding butyryl-CoA dehydrogenase), thl (CAC2873, encoding thiolase), and buk (CAC3075, encoding butyrate kinase), were upregulated within 10 min of butanol challenge and were included in a cluster (P5) indicative of downregulation during the stationary phase of the 824(pMSPOA) fermentation (Fig. 3). Two more genes upregulated during the first 10 min of butanol stress are related to butyrate formation: crt (CAC2712, encoding crotonase) and ptb (CAC3076, encoding phosphate butyryltransferase). A sugar symporter (CAC3451), the cell division gene ftsX and an adjacent protease (CAC0498 and CAC0499), and hisC (CAC3031, encoding histidinol-phosphate aminotransferase) were all also upregulated within 10 min of butanol stress and were also included in the stationary-phase downregulation cluster P5.
Additional genes upregulated at 0.17 and/or 2 h (Fig. 7B) included pykA (CAC2660, encoding pyruvate carboxylase), an ABC transporter (CAC3101), a thioredoxin reductase gene (CAC3082), a pyruvate-formate lyase gene (CAC0980), pta (CAC1742, encoding phosphate acetyltransferase), and the gyrase holoenzyme subunit genes gyrB (CAC0006) and gyrA (CAC0007). Several fatty acid synthesis genes were upregulated at 2 h, including fabF and fabG [CAC3573, encoding 3-oxoacyl-(acyl carrier protein) synthase I, and CAC3574, encoding 3-ketoacyl-acyl carrier protein reductase] and accB (CAC3572, encoding the biotin carboxyl carrier protein of acetyl-CoA carboxylase). Genes related to nucleotide and amino acid synthesis in this upregulated cluster include hisC (an amino acid metabolism gene), serA (CAC0015, encoding d-3-phosphoglycerate dehydrogenase, involved in amino acid metabolism), radC (CAC1241, a DNA repair gene), uracil-DNA glycosylase (CAC2997, a DNA repair gene), purQ/purL (CAC1655, a purine metabolism gene), sigA (CAC1300, encoding primary sigma factor σA), spo0J (CAC3729, a DNA packing and segregation gene), and truB (CAC1805, encoding pseudouridine synthase, involved in pyrimidine metabolism). We conclude that early after butanol challenge, strain 824(pMSPOA) showed higher expression of several genes related to butyryl-CoA and butyrate synthesis and assimilation; DNA synthesis, repair, and topology; and fatty acid synthesis. Some of these genes may be related to the enhanced butanol tolerance of this strain.
Comparison of spo0A- and groESL-induced butanol tolerance.
We also wanted to identify which genes are part of the general response to butanol stress and which genes might be uniquely associated with the stress response of strain 824(pMSPOA). To do so, we compared our results to data from butanol challenge experiments involving the heat shock protein-overexpressing strain 824(pGROE1) (which overexpresses groESL with a thiolase promoter [31, 32]) at two different butanol challenge levels (0.25 and 0.75% [vol/vol]) and its plasmid control 824(pSOS95del) (0.75% butanol challenge only). Strain 824(pGROE1) also exhibits increased butanol tolerance (31).
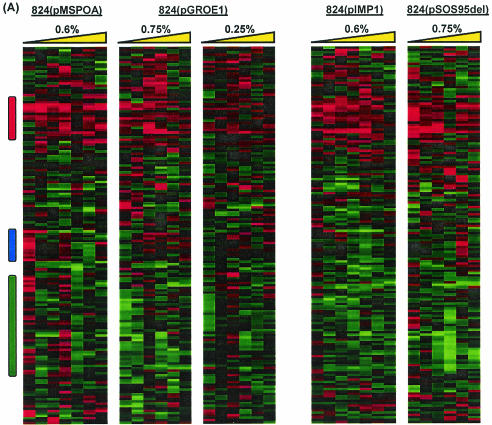
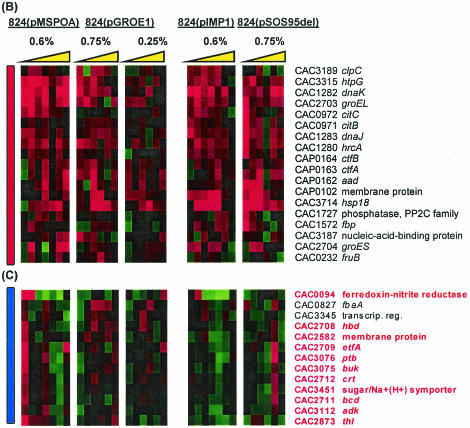
We identified 160 genes that were differentially expressed in at least three of the experiments. These were grouped by average linkage hierarchical clustering (Fig. 8A). There is clearly a region of common upregulation in all five experiments (Fig. 8B). Several stress response genes are in this group, including clpC (CAC3189), dnaJK (CAC1283 and CAC1282), groESL (CAC2704 and CAC2703), hsp18 (CAC3714), and hrcA (CAC1280, encoding a regulator of class I heat shock protein transcription). The solvent formation genes aad, ctfA, and ctfB had higher expression at nearly every time point across all five experiments. This is consistent with the observations of Tomas et al. (31) and further suggests the classification of these genes as part of the global stress response. Other strongly upregulated genes include citBC (CAC0971, encoding aconitase A, and CAC0972, encoding isocitrate dehydrogenase; earlier annotations of the C. acetobutylicum genome list these genes as leuCD and leuB) and a pSOL1 megaplasmid membrane protein (CAP0102, homologous to B. subtilis ydgH). While C. acetobutylicum does not appear to utilize the full Krebs cycle in its metabolism, citBC have been found to be necessary for sporulation in B. subtilis. Deletion of citC in B. subtilis blocks sporulation in stage I (16), and Escherichia coli citC mutants have been found to be thermosensitive (6). B. subtilis citB mutants do not sporulate efficiently and are typically blocked in stage 0; the mutation is thought to interfere with the spo0A phosphorelay (7).
FIG. 8.
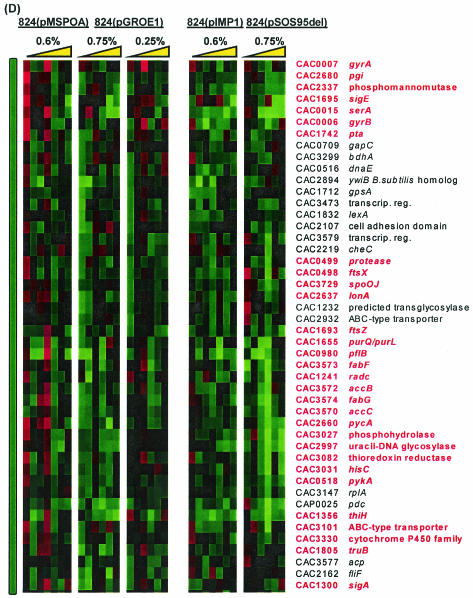
(A) Comparison of differential expression of genes due to butanol challenge in five experiments. Colored vertical bars indicate regions of interest shown in detail in panels with corresponding bars. (B through D) Detailed views of genes that were universally upregulated (B) (red), upregulated at 0.17 h postchallenge in 824(pMSPOA) but not in 824(pGROE1) (C) (blue), and upregulated at 0.17 and/or 2 h in 824(pMSPOA) but not at all in 824(pGROE1) (D) (green). 824(pMSPOA) and 824(pIMP1) samples were taken at 0.17, 0.5, 1, 2, 6, 12, and 24 h after butanol stress. 824(pGROE1) and 824(pSOS95del) samples were taken at 0.25, 1, 3, 6, 12, and 24 h after butanol stress. Yellow triangle represents the direction of increasing time following butanol stress.
As in the comparison to 824(pIMP1), the main differences between the responses to butanol stress in 824(pMSPOA) and 824(pGROE1) consisted in the expression of genes which were expressed at higher levels at early time points postchallenge but at lower levels later (Fig. 8C and D). Figure 8C highlights a cluster of genes that showed upregulation at 10 min postchallenge in 824(pMSPOA) but were upregulated at 3 to 6 h in 824(pGROE1). Many of these genes, particularly hbd, crt, bcd, ptb, and buk, are involved in butyrate formation. Also included in this cluster are thiolase, which is upregulated only in 824(pMSPOA), and a sugar symporter. Figure 8D consists primarily of genes that were upregulated within 10 min of butanol stress in 824(pMSPOA) but not at all in 824(pGROE1). These include ftsX and an adjacent protease, the glycolytic gene pgi (CAC2680, encoding glucose-6-phosphate isomerase), a phosphomannomutase gene (CAC2337), and the mother cell-specific sigma factor sigE (CAC1695). Several genes, including the fatty acid synthesis genes accCB and fabFG, bdhA, and other genes from Fig. 7B, were upregulated at 0.17 and 2 h in 824(pMSPOA) but not at all in 824(pGROE1) (Fig. 8D). While upregulation of the genes previously mentioned was observed in both 824(pMSPOA) and 824(pGROE1), in many cases the upregulation was not as profound in 824(pGROE1).
DISCUSSION
Overexpression of the spo0A gene results in accelerated differentiation, highlighted by a higher percentage of cells in either the swollen clostridial form or the endospore (13). Overexpression of spo0A in C. acetobutylicum does not drastically alter solvent production but results in large-scale changes in the cellular transcriptional program (Fig. 3). As expected, genes involved in solventogenesis (ctfB, adc, bdhB) were differentially expressed (compared to the plasmid control strain) at two or more time points, while several genes related to motility and chemotaxis were expressed at lower levels in 824(pMSPOA) (Fig. 3). The decreased expression of glycolytic genes (Fig. 4B) and the corresponding metabolic fluxes are probably due to the accelerated onset of sporulation in 824(pMSPOA). Schreiber and Dürre have previously noted that a tpi transcript is expressed at lower levels in solventogenic cells than in acidogenic cells (25), and decreases in the glycolytic fluxes during sporulation have been noted (32). The higher expression of several heat shock proteins at 15 h is a particularly interesting result, because spo0A is not known to directly regulate the expression of these genes. Heat shock proteins are known to be induced at the start of solventogenesis (23); however, spo0A overexpression does not induce earlier solvent formation in bioreactor cultures.
Due to the highly complex nature of transcriptional regulation, it is expected that either many of the genes differentially expressed due to spo0A overexpression (Fig. 3) would be directly regulated by Spo0A binding or their differential expression would be the product of a secondary effect due to morphological changes or sigma factor binding (11, 20). Previous predictions (30) of 0A binding sites in intergenic regions were compared with the differentially expressed genes diagramed in Fig. 3 in order to search for enrichments within clusters in the number of genes predicted to be Spo0A regulated. By using the 0A box sequence 5′-TGNCGAA-3′ and previously described predicted transcriptional units (30), 51% of all genes were predicted to be regulated by Spo0A; the frequencies of predicted Spo0A regulation in the individual clusters of Fig. 3 ranged from 36 to 56%. Because the 0A-binding motif is only 7 bases long, the high number of false positives masks the actual number of genes regulated by Spo0A.
The arrays used in these experiments are targeted microarrays that contain approximately one-fourth of the C. acetobutylicum genome. Genes in this generation of arrays include, among others, nearly all pSOL1 open reading frames, 123 DNA replication and repair genes (90% of the total of such genes as identified by the genome annotation), 97 cell division- and sporulation-related genes (92%), 85 carbohydrate and primary metabolism genes (31%), 67 energy production genes (52%), 63 outer membrane and cell envelope genes (36%), 48 lipid metabolism genes (80%), 42 motility and chemotaxis genes (39%), and all previously identified stress response genes.
The sporulation sigma factor sigF (CAC2306) exhibited nominally higher expression at time points A to F in 824(pMSPOA) [maximum, 23% higher expression than in 824(pIMP1) (data not shown)], but none of these time points were statistically significant. At time point G, the gene was differentially downregulated [higher expression in 824(pIMP1)]. This suggests an accelerated time course similar to the expression of aad/ctfAB (Fig. 2). In B. subtilis, the spoIIA operon (spoIIA-spoIIAB-sigF) is transcribed with the σH sigma factor, a process positively regulated by Spo0A through the presence of four 0A boxes (3). The current prediction (30) of sigma factor and 0A box binding sites of the spoIIA operon in C. acetobutylicum indicates potential σE, σF, σG, and σH binding sites and no 0A boxes. These results suggest that transcriptional regulation of sigF in C. acetobutylicum may not be Spo0A dependent.
In B. subtilis the transitional-phase gene regulator abrB is known to be transcribed with the sigma factor σA; transcription is negatively regulated by Spo0A by binding to one of two 0A boxes (27). The C. acetobutylicum genome (21) contains three genes (CAC0310, CAC1941, and CAC3647) annotated as being abrB-like, and two (CAC1941 and CAC3647) of these three genes were included on the microarrays used in this study. Neither gene was differentially expressed in 824(pMSPOA). Due to the high degree of homology and short lengths (240 and 246 bp) of these genes, the microarray probes for the two abrB genes contained a region with 127 out of 161 bp matching; there was also a comparable amount of homology between these probes and an equally short CAC0310 (246 bp). With this degree of similarity, there was probably a high degree of nonspecific binding. The predicted sigma factor binding sites (30) are different for the genes. CAC0310 has predicted σA, σE, σF, σG, and σH binding sites and a predicted 0A box; CAC3647 has predicted σA and σE binding sites and a predicted 0A box. CAC1941 is predicted to lie on a transcript with an adjacent gene (CAC1940) (the B. subtilis abrB gene occurs as a singleton) with a σG binding site and no 0A box. With the information currently available, it is not clear what the roles of the three abrB genes might be in C. acetobutylicum.
824(pMSPOA) exhibits enhanced butanol tolerance, as demonstrated by prolonged glucose utilization (Fig. 5) and extended solvent production (Fig. 6). It is generally accepted that the main mechanism of solvent toxicity in microorganisms is the chaotropic effect of solvents on the cell membrane, which may inhibit active transport, membrane bound ATPases, and glucose uptake (4), partially or completely abolish the membrane ΔpH (4, 15, 29) and Δψ (29), and lower the intracellular pH (4, 15, 29) and ATP concentration (4). It has been shown that clostridial cells increase the saturated-chain content (1, 18, 34) and decrease the fluidity (2) of their lipid membranes in order to adapt to butanol stress. The membrane-related hypothesis of solvent tolerance would suggest that de novo fatty acid synthesis would be required for resistance to solvent stress. Yet the butanol stress experiments indicate that fatty acid metabolism generally decreases upon butanol challenge except in 824(pMSPOA) at 2 h after butanol stress (Fig. 8D).
The observed patterns of differential gene expression in 824(pMSPOA) are likely due to the accelerated differentiation and sporulation of 824(pMSPOA). De novo production of fatty acids has been shown to be required for sporulation in B. subtilis (26), and the accelerated differentiated state in 824(pMSPOA) results in earlier expression of fatty acid synthesis genes than in the plasmid control (Fig. 3). It would be expected that the more robust structures associated with spore development would generally be more resistant to solvents, and this general concept may explain the improved butanol tolerance of 824(pMSPOA). ftsX is found in most bacterial genomes (including B. subtilis and E. coli) and plays a role in cell division and septum formation. Transcription of sigE in B. subtilis (spoIIG) begins near the onset of sporulation, and its product, σE, regulates the transcription of genes involved in spore morphogenesis, genes involved in metabolism within the mother cell, and genes encoding several transcriptional regulators (14). Transcription of such genes apparently leads to enhanced butanol tolerance. Higher expression at early time points of genes related to energy production through butyrate and acetate formation and of genes related to amino acid synthesis, DNA synthesis, and repair may be responsible for, or related to, the improved butanol tolerance of strain 824(pMSPOA).
Acknowledgments
This work was supported by grants BES-9911231 and BES-0331402 from the National Science Foundation and by grant R828562 from the Environmental Protection Agency.
We thank Christopher Tomas, Seshu Tummala, Stefan Junne, and Carlos Parades for technical assistance and helpful discussions, acknowledge use of the Keck Biophysics Facility and the Center for Genetic Medicine facilities at Northwestern University, and thank Abbott Laboratories for donation of clarithromycin.
REFERENCES
- 1.Baer, S. H., H. P. Blaschek, and T. L. Smith. 1987. Effect of butanol challenge and temperature on lipid composition and membrane fluidity of butanol-tolerant Clostridium acetobutylicum. Appl. Environ. Microbiol. 53:2854-2861. [DOI] [PMC free article] [PubMed] [Google Scholar]
- 2.Baer, S. H., D. L. Bryant, and H. P. Blaschek. 1989. Electron spin resonance analysis of the effect of butanol on the membrane fluidity of intact cells of Clostridium acetobutylicum. Appl. Environ. Microbiol. 55:2729-2731. [DOI] [PMC free article] [PubMed] [Google Scholar]
- 3.Baldus, J. M., B. D. Green, P. Youngman, and C. P. Moran. 1994. Phosphorylation of Bacillus subtilis transcription factor Spo0A stimulates transcription from the spoIIG promoter by enhancing binding to weak 0A boxes. J. Bacteriol. 176:296-306. [DOI] [PMC free article] [PubMed] [Google Scholar]
- 4.Bowles, L. K., and W. L. Ellefson. 1985. Effects of butanol on Clostridium acetobutylicum. Appl. Environ. Microbiol. 50:1165-1170. [DOI] [PMC free article] [PubMed] [Google Scholar]
- 5.Buday, Z., J. C. Linden, and M. N. Karim. 1990. Improved acetone butanol fermentation analysis using subambient HPLC column temperature. Enzyme Microb. Technol. 12:24-27. [Google Scholar]
- 6.Choi, I. Y., K. I. Sup, H. J. Kim, and J. W. Park. 2003. Thermosensitive phenotype of Escherichia coli mutant lacking NADP+-dependent isocitrate dehydrogenase. Redox Rep. 8:51-56. [DOI] [PubMed] [Google Scholar]
- 7.Craig, J. E., M. J. Ford, D. C. Blaydon, and A. L. Sonenshein. 1997. A null mutation in the Bacillus subtilis aconitase gene causes a block in Spo0A-phosphate-dependent gene expression. J. Bacteriol. 179:7351-7359. [DOI] [PMC free article] [PubMed] [Google Scholar]
- 8.de Mendoza, D., G. E. Schujman, and P. S. Aguilar. 2002. Biosynthesis and function of membrane lipids, p. 43-55. In A. L. Sonenshein, J. Hoch, and R. Losick (ed.), Bacillus subtilis and its closest relatives: from genes to cells. ASM Press, Washington, D.C.
- 9.Desai, R. P., L. K. Nielsen, and E. T. Papoutsakis. 1999. Stoichiometric modeling of Clostridium acetobutylicum fermentations with non-linear constraints. J. Biotechnol. 71:191-205. [DOI] [PubMed] [Google Scholar]
- 10.Eisen, M. B., P. T. Spellman, P. O. Brown, and D. Botstein. 1998. Cluster analysis and display of genome-wide expression patterns. Proc. Natl. Acad. Sci. USA 95:14863-14868. [DOI] [PMC free article] [PubMed] [Google Scholar]
- 11.Fawcett, P., P. Eichenberger, R. Losick, and P. Youngman. 2000. The transcriptional profile of early to middle sporulation in Bacillus subtilis. Proc. Natl. Acad. Sci. USA 97:8063-8068. [DOI] [PMC free article] [PubMed] [Google Scholar]
- 12.Feucht, A., I. Lucet, M. D. Yudkin, and J. Errington. 2001. Cytological and biochemical characterization of the FtsA cell division protein of Bacillus subtilis. Mol. Microbiol. 40:115-125. [DOI] [PubMed] [Google Scholar]
- 13.Harris, L. M., N. E. Welker, and E. T. Papoutsakis. 2002. Northern, morphological, and fermentation analysis of spo0A inactivation and overexpression in Clostridium acetobutylicum ATCC 824. J. Bacteriol. 184:3586-3597. [DOI] [PMC free article] [PubMed] [Google Scholar]
- 14.Helmann, J. D., and C. P. Moran. 2002. RNA polymerase and sigma factors, p. 289-312. In A. L. Sonenshein, J. Hoch, and R. Losick (ed.), Bacillus subtilis and its closest relatives: from genes to cells. ASM Press, Washington, D.C.
- 15.Huang, L., L. N. Gibbins, and C. W. Forsberg. 1985. Transmembrane pH gradient and membrane potential in Clostridium acetobutylicum during growth under acetogenic and solventogenic conditions. Appl. Environ. Microbiol. 50:1043-1047. [DOI] [PMC free article] [PubMed] [Google Scholar]
- 16.Jin, S. F., P. A. Levin, K. Matsuno, A. D. Grossman, and A. L. Sonenshein. 1997. Deletion of the Bacillus subtilis isocitrate dehydrogenase gene causes a block at stage I of sporulation. J. Bacteriol. 179:4725-4732. [DOI] [PMC free article] [PubMed] [Google Scholar]
- 17.Kemp, J. T., A. Driks, and R. Losick. 2002. FtsA mutants of Bacillus subtilis impaired in sporulation. J. Bacteriol. 184:3856-3863. [DOI] [PMC free article] [PubMed] [Google Scholar]
- 18.Lepage, C., F. Fayolle, M. Hermann, and J. P. Vandecasteele. 1987. Changes in membrane-lipid composition of Clostridium acetobutylicum during acetone butanol fermentation: effects of solvents, growth temperature and pH. J. Gen. Microbiol. 133:103-110. [Google Scholar]
- 19.Mermelstein, L. D., N. E. Welker, G. N. Bennett, and E. T. Papoutsakis. 1992. Expression of cloned homologous fermentative genes in Clostridium acetobutylicum ATCC 824. Bio/Technology 10:190-195. [DOI] [PubMed] [Google Scholar]
- 20.Molle, V., M. Fujita, S. T. Jensen, P. Eichenberger, J. E. Gonzalez-Pastor, J. S. Liu, and R. Losick. 2003. The Spo0A regulon of Bacillus subtilis. Mol. Microbiol. 50:1683-1701. [DOI] [PubMed] [Google Scholar]
- 21.Nölling, J., G. Breton, M. V. Omelchenko, K. S. Makarova, Q. Zeng, R. Gibson, H. M. Lee, J. Dubois, D. Qiu, J. Hitti, Y. Wolf, R. L. Tatusov, F. Sabathe, L. Doucette-Stamm, P. Soucaille, M. J. Daly, G. N. Bennett, E. V. Koonin, and D. R. Smith. 2001. Genome sequence and comparative analysis of the solvent-producing bacterium Clostridium acetobutylicum. J. Bacteriol. 183:4823-4838. [DOI] [PMC free article] [PubMed] [Google Scholar]
- 22.Papoutsakis, E. T. 1984. Equations and calculations for fermentations of butyric acid bacteria. Biotechnol. Bioeng. 26:174-187. [DOI] [PubMed] [Google Scholar]
- 23.Pich, A., F. Narberhaus, and H. Bahl. 1990. Induction of heat shock proteins during the initiation of solvent formation in Clostridium acetobutylicum. Appl. Microbiol. Biotechnol. 33:697-704. [Google Scholar]
- 24.Ravagnani, A., K. C. Jennert, E. Steiner, R. Grunberg, J. R. Jefferies, S. R. Wilkinson, D. I. Young, E. C. Tidswell, D. P. Brown, P. Youngman, J. G. Morris, and M. Young. 2000. Spo0A directly controls the switch from acid to solvent production in solvent-forming clostridia. Mol. Microbiol. 37:1172-1185. [DOI] [PubMed] [Google Scholar]
- 25.Schreiber, W., and P. Dürre. 2000. Differential expression of genes within the gap operon of Clostridium acetobutylicum. Anaerobe 6:291-297. [Google Scholar]
- 26.Schujman, G. E., R. Grau, H. C. Gramajo, L. Ornella, and D. de Mendoza. 1998. De novo fatty acid synthesis is required for establishment of cell type-specific gene transcription during sporulation in Bacillus subtilis. Mol. Microbiol. 29:1215-1224. [DOI] [PubMed] [Google Scholar]
- 27.Strauch, M., V. Webb, G. Spiegelman, and J. A. Hoch. 1990. The Spo0A protein of Bacillus subtilis is a repressor of the abrB gene. Proc. Natl. Acad. Sci. USA 87:1801-1805. [DOI] [PMC free article] [PubMed] [Google Scholar]
- 28.Tamayo, P., D. Slonim, J. Mesirov, Q. Zhu, S. Kitareewan, E. Dmitrovsky, E. S. Lander, and T. R. Golub. 1999. Interpreting patterns of gene expression with self-organizing maps: methods and application to hematopoietic differentiation. Proc. Natl. Acad. Sci. USA 96:2907-2912. [DOI] [PMC free article] [PubMed] [Google Scholar]
- 29.Terracciano, J. S., and E. R. Kashket. 1986. Intracellular conditions required for the initiation of solvent production by Clostridium acetobutylicum. Appl. Environ. Microbiol. 52:86-91. [DOI] [PMC free article] [PubMed] [Google Scholar]
- 30.Tomas, C. A., K. V. Alsaker, H. P. J. Bonarius, W. T. Hendriksen, H. Yang, J. A. Beamish, C. J. Parades, and E. T. Papoutsakis. 2003. DNA-array based transcriptional analysis of asporogenous, non-solventogenic Clostridium acetobutylicum strains SKO1 and M5. J. Bacteriol. 185:4539-4547. [DOI] [PMC free article] [PubMed] [Google Scholar]
- 31.Tomas, C. A., J. Beamish, and E. T. Papoutsakis. 2004. Transcriptional analysis of butanol stress and tolerance in Clostridium acetobutylicum. J. Bacteriol. 186:2006-2018. [DOI] [PMC free article] [PubMed]
- 32.Tomas, C. A., N. E. Welker, and E. T. Papoutsakis. 2003. Overexpression of groESL in Clostridium acetobutylicum results in increased solvent production and tolerance, prolonged metabolism, and large changes in the cell's transcriptional program. Appl. Environ. Microbiol. 69:4951-4965. [DOI] [PMC free article] [PubMed] [Google Scholar]
- 33.Tummala, S. B., N. E. Welker, and E. T. Papoutsakis. 2003. Design of antisense RNA constructs for downregulation of the acetone formation pathway of Clostridium acetobutylicum. J. Bacteriol. 185:1923-1934. [DOI] [PMC free article] [PubMed] [Google Scholar]
- 34.Vollherbst-Schneck, K., J. A. Sands, and B. S. Montenecourt. 1984. Effect of butanol on lipid composition and fluidity of Clostridium acetobutylicum ATCC 824. Appl. Environ. Microbiol. 47:193-194. [DOI] [PMC free article] [PubMed] [Google Scholar]
- 35.Wiesenborn, D. P., F. B. Rudolph, and E. T. Papoutsakis. 1988. Thiolase from Clostridium acetobutylicum ATCC 824 and its role in the synthesis of acids and solvents. Appl. Environ. Microbiol. 54:2717-2722. [DOI] [PMC free article] [PubMed] [Google Scholar]
- 36.Yang, H., H. Haddad, C. Tomas, K. Alsaker, and E. T. Papoutsakis. 2003. A segmental nearest neighbor normalization and gene identification method gives superior results for DNA-array analysis. Proc. Natl. Acad. Sci. USA 100:1122-1127. [DOI] [PMC free article] [PubMed] [Google Scholar]


