

Abstract
OBJECTIVE
The objective of our study was to evaluate the effect of varying arterial input function (AIF) placement on the qualitative and quantitative CT perfusion parameters.
MATERIALS AND METHODS
Retrospective analysis of CT perfusion data was performed on 14 acute stroke patients with a proximal middle cerebral artery (MCA) clot. Cerebral blood flow (CBF), cerebral blood volume (CBV), and mean transit time (MTT) maps were constructed using a systematic method by varying only the AIF placement in four positions relative to the MCA clot including proximal and distal to the clot in the ipsilateral and contralateral hemispheres. Two postprocessing software programs were used to evaluate the effect of AIF placement on perfusion parameters using a delay-insensitive deconvolution method compared with a standard deconvolution method.
RESULTS
One hundred sixty-eight CT perfusion maps were constructed for each software package. Both software programs generated a mean CBF at the infarct core of < 12 mL/100 g/min and a mean CBV of < 2 mL/100 g for AIF placement proximal to the clot in the ipsilateral hemisphere and proximal and distal to the clot in the contralateral hemisphere. For AIF placement distal to the clot in the ipsilateral hemisphere, the mean CBF significantly increased to 17.3 mL/100 g/min with delay-insensitive software and to 19.4 mL/100 g/min with standard software (p < 0.05). The mean MTT was significantly decreased for this AIF position. Furthermore, this AIF position yielded qualitatively different parametric maps, being most pronounced with MTT and CBF. Overall, CBV was least affected by AIF location.
CONCLUSION
For postprocessing of accurate quantitative CT perfusion maps, laterality of the AIF location is less important than avoiding AIF placement distal to the clot as detected on CT angiography. This pitfall is less severe with deconvolution-based software programs using a delay-insensitive technique than with those using a standard deconvolution method.
Introduction
In recent years, there has been growing interest in using perfusion imaging in the initial diagnosis and management of acute stroke patients. Therefore, standardization of these methods is being developed for the data acquisition, postprocessing, interpretation, and management decision making. CT perfusion is frequently used in assessing acute stroke patients because of its many advantages including its widespread availability; rapid sequential scanning; limited patient contraindications; and, importantly, its direct access from emergency departments. An additional benefit of using CT perfusion is the ability to interpret the parametric maps both qualitatively and quantitatively. Quantitative analysis allows development of guidelines for management decisions using threshold values to identify the infarct core, ischemic penumbra, and normal tissue.
The creation of accurate quantitative maps of cerebral blood flow (CBF), cerebral blood volume (CBV), and mean transit time (MTT) using the deconvolution method has been previously validated [1–5]. The computation of these parametric maps may be performed as a fully automated process or as a semiautomated process. The semiautomated process allows the observer to select an appropriate artery to represent the arterial input function (AIF) and a vein to represent the venous function. From these arterial and venous time–attenuation curves, the observer then determines the pre- and postenhancement cutoff values for the calculation of the perfusion parameters. During data acquisition it is essential to select slice locations in the brain that contain a major intracranial artery to represent the AIF.
Selection of the appropriate AIF location for postprocessing of CT perfusion data sets in patients with acute cerebral ischemia remains controversial. There has not been a general consensus as to whether the AIF should be chosen ipsilateral or contralateral to the affected hemisphere [6, 7]. A theoretic concern is that selecting an ipsilateral AIF may result in underestimation of the CBF values in the affected hemisphere because of the delay in the arrival and dispersion of contrast agent [8, 9]. On the other hand, using a contralateral vessel for AIF placement may not accurately reflect the quantitative hemodynamic parameters of the affected hemisphere [8, 10]. Furthermore, using the ipsilateral AIF location proximal or distal to the clot has not been fully explored. To date, no data estimating the quantitative effect on the perfusion parameters in selecting an ipsilateral AIF relative to the position of the arterial clot have been published to our knowledge.
The purpose of this study was to evaluate the qualitative appearance and quantitative values in the infarct core on the CT perfusion maps using variable placement of the AIF region of interest (ROI) in the middle cerebral artery (MCA), both proximal and distal to the clot in the ipsilateral and contralateral hemispheres. Two postprocessing perfusion software programs were used to evaluate the effects of using a standard deconvolution method compared with using a deconvolution method that includes a delay-insensitive technique.
Materials and Methods
Retrospective analysis of CT perfusion data sets of 35 patients enrolled in a prospective cohort study at our institution was performed. In this study protocol, emergency CT angiography (CTA) and CT perfusion were performed in patients with suspected acute MCA infarction. Only patients with a unilateral proximal MCA clot confirmed by CTA on admission were included in the study. CT perfusion data sets with severe motion artifact, slice locations that did not include the proximal segment of the MCA or the area of infarction, poor contrast bolus, and incomplete acquisition of the arterial or venous time–attenuation curves were not included in the analysis. Twenty-one CT perfusion examinations were excluded because of severe motion artifacts (n = 9), slice locations did not include the area of infarction (n = 3) or the proximal segment of the MCA (n = 4), and poor contrast bolus injection with incomplete arterial or venous time–attenuation curves (n = 5). Institutional review board approval was obtained.
The imaging protocol in the study included unenhanced CT of the head at admission, which was immediately followed by acquisition of CTA and CT perfusion examinations. All patients also underwent follow-up brain MRI with diffusion-weighted imaging (DWI) to confirm the presence of an infarct within 60 minutes after the initial unenhanced CT scan. The acquired images from the CT perfusion study were transferred to a workstation (Advantage, version ADW 4.2, GE Healthcare) for postprocessing.
Scanning Protocols
Unenhanced CT and CT angiography
Unenhanced CT and CTA of the head were performed according to standard departmental protocols using a 16- or 64-MDCT scanner. Unenhanced axial CT images were obtained with the patient’s head placed in a head holder. Following strict protocol, scanning parameters were applied with minimal variation between scanners and subjects. For the unenhanced CTA examination, the parameters were 120–140 kVp, 170 mA, a 2-second scan time, and a 5-mm section thickness. Immediately after that study, biphasic helical CTA was performed from the aortic arch to the vertex with the IV administration of 65 mL of iopamidol (Isovue 370, Bracco), a nonionic contrast agent, delivered using a power injector through an 18-gauge catheter at an injection rate of 4 mL/s, followed by 40 mL of saline solution. The scanning parameters for CTA were 140 kVp, 270 mA, a 1.0-second rotation time, a 1.25-mm reconstruction interval, table speed of 3.75 mm per rotation, and a 0.75:1 pitch. The CTA source images were then reconstructed into standard maximum-intensity-projection views of the intracranial and extracranial vasculature.
CT perfusion
CT perfusion was performed using the cine scanning mode (one image per second) with 80 kVp, 200 mAs, a 5-mm slice thickness, and total brain coverage of 40 mm. A 4-second scanning delay was used after the IV injection of 40 mL of nonionic contrast material (Isovue 370) at 4 mL/s, followed by 40 mL of saline solution. The gantry angle was selected to avoid radiation exposure to the orbits. The total scan time was 60 seconds. The inferior slice was selected at the level of the basal ganglia to include the vascular territory from the MCA and anterior and posterior cerebral arteries.
MRI
MRI was performed using a 1.5- or 3-T scanner with the patient’s head positioned in a head coil. Diffusion-weighted imaging (DWI) of the entire brain was performed with an echo-planar single-shot spin-echo sequence by applying three diffusion gradients in three orthogonal directions. A b value of 1,000 s/mm was used.
Postprocessing and Imaging Review
The CT perfusion data sets were transferred to two different workstations to construct CBF, CBV, and MTT maps using standard methods with two commercially available software packages based on deconvolution techniques: software A, a delay-insensitive technique (FuncTool 2: CT Perfusion 4.0, version 2006, GE Healthcare) and software B, standard technique (Brain Perfusion Research, version 2004, Philips Healthcare). Each set of parametric maps was reconstructed several times by systematically and independently varying the location of the AIF in relation to the position of the clot as seen on CTA. A single investigator, a radiologist with more than 1 year of experience with CT perfusion map construction, performed all the AIF selection and quantitative measurements.
The following four AIF locations were used: AIF 1, proximal to the clot on the ipsilateral ischemic side; AIF 2, distal to the clot on the ipsilateral side; AIF 3, symmetric to AIF 1 on the unaffected contralateral side; and AIF 4, symmetric to AIF 2 on the contralateral side. AIFs 3 and 4 were performed on the contralateral side to match the locations of AIFs 1 and 2 on the affected side. AIF 3 was at the proximal MCA, and AIF 4 was at the mid or distal MCA. Their placement confirms the robustness of the technique in the absence of an MCA occlusion and underscores why blinding was not critical for AIF placement. Symmetric placement of the AIF locations on the contralateral side was included for evaluation in this study because there is not a general consensus in the literature as to whether the AIF should be chosen ipsilateral or contralateral to the affected hemisphere [6, 7]. Concerns have been raised regarding the accuracy of perfusion data when using an ipsilateral or contralateral AIF location [8, 10, 11]. We wanted to include all possible AIF locations for evaluation.
Figure 1 shows the four AIF locations. Automated software selection was applied to determine the pixel within each of these four locations that has the maximal baseline to peak interval on the arterial curve to represent the arterial time–attenuation curve. The remaining technical parameters (venous ROI placement, preenhancement and postenhancement cutoff values) were held constant for all iterations of map construction in each patient. Standard placement of the venous function ROI was used in all patients in the posterior aspect of the superior sagittal sinus. The acquired CT perfusion data were reconstructed into 168 parametric maps (CBF, CBV, and MTT) for each software package using the four different AIF locations described earlier in this section.
Figure 1.
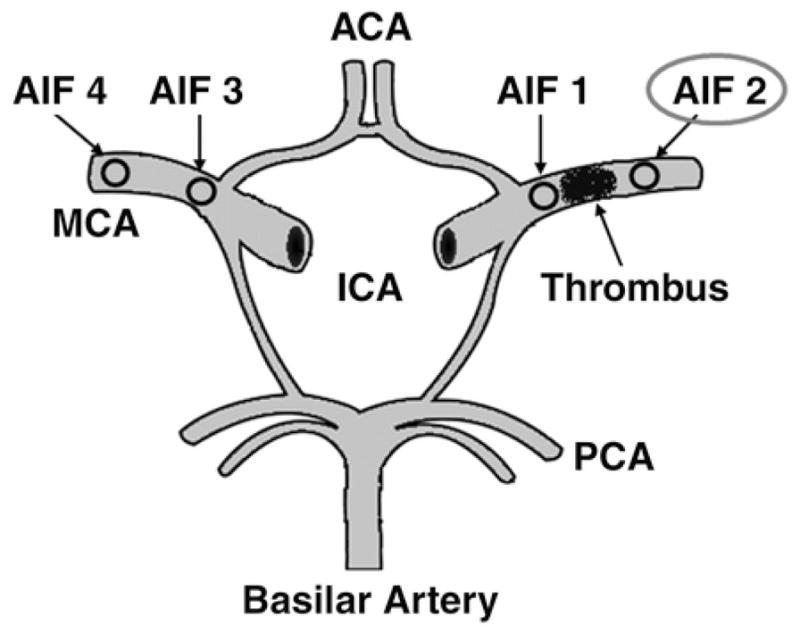
Schematic drawing of circle of Willis shows locations of different arterial input function (AIF) placements. AIF 1 represents location selected proximal to clot on ipsilateral ischemic side, AIF 2 represents location selected distal to clot on ipsilateral side, AIF 3 represents contralateral location of AIF 1 on unaffected side, and AIF 4 represents contralateral location of AIF 2 on unaffected side. ACA = anterior cerebral artery, ICA = internal carotid artery, MCA = middle cerebral artery, PCA = posterior cerebral artery.
Quantitative analysis of the four groups of parametric maps was performed by ROI analysis sampling the infarct core and unaffected contralateral gray and white matter. The infarct core was defined as the location of the maximal lesion abnormality on DWI for each patient. ROI analysis was performed using a standard technique with identical ROI size and placement for all CBF, CBV, and MTT maps in the four groups of AIF locations. In addition, other parameters empirically known to be useful for perfusion estimates were examined including contrast arrival time, time to peak, and full width at half maximum (FWHM). Qualitative evaluation of CBF, CBV, and MTT maps was performed by consensus rating of two blinded neuroradiology research fellows, each with more than 1 year of experience in the interpretation of CT perfusion maps, to determine the presence of focal perfusion deficits. A perfusion deficit was defined as a focal region of decreased CBF with matched prolongation of MTT distinct from those related to prior brain injury or chronic infarction.
Statistical Analysis
The mean CBF, CBV, and MTT quantitative values were calculated for the study population for each of the four AIF groups. The SD was calculated for each group as a measure of variance. Fisher’s analysis of variance was used to compare the mean quantitative values among the four groups. A p value of < 0.05 was considered statistically significant. The quantitative CT perfusion parameters of the four AIF groups were compared separately for each software package.
Results
Fourteen patients with a unilateral MCA territory infarction were included in the data analysis. The mean age of the study group was 60.8 years, with a range of 38–88 years. There were nine men and five women in the study. All patients had a unilateral proximal MCA clot confirmed by CTA performed at admission. DWI performed within 60 minutes of presentation confirmed an infarct core in the MCA territory in all patients.
The mean quantitative values and the SD for CBV, CBF, and MTT of the infarct core and of unaffected contralateral gray and white matter are shown in Table 1.
Table 1.
Mean Quantitative Perfusion Values for the Infarct Core and for Unaffected Contralateral Gray and White Matter.
| Tissue Selected | Mean Value ± SD | ||
|---|---|---|---|
| CBV (mL/100g tissue) | CBF (mL/100g/min) | Mean Transit Time (s) | |
| Software A (delay-insensitive technique) | |||
| Infarct | |||
| AIF 1 | 1.82 ± 0.82 | 10.86 ± 3.4 | 10.45 ± 2.8 |
| AIF 2 | 2.85 ± 1.20 | 17.34 ± 5.5a | 8.91 ± 3.5a |
| AIF 3 | 1.77 ± 0.98 | 10.12 ± 3.0 | 10.39 ± 2.2 |
| AIF 4 | 1.71 ± 0.9 | 10.33 ± 4.0 | 10.31 ± 2.6 |
| Unaffected gray matter | |||
| AIF 1 | 2.73 ± 1.74 | 42.21 ± 7.7 | 3.48 ± 1.5 |
| AIF 2 | 3.8 ± 1.91 | 44.54 ± 8.5 | 3.11 ± 1.7 |
| AIF 3 | 2.81 ± 1.2 | 40.81 ± 6.2 | 3.54 ± 1.5 |
| AIF 4 | 2.79 ± 1.0 | 38.23 ± 5.3 | 3.7 ± 1.3 |
| Unaffected white matter | |||
| AIF 1 | 1.73 ± 0.6 | 19.82 ± 4.4 | 3.61 ± 1.3 |
| AIF 2 | 1.92 ± 0.8 | 23.65 ± 5.7 | 3.2 ± 1.3 |
| AIF 3 | 1.76 ± 0.55 | 19.46 ± 4.0 | 3.85 ± 1.4 |
| AIF 4 | 1.65 ± 0.53 | 18.09 ± 3.3 | 4.12 ± 1.5 |
| Software B (standard technique) | |||
| Infarct | |||
| AIF 1 | 1.18 ± 0.63 | 8.18 ± 4.3 | 15.1 ± 2.55 |
| AIF 2 | 2.50 ± 1.38 | 19.41 ± 5.9a | 12.6 ± 3.0a |
| AIF 3 | 1.24 ± 0.42 | 7.35 ± 4.1 | 14.8 ± 2.3 |
| AIF 4 | 1.35 ± 0.47 | 7.84 ± 2.9 | 14.7 ± 1.9 |
| Unaffected gray matter | |||
| AIF 1 | 4.2 ± 0.71 | 64.99 ± 10.9 | 5.01 ± 1.8 |
| AIF 2 | 4.75 ± 1.02 | 73.27 ± 15.5 | 6.66 ± 2.5 |
| AIF 3 | 4.29 ± 0.81 | 61.77 ± 8.4 | 5.21 ± 1.9 |
| AIF 4 | 4.33 ± 0.72 | 65.42 ± 9.8 | 5.04 ± 1.5 |
| Unaffected white matter | |||
| AIF 1 | 1.48 ± 0.43 | 20.75 ± 6.6 | 6.8 ± 1.7 |
| AIF 2 | 1.8 ± 0.58 | 38.97 ± 10.3 | 6.46 ± 1.9 |
| AIF 3 | 1.58 ± 0.44 | 23.08 ± 7.3 | 7.15 ± 1.1 |
| AIF 4 | 1.77 ± 0.55 | 29.47 ± 5.1 | 6.96 ± 1.6 |
Note—The following four arterial input function (AIF) locations were used: AIF 1, proximal to the clot on the ipsilateral ischemic side; AIF 2, distal to the clot on the ipsilateral side; AIF 3, symmetric to AIF 1 on the unaffected contralateral side; and AIF 4, symmetric to AIF 2 on the contralateral side.
p < 0.05.
Using software B (standard technique), the overall mean CBF also remained < 12 mL/100 g/min and CBV was < 2 mL/100 g in the infarct core with AIFs 1, 3, and 4. Again, using AIF 2 (distal to the clot) resulted in an increase in the mean quantitative values in the infarct core with a CBF of 19.4 mL/100 g/min and CBV of 2.5 mL/100 g. The mean values were increased by 11.2 mL/100 g/min (94%) for CBF and 1.3 mL/100 g (87%) for CBV when using AIF 2 compared with AIF 1 (proximal to the clot).
A statistically significant difference (p < 0.05) was observed when comparing the CBF and MTT values in the infarct core obtained with AIF 2 (distal to the clot) in comparison with the remaining AIF selections for both software packages. The MTT values were slightly decreased and the CBF values were slightly increased. As shown in Table 1, these variations were less prominent with software A (delay-insensitive technique). This trend was also observed for the CBF and MTT values in the unaffected contralateral gray and white matter. Although not statistically significant (p = 0.083), CBV values for AIF 2 also had an increasing trend compared with AIF 1 in all tissues evaluated. Importantly, no significant difference was observed between the quantitative parametric maps constructed with AIF 1 (proximal to the clot on the ipsilateral ischemic side) compared with AIFs 3 and 4 (proximal and distal to the clot on the unaffected contralateral side, respectively).
Furthermore, AIF 2 yielded qualitatively different parametric maps compared with AIFs 1, 3, and 4 in 43% (6/14) patients (Fig. 2). The differences were most pronounced in the MTT and CBF maps, whereas the CBV maps were the least affected by AIF location. Review of the CTA findings in these six patients revealed complete occlusion of the proximal MCA in three patients and partial MCA occlusion associated with poor collateral circulation in the other three patients (Figs. 3A, 3B, and 3C).
Figure 2.

88-year-old woman with acute onset of left-sided hemiparesis. CT perfusion reveals qualitative differences in cerebral blood flow (CBF) and mean transit time (MTT) perfusion maps in acute stroke patient for variable arterial input function (AIF) locations using software B (standard deconvolution technique). Marked differences in infarct core are seen when using AIF 2 compared with AIF 1, AIF 3, and AIF 4. Arterial time–attenuation curve (red) with AIF 2 also shows marked flattening with mild delay. Note red curve represents arterial time–attenuation curve. Blue curve represents venous time–attenuation curve. CBV = cerebral blood volume.
Figure 3.
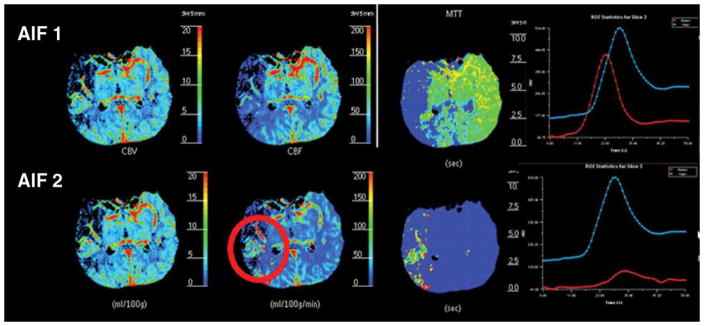
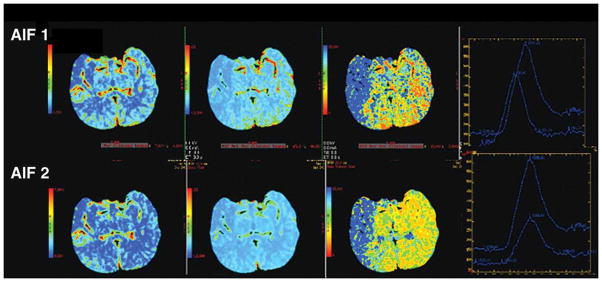
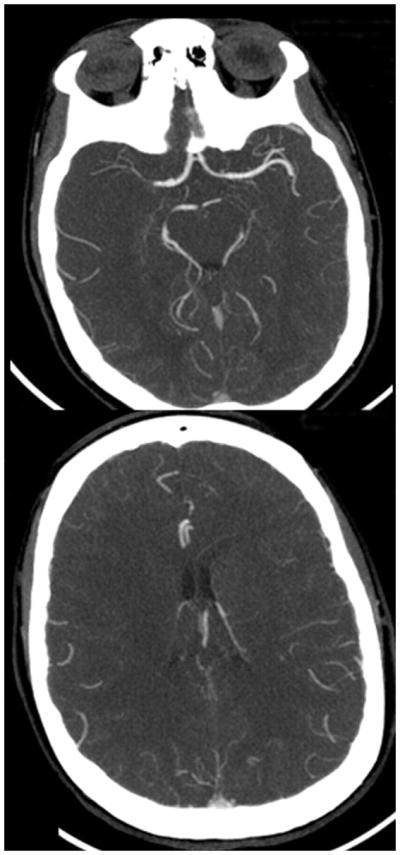
Figure 3A. 80-year-old man with right-sided M1 segment occlusion. CT perfusion shows qualitative differences in CT perfusion color maps using software B (standard technique) obtained with arterial input function (AIF) 1 and AIF 2 in acute stroke patient with poor collateral circulation. Mean transit time (MTT) maps are grossly abnormal, and potential area of penumbra is identified with AIF 1 but not with AIF 2 (red circle). Note delay of contrast arrival and low height of arterial time–attenuation curve with AIF 2 with increased full width at half maximum.
Figure 3B. 80-year-old man with right-sided M1 segment occlusion. CT perfusion color maps using software A (delay-insensitive technique) obtained with arterial input function (AIF) 1 and AIF 2 show qualitative differences, although to lesser degree, that are similar to those shown using software B. Importantly, potential area of ischemic penumbra is visualized with both AIF locations using software A.
Figure 3C. 80-year-old man with right-sided M1 segment occlusion. CT angiography source images show poor collateral circulation.
Specific analysis of the time–attenuation curves showed that AIF 2 (distal to the clot on the ischemic side) resulted in a marked decrease in the maximum curve height when compared with AIF 1 (proximal to the clot on the ischemic side). The mean attenuation in the MCA reached 437.5 HU for AIF 1, 150.5 HU for AIF 2, 387.6 HU for AIF 3, and 276.3 HU for AIF 4. A delay in bolus arrival, ranging up to 5 seconds, was observed in only 64% (9/14) of the patients when using AIF 2. To estimate the possible effect of dispersion on the contrast bolus, the FWHM of the time–attenuation curves was also evaluated. The FWHM of the arterial time–attenuation curve was increased in 33% (2/6) of patients with qualitatively different perfusion maps when using AIF 2. In the remaining 67% (4/6) of patients, the FWHM was not affected by the AIF location, as shown in Figures 4A, 4B, and 4C.
Figure 4.
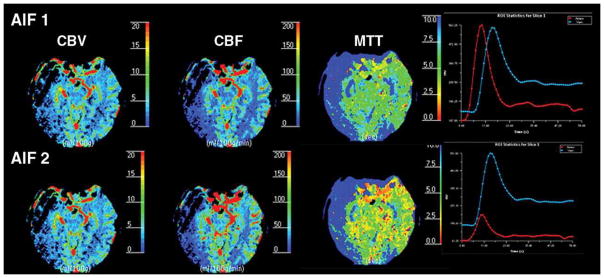
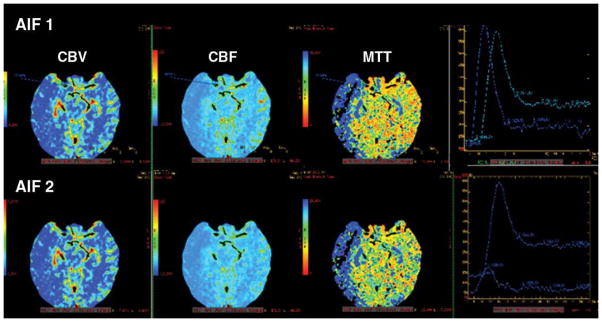
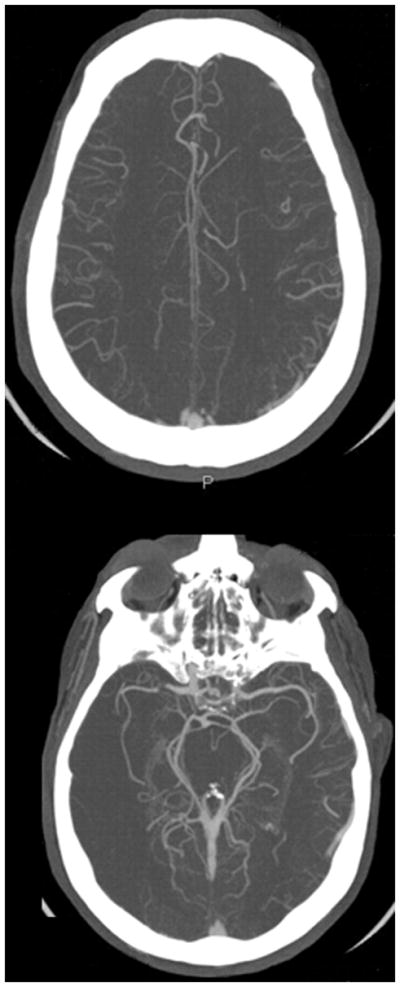
Figure 4A. 52-year-old man with acute right-sided middle cerebral artery infarction. CT perfusion color maps using software B (standard technique) obtained with arterial input function (AIF) 1 and AIF 2 in acute stroke patient with robust collateral circulation. No significant difference is observed in perfusion maps obtained with AIF 1 and AIF 2. Delay in contrast arrival and reduction in height of arterial time–attenuation curve are less prominent with AIF 2, and full width at half maximum was not affected.
Figure 4B. 52-year-old man with acute right-sided middle cerebral artery infarction. CT perfusion color maps using software A (delay-insensitive technique) obtained with AIF 1 and AIF 2 also show no significant difference.
Figure 4C. 52-year-old man with acute right-sided middle cerebral artery infarction. CT angiography source images show robust collateral circulation.
Discussion
Standardization of CT perfusion is gaining increasing priority because it is being widely implemented in the management of acute stroke patients. The quantitative assessment of perfusion parameters is influenced by several factors including the selection of the AIF location used in the postprocessing software. In the simplified three-compartment model, blood flow passes from a single arterial inflow, through the capillary bed, and then through the venous outlet. An assumption is made that the AIF represents the exact arterial inflow to the capillary bed in the specific brain tissue of interest. Investigators recommend selecting the AIF as close as possible to the artery supplying the brain ROI to obtain accurate quantitative data [8, 9]. However, this study shows that selection of the AIF location, particularly addressing the issue of laterality (ischemic vs nonischemic side), does not result in a statistically significant difference in the quantitative perfusion values of the infarct core. These findings are consistent with previously published reports that have also determined no significant variation in the quantitative CT perfusion parameters of patients with acute cerebral ischemia when using different AIF locations [7, 12–14]. Bisdas et al. [7] also concluded that the volume estimation of the ischemic region was not significantly affected by the selection of the AIF location.
Our study also reveals the importance of selecting the AIF relative to the location of the embolus or thrombus. Based on CTA findings obtained at admission, our results show that selection of the AIF placed distal to the clot on the ischemic side results in significantly increased CBF and decreased MTT in the infarct core (p < 0.05) as well as a slight trend for increased CBV. These effects were present using both software programs but were less prominent with software A (delay-insensitive technique). Review of the CTA findings in the six patients with qualitatively different CT perfusion maps suggests an association of these altered perfusion results using AIF 2 with a complete occlusion of the MCA and with partial occlusion with a lack of robust collateral circulation. The FWHM was also analyzed as an indirect measure to estimate the degree of dispersion, which was found to be slightly increased in only two of these six patients. All of these findings support the explanation that the altered CT perfusion values are most likely due to the marked delay, the lack of contrast material distal to the clot with AIF 2 location. Furthermore, analysis of the attenuation measurements for the AIF locations showed a markedly diminished concentration of contrast material for AIF 2, representing approximately one third of the attenuation of AIF 1.
However, our study addresses the variability in the quantification of only the infarct core and not the ischemic penumbra. The correlation between CT perfusion measures of infarct core and DWI is well established in the literature. Qualitative and quantitative assessments of the infarct core vary less than those of ischemic penumbra, allowing more accurate identification in patients. The infarct core has been clearly defined as a region of irreversibly ischemic tissue, regardless of the degree or timing of reperfusion, and can be identified as a flow lesion below a defined threshold. The penumbra, however, varies in its appearance and distribution depending on the precise maps and thresholds used for defining it; hence, the penumbra is associated with variable final infarct size depending on the degree and duration of ischemia. This heterogeneity introduces greater variability in the study design. In our study, accurate evaluation of the infarct core was confirmed by DWI in each patient, whereas the ischemic penumbra could not be verified by another reference standard imaging examination, limiting identification of its location with certainty.
To comprehensively address the issue of delay and dispersion of contrast flow is complex because it may be present in patients with acute or chronic cerebrovascular disease as well as in healthy patients. It is plausible that an AIF selected on the affected hemisphere will be subject to more dispersion than that on the unaffected hemisphere because of collateral pathways [10, 16] and thereby may be a source of error in the quantitative perfusion measurements using the deconvolution method [6, 8, 17, 18]. Studies of MR perfusion have shown that the deconvolution software based on singular value decomposition (SVD) is susceptible to tracer delay effect, leading to underestimation of CBF and overestimation of MTT [6, 8, 18]. Likewise, CT perfusion with the deconvolution method using SVD is also susceptible to the delay in the arrival of contrast material to the brain tissue, leading to misclassification of MTT and CBF values [19, 20]. Other factors that may contribute to delay and dispersion effects include the use of a nondiffusible intravascular tracer, the presence of collateral pathways supplying the ischemic brain region, host factors (e.g., cardiac output or possible stenosis of the carotid arteries), and external factors (e.g., IV injection rate and caliber of the venous cannula) [14].
Sasaki et al. [21] studied postprocessing of CT perfusion data using both a delay-insensitive block-circulant SVD and a delay-sensitive standard SVD in patients with vascular stenosis or occlusion. CBF values obtained with the delay-insensitive block-circulant SVD algorithm had better correlation with SPECT than CBF values obtained with the delay-sensitive standard SVD algorithm. Furthermore, the CBF values were substantially different when using the MCA ipsilateral to the affected hemisphere as the AIF compared with using the contralateral MCA, and this difference was observed particularly when the tracer delay–sensitive standard SVD was used. Our results are in agreement with this study [21]. We found that a delay-insensitive technique (software A) results in less variability in the quantitative perfusion values for the different AIF locations, with the caveat that AIF 2 (distal to the clot on the ischemic side) revealed qualitative and quantitative differences.
Limitations of this study include the small sample size of acute stroke patients used for data analysis. The study was performed on a subset of patients obtained from a prospective cohort study at our institution. Only two software programs were used to represent the standard and delay-insensitive deconvolution techniques. The quantitative perfusion results may vary according to software programs supplied from different vendors.
In conclusion, careful attention to the selection of the AIF will assist in optimizing the accuracy of quantitative perfusion CT in acute stroke patients. Laterality of the AIF location is less important than avoiding placement distal to the vascular embolus or thrombus as detected on CTA. This pitfall is less severe with deconvolution-based software programs using a delay-insensitive technique. Awareness of these results may be important not only for the standardization of AIF placement but also for the creation of quantitatively accurate CT perfusion maps for the appropriate management and treatment of acute stroke patients.
Acknowledgments
Supported by NIH/NINDS (grant 1 P50 NS051343-01A2) as part of the Special Program of Translational Research in Acute Stroke (SPOTRIAS).
References
- 1.Karonen JO, Liu Y, Vanninen RL, et al. Combined perfusion- and diffusion-weighted MR imaging in acute ischemic stroke during the 1st week: a longitudinal study. Radiology. 2000;217:886–894. doi: 10.1148/radiology.217.3.r00dc02886. [DOI] [PubMed] [Google Scholar]
- 2.Rother J, Jonetz-Mentzel L, Fiala A, et al. Hemodynamic assessment of acute stroke using dynamic single-slice computed tomographic perfusion imaging. Arch Neurol. 2000;57:1161–1166. doi: 10.1001/archneur.57.8.1161. [DOI] [PubMed] [Google Scholar]
- 3.Nabavi DG, Cenic A, Henderson S, Gelb AW, Lee TY. Perfusion mapping using computed tomography allows accurate prediction of cerebral infarction in experimental brain ischemia. Stroke. 2001;32:175–183. doi: 10.1161/01.str.32.1.175. [DOI] [PubMed] [Google Scholar]
- 4.Eastwood JD, Lev MH, Azhari T, et al. CT perfusion scanning with deconvolution analysis: pilot study in patients with acute MCA stroke. Radiology. 2002;222:227–236. doi: 10.1148/radiol.2221010471. [DOI] [PubMed] [Google Scholar]
- 5.Kealey SM, Loving VA, Delong DM, Eastwood JD. User-defined vascular input function curves: influence on mean perfusion parameter values and signal- to-noise ratio. Radiology. 2004;231:587–593. doi: 10.1148/radiol.2312030489. [DOI] [PubMed] [Google Scholar]
- 6.Wu O, Østergaard L, Weisskoff RM, Benner T, Rosen BR, Sorensen AG. Tracer arrival timing insensitive technique for estimating flow in MR perfusion-weighted using singular value decomposition with a block-circulant deconvolution matrix. Magn Reson Med. 2003;50:164–174. doi: 10.1002/mrm.10522. [DOI] [PubMed] [Google Scholar]
- 7.Bisdas S, Konstantinou GN, Gurung J, et al. Effect of the arterial input function on the measured perfusion values and infarct volumetric in acute cerebral ischemia evaluated by perfusion computed tomography. Invest Radiol. 2007;42:147–156. doi: 10.1097/01.rli.0000252486.79800.a7. [DOI] [PubMed] [Google Scholar]
- 8.Calamante F, Gadian DG, Connelly A. Delay and dispersion effects in dynamic susceptibility contrast MRI: simulations using singular value decomposition. Magn Reson Med. 2000;44:466–473. doi: 10.1002/1522-2594(200009)44:3<466::aid-mrm18>3.0.co;2-m. [DOI] [PubMed] [Google Scholar]
- 9.Kamath A, Smith WS, Powers WJ, et al. Perfusion-CT compared to H2 15O/O15O PET in patients with chronic cervical carotid artery occlusion. Neuroradiology. 2008;50:745–751. doi: 10.1007/s00234-008-0403-9. [DOI] [PMC free article] [PubMed] [Google Scholar]
- 10.Østergaard L, Johannsen P, Høst-Poulsen P, et al. Cerebral blood flow measurements by magnetic resonance imaging bolus tracking: comparison with [(15)O] H2O positron emission tomography in humans. J Cereb Blood Flow Metab. 1998;18:935–940. doi: 10.1097/00004647-199809000-00002. [DOI] [PubMed] [Google Scholar]
- 11.Lee TY. Functional CT: physiologic models. Trends Biotechnol. 2002;20(suppl 8):S3–S10. [Google Scholar]
- 12.Sheikh K, Schipper MJ, Hoeffner EG. Feasibility of superficial temporal artery as the input artery for cerebral perfusion CT. AJR. 2009;192:1743. doi: 10.2214/AJR.07.3677. [web]W321–W329. [DOI] [PubMed] [Google Scholar]
- 13.Sanelli PC, Lev MH, Eastwood JD, et al. The effect of varying user-selected input parameters on quantitative values in CT perfusion maps. Acad Radiol. 2004;11:1085–1092. doi: 10.1016/j.acra.2004.07.002. [DOI] [PubMed] [Google Scholar]
- 14.Wintermark M, Lau BC, Chien J, Arora S. The anterior cerebral artery is an appropriate arterial input function for perfusion-CT processing in patients with acute stroke. Neuroradiology. 2008;50:227–236. doi: 10.1007/s00234-007-0336-8. [DOI] [PubMed] [Google Scholar]
- 15.Ladurner G, Zilkha E, Iliff D, du Boulay GH, Marshall J. Measurement of regional cerebral blood volume by computerized axial tomography. J Neurol Neurosurg Psychiatry. 1976;39:152–158. doi: 10.1136/jnnp.39.2.152. [DOI] [PMC free article] [PubMed] [Google Scholar]
- 16.Lythgoe DJ, Østergaard L, Williams SCR, et al. Quantitative perfusion imaging in carotid artery stenosis using dynamic susceptibility contrast enhanced magnetic resonance imaging. Magn Reson Imaging. 2000;18:1–11. doi: 10.1016/s0730-725x(99)00112-5. [DOI] [PubMed] [Google Scholar]
- 17.Shetty SK, Lev MH. CT perfusion in acute stroke. Neuroimaging Clin N Am. 2005;15:481–501. doi: 10.1016/j.nic.2005.08.004. [DOI] [PubMed] [Google Scholar]
- 18.Ibaraki M, Shimosegawa E, Toyoshima H, et al. Effect of regional tracer delay on CBF in healthy subjects measured with dynamic susceptibility contrast-enhanced MRI: comparison with 15OPET. Magn Reson Med Sci. 2005;4:27–34. doi: 10.2463/mrms.4.27. [DOI] [PubMed] [Google Scholar]
- 19.Smith MR, Lu H, Trochet S, et al. Removing the effect of SVD algorithmic artifacts present in quantitative MR perfusion studies. Magn Reson Med. 2004;51:631–634. doi: 10.1002/mrm.20006. [DOI] [PubMed] [Google Scholar]
- 20.van der Schaaf I, Vonken EJ, Waaijer A, Velthuis B, Quist M, van Osch T. Influence of partial volume on venous output and arterial input function. AJNR. 2006;27:46–50. [PMC free article] [PubMed] [Google Scholar]
- 21.Sasaki M, Kudo K, Ogasawara K, Fujiwara S. Tracer delay-insensitive algorithm can improve reliability of CT perfusion imaging for cerebrovascular steno-occlusive disease: comparison with quantitative single-photon emission CT. AJNR. 2009;30:188–193. doi: 10.3174/ajnr.A1274. [DOI] [PMC free article] [PubMed] [Google Scholar]