Abstract
The human brain undergoes rapid organization and structuring early in life. Longitudinal imaging enables the study of these changes over a developmental period within individuals through estimation of population growth trajectory and its variability. In this paper, we focus on maturation of white and gray matter depicted in structural and diffusion MRI of healthy subjects with repeated scans. We provide a framework for joint analysis of both structural MRI and DTI (Diffusion Tensor Imaging) using multivariate nonlinear mixed effect modeling of temporal changes. Our framework constructs normative growth models for all the modalities, taking into account the correlation among the modalities and individuals, along with estimation of the variability of the population trends. We apply our method to study early brain development, and to our knowledge this is the first multimodel longitudinal modeling of diffusion and signal intensity changes for this growth stage. Results show the potential of our framework to study growth trajectories, as well as neurodevelopmental disorders through comparison against the constructed normative models of multimodal 4D MRI.
1. INTRODUCTION
The human brain undergoes significant changes during infancy and early development. Advances in medical imaging have allowed us to track these changes in vivo longitudinally which more accurately captures development as compared to cross-sectional analysis. Growth modeling of longitudinal data yields a more accurate average trajectory as the population model is built from individual temporal trajectories. This results in significantly improved model of growth and growth variability, especially when inter-subject variability is greater than the temporal change [1].
Previous neuroimaging studies have substantially increased our understanding of early brain development. Prior studies of DTI and MRI have shown changes in early brain development, including changes of diffusion parameters over time [2, 3] and contrast changes as is depicted in T1W and T2W [4]. There are relatively few studies that have looked at both DTI and MRI [5]. However, most of these studies have been cross-sectional and only consider one modality. In this paper, we focus on multivariate longitudinal modeling where growth model is jointly estimated based on all the modalities.
We present a new method to generate models of temporal changes in multimodal MRI taken at non-uniformly sampled discrete time points. Our proposed method estimates non-linear models of growth trajectories for individual subjects, the population, and confidence intervals around the average trajectory. This is accomplished using non-linear mixed effects modeling (NLME) where multimodal changes are described using Gompertz functions. The Gompertz growth function provides a representation of asymptotic growth using intuitive parameters such as delay, rate of change, and expected asymptotic value. We have demonstrated the utility of such modeling in our recent paper that presents a method for unimodal analysis [6], where we compare growth in white matter regions. In this paper, we demonstrate and apply our new method to longitudinal multimodal MRI data containing both structural (T1W and T2W) and diffusion imaging modalities. We construct and analyze normative models in anatomical regions of interest located in white matter and gray matter. Results indicate that quantitative modeling of early brain development through MRI generates normative models with confidence intervals that have potential for detecting abnormal growth due to disease.
2. METHOD
2.1. Non-linear Mixed Effects Modeling
We use a non-linear mixed effects (NLME) model to analyze the longitudinal T1W, T2W and DTI data. The mixed effect model is robust to outliers as it accounts for the variability within individuals. In the mixed effects model, the observed data is assumed to be a combination of both fixed effects, parameters associated with the entire population (or at least within a sub-population), and random effects that are specific to an individual drawn at random. In non-linear mixed effects models, some or all of the fixed and random effects parameters present nonlinear responses. This makes nonlinear mixed effects model a natural and common choice for longitudinal data. We use the NLME model proposed by Lindstrom and Bates [7], where the jth observation of MRI/DTI on the ith individual is modeled as:
| (1) |
where M is the number of individuals, ni is the number of observations on the ith individual, f is a nonlinear function of the covariate vector tij and parameter vector ϕi, and eij ~ 𝒩(0, σ2) is an independent identically distributed error term. The parameter vector can vary among individuals which is incorporated into the model by writing ϕi as
| (2) |
β is a p-vector of fixed effects, and bi is a q-vector of random effects associated with individual i with variance-covariance Ψ. Ai and Bi are design matrices.
2.2. Multivariate Analysis of Longitudinal MRI
We perform quantitative analysis on a population of longitudinal multimodal MRI data within anatomical regions. We model the multimodal image features as non-linear mixed effects, which combines regional population trends and individual subject trends. For this section, we assume that all MR images have been registered to a standard reference space. The primary goal for our analysis of growth trajectories is to determine the multivariate growth patterns and study the variation of different imaging modalities in space and time, using intuitive parametrization of growth trajectories. As the human brain undergoes rapid changes in the first year of development and slows considerably in later years, we model early development patterns in longitudinal multimodal MRI using the Gompertz function. Specifically, we model temporal growth for an individual i, time points tij, and image channel/modality c ∈ {c1 … ck} by nonlinear mixed effect model of the Gompertz function
| (3) |
where the mixed effects are . The fixed effects for modality c, , represent mean values of parameter in the population. This parametrization intuitively decomposes the mean of temporal changes of a population as saturation (β1), delay (β2), and speed (−log β3). The random effects for each subject i and modality c, , explains individual variation from the mean. We set one of the random effects to zero to reduce the number of random effects in the model. Most of the variation of individuals can be captured by b1 and b2 and including extra random effects in the model may cause the matrix Ψ to be rank-deficient. By imposing joint multivariate distribution on random effects of all the modalities, , we capture both inter individual variability within a modality as well as association between the growth patterns seen in different modalities.
2.3. Constructing Normative Models with Confidence Measures
The mixed effect model parameters provide descriptions of population trends as well as individual trends, along with the variability within the population. We use the NLME framework to construct normative models that not only describe the expected trends, but also the expected deviations from the trends. We construct confidence intervals that bound the population trends through Monte Carlo simulations based on the mean and covariance matrix of the fixed effects, where we generate confidence bands at the 95% level. We also generate 95% predicted intervals based on the mean and covariance matrix of the fixed effects and random effects.
3. RESULTS AND CONCLUSIONS
We perform an analysis on a set of repeated scans of 26 healthy subjects acquired at approximately 2 weeks, 1 year and 2 years of age. Four of the subjects had suboptimal DTI scans at 1 year that were removed, but their scans for other time points and modalities were included. The images include T1W, T2W and DTI. We apply the unbiased atlas building framework [8] to the set of T2W images at 1 year to obtain spatial mappings between each subject through the estimated atlas. Intra-subject registration was performed by IRTK software.1 All time points of each subject are registered to this atlas via linear and nonlinear transformations, first by mapping these images to the year 1 scan and then cascading the two transformations for a mapping to the atlas. Tensor maps are calculated for each DTI scan, and are registered to the atlas using transformations obtained by registering the DTI baseline (B0) images to T2W images. T1W images were normalized using intensity value of fatty tissue between the skull and skin. For T2W, the csf region of ventricles was used for normalization. Fractional anisotropy features from the registered tensors were used for the joint analysis between DTI and structural MRI.
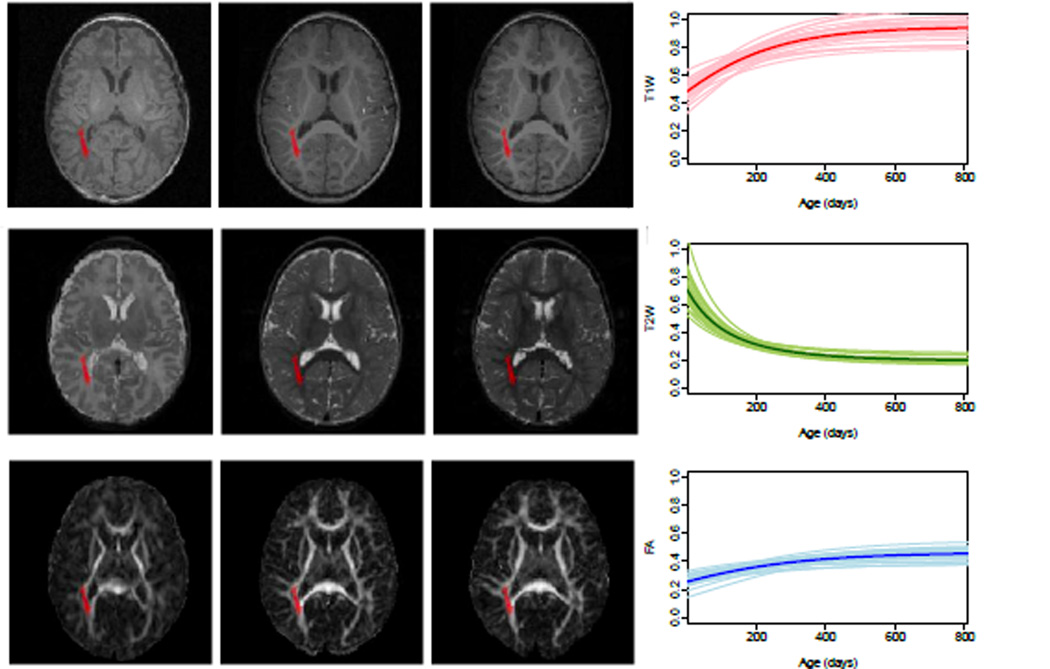
We analyze growth trajectories in white and gray matter anatomical regions, using atlases developed and disseminated by Mori et al. [9] and Harvard Center for Morphometric Analysis2. Figure 1 shows the right posterior thalamic radiation (PTR) overlaid on longitudinal T1W, T2W and FA image of one subject, along with the population and individual trajectories estimated using our multivariate nonlinear mixed effect model. PTR includes optic radiation and it is one of the white matter tracts that matures early [10]. There is a rapid change in T1W and T2W in the first year followed by slower maturation during second year.
Fig. 1.
Co-registered multi-modal MRI data are shown on the left. Left to Right: Images taken at two weeks, 1 year and 2 years. Top to Bottom: T1W, T2W and FA. Posterior thalamic radiation is shown as red label on the images. Population and individual growth trajectories for this region is shown to the right. Thick curves are the average growth trajectories for normalized T1W, T2W and FA.
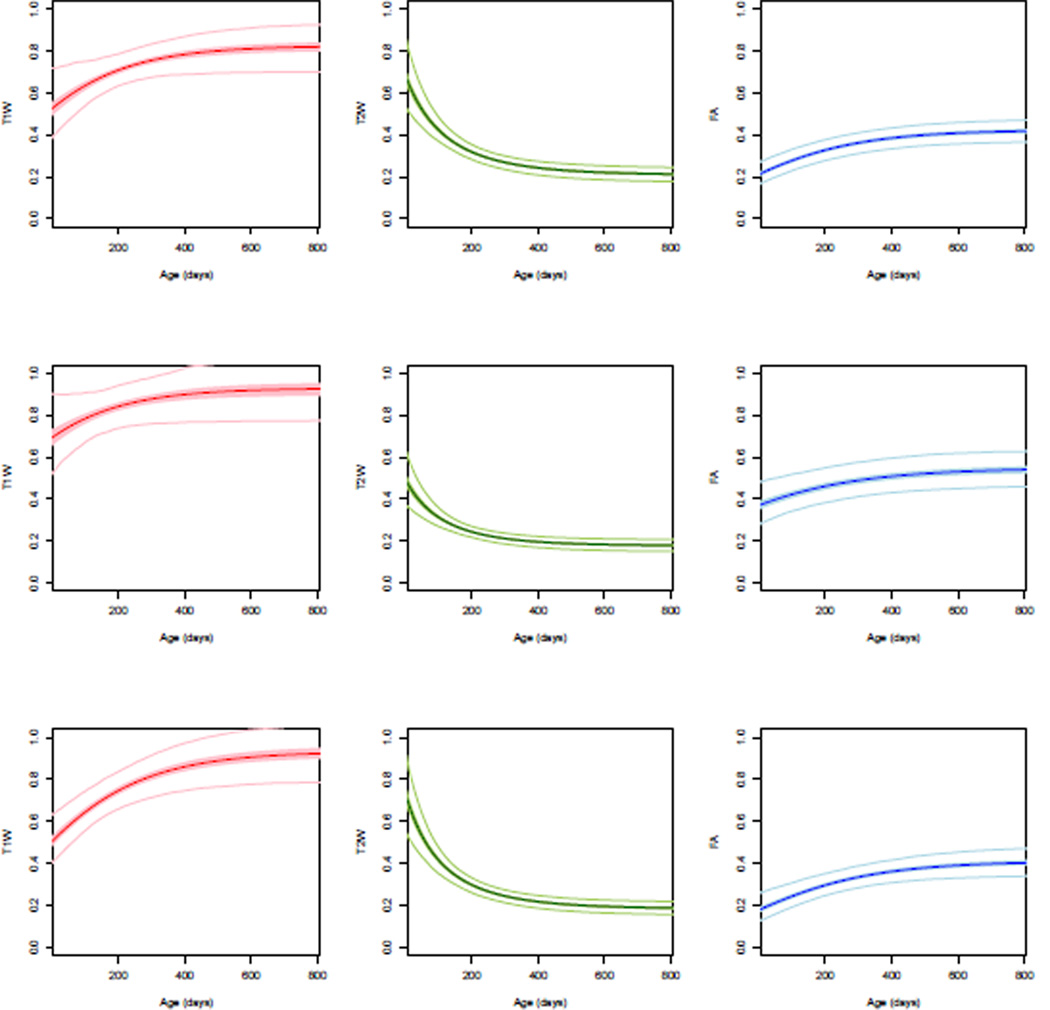
Figure 2 show the population trends and confidence intervals for white matter regions of interest. This includes the body of corpus callosum (BCC) that is known to have a very limited myelination at birth, whereas Posterior limb of internal capsule (PLIC) is known to be one of the regions that shows early myelination. This pattern is evident as PLIC has a higher FA and T1W values, with lower T2W values compared to BCC and superior longitudinal fasciculus (SLF). However, BCC and SLF show a quick maturation during first year, specially in T2W.
Fig. 2.
Population growth trajectories (bold) and confidence intervals (light). From top to bottom: Body of Corpus Callosum (BCC), Posterior Limb of Internal Capsule (PLIC), and Superior Longitudinal Fasciculus (SLF). Bold curves are the average growth trajectories for normalized T1W (red), T2W (green) and FA (blue), while the 95% confidence interval of the curves are shown as shaded regions. Light color curves show the 95% predicted intervals for each region.
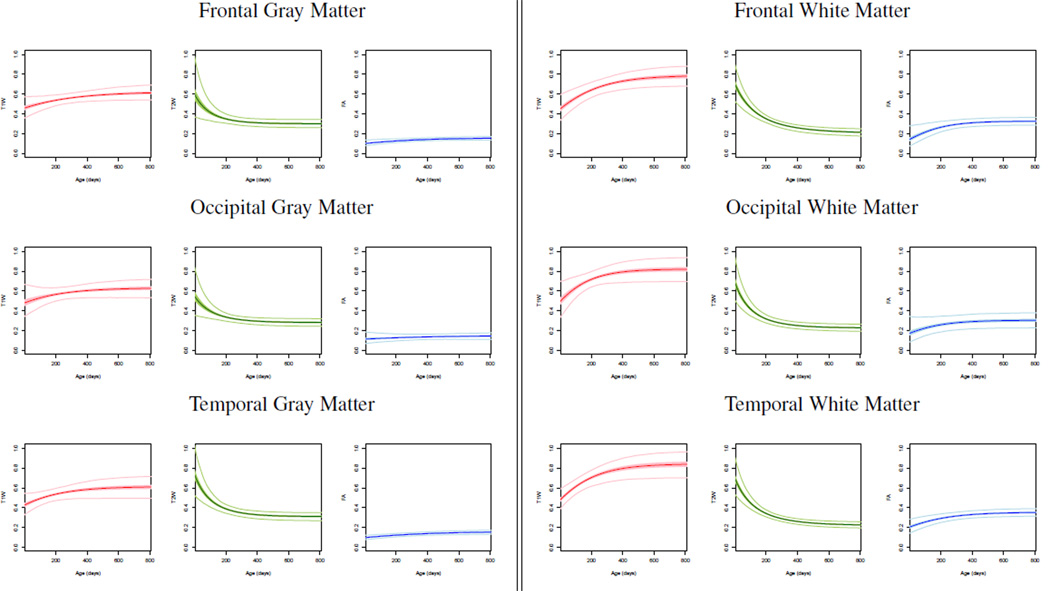
We also analyze growth trajectories in gray matter, even though DTI analysis has been typically performed only in white matter. We observe small changes in FA values as gray matter matures, however the changes of T1W and T2W are greater as expected. Figure 3 shows the changes of white and gray matter in different lobes. T1W and FA increase with age and T2W intensities decrease with age. We noted a higher degree of maturation in average T1W and T2W curves for occipital lobe as compared to frontal and temporal lobes. Higher FA values are observed in white matter compared to gray matter due to the fiber structure in white matter. We also observe high variability of FA and T2W at birth for white matter, while T1W has high variability throughout early brain development.
Fig. 3.
Population trends and confidence intervals for gray matter and white matter in the frontal, occipital, and temporal lobes. Red denotes normalized T1W, green is T2W and blue is FA. Bold color curves are the estimated population growth trajectories, while the 95% confidence interval of the curves are shown as shaded regions. Light color curves show the 95% predicted intervals for each region.
Conclusions
We have presented a new method for generating normative models of growth from multimodal longitudinal MR images. The method utilizes non-linear mixed effects modeling using Gompertz parametrization of longitudinal changes. We applied and evaluated our method to clinical data of early brain development to obtain normative growth models in anatomical regions of interest in white and gray matter. These models describe the expected trends of the population, as well as the expected deviations from these trends. Results suggest that our approach has potential for detecting abnormalities in growth trajectories of a patient by direct comparison to the constructed normative models. In the future, we will explore the application of our approach to subjects with developmental delay or degenerative disorders such as Krabbe disease.
Footnotes
Supported by grants: MH070890 (JHG, GG), Conte Center MH064065 (JHG,GG), and National Alliance for Medical Image Computing (NA-MIC) U54 EB005149 (GG) and the Utah Science Technology and Research (US-TAR) initiative at the University of Utah.
REFERENCES
- 1.Diggle PJ, Heagerty P, Liang K, Zeger S. Analysis of Longitudinal Data. second edition edition. New York: Oxford University Press; 2002. [Google Scholar]
- 2.Geng X, Gouttard S, Sharma A, Gu H, Styner M, Lin W, Gerig G, Gilmore JH. Quantitative tract-based white matter development from birth to age 2years. Neuroimage. 2012 Jul;vol. 61:542–557. doi: 10.1016/j.neuroimage.2012.03.057. [DOI] [PMC free article] [PubMed] [Google Scholar]
- 3.Hermoye L, Saint-Martin C, Cosnard G, Lee SK, Kim J, Nassogne MC, Menten R, Clapuyt P, Donohue PK, Hua K, Wakana S, Jiang H, van Zijl PC, Mori S. Pediatric diffusion tensor imaging: normal database and observation of the white matter maturation in early childhood. Neuroimage. 2006 Jan;vol. 29(no. 2):493–504. doi: 10.1016/j.neuroimage.2005.08.017. [DOI] [PubMed] [Google Scholar]
- 4.Serag A, Aljabar P, Counsell S, Boardman J, Hajnal JV, Rueckert D. Tracking developmental changes in subcortical structures of the preterm brain using multi-modal MRI. IEEE International Symposium on Biomedical Imaging. 2011:349–352. [Google Scholar]
- 5.Gilmore JH, Lin W, Corouge I, Vetsa YS, Smith JK, Kang C, Gu H, Hamer RM, Lieberman JA, Gerig G. Early postnatal development of corpus callosum and corticospinal white matter assessed with quantitative tractography. AJNR Am J Neuroradiol. 2007 Oct;vol. 28(no. 9):1789–1795. doi: 10.3174/ajnr.A0751. [DOI] [PMC free article] [PubMed] [Google Scholar]
- 6.Sadeghi N, Prastawa M, Fletcher PT, Gilmore J, Lin W, Gerig G. Statistical growth modeling of longitudinal dt-mri for regional characterization of early brain development. Proceedings of IEEE ISBI. 2012;2012:1507–1510. doi: 10.1109/isbi.2012.6235858. [DOI] [PMC free article] [PubMed] [Google Scholar]
- 7.Lindstrom ML, Bates DM. Nonlinear mixed effects models for repeated measures data. Biometrics. 1990 Sep;vol. 46:673–687. [PubMed] [Google Scholar]
- 8.Joshi S, Davis B, Jomier M, Gerig G. Unbiased diffeomorphic atlas construction for computational anatomy. Neuroimage. 2004;vol. 23:S151–S160. doi: 10.1016/j.neuroimage.2004.07.068. [DOI] [PubMed] [Google Scholar]
- 9.Mori S, Oishi K, Jiang H, Jiang L, Li X, Akhter K, Hua K, Faria AV, Mahmood A, Woods R, Toga AW, Pike GB, Neto PR, Evans A, Zhang J, Huang H, Miller MI, van Zijl P, Mazziotta J. Stereotaxic white matter atlas based on diffusion tensor imaging in an ICBM template. Neuroimage. 2008 Apr;vol. 40:570–582. doi: 10.1016/j.neuroimage.2007.12.035. [DOI] [PMC free article] [PubMed] [Google Scholar]
- 10.Brody BA, Kinney HC, Kloman AS, Floyd HG. Sequence of Central Nervous System Myelination in Human Infancy I An Autopsy Study of Myelination. J Neuropathol Exp Neurol. 1987 May;vol. 46(no. 3):283–301. doi: 10.1097/00005072-198705000-00005. [DOI] [PubMed] [Google Scholar]


