Abstract
Electronic displays and computer systems offer numerous advantages for clinical vision testing. Laboratory and clinical measurements of various functions and in particular of (letter) contrast sensitivity require accurately calibrated display contrast. In the laboratory this is achieved using expensive light meters. We developed and evaluated a novel method that uses only psychophysical responses of a person with normal vision to calibrate the luminance contrast of displays for experimental and clinical applications. Our method combines psychophysical techniques (1) for detection (and thus elimination or reduction) of display saturating nonlinearities; (2) for luminance (gamma function) estimation and linearization without use of a photometer; and (3) to measure without a photometer the luminance ratios of the display’s three color channels that are used in a bit-stealing procedure to expand the luminance resolution of the display. Using a photometer we verified that the calibration achieved with this procedure is accurate for both LCD and CRT displays enabling testing of letter contrast sensitivity to 0.5%. Our visual calibration procedure enables clinical, internet and home implementation and calibration verification of electronic contrast testing.
Keywords: LCD, CRT, Luminance, Linearization, Display Calibration, Contrast
1 Introduction
Visual psychophysical laboratory studies are usually conducted using electronic displays. In the clinic, electronic displays have been replacing the paper wall chart and optical projector tests of visual acuity and contrast sensitivity (CS) measurements starting with the 1980s introduction of the B-VAT system (Mentor O&O, Norwood MA) (Williams, Decker, Kurtzman & Kuether, 1980). Electronic clinical test systems are in widespread use today (e.g. TestChart 2000 (Thomson Software Solutions, UK), Metrovision (Metrovision, France), SmartSystem20/20 (M&S Technologies, Skokie, IL) and CST1800 (Stereo Optical Co, Chicago, IL)). Following the development of the basic electronic visual acuity chart many other clinical tests were incorporated into these systems including letter and grating CS in the B-VAT II -SG (Corwin, Carlson & Berger, 1989) followed by a battery of binocular vision tests (Waltuck, McKnight & Peli, 1991) that included distance stereoacuity testing (Rutstein & Corliss, 2000; Wong, Woods & Peli, 2002). Many personal-computer based clinical vision test systems are now marketed either as integrated systems or as software packages to be used with existing computers and displays. In addition to the use in clinics, there has been a growing trend for remote visual testing using home computers (Dagnelie, Yang, Bahrami, Stone & Melia, 2003; Dagnelie, Kramer, Seifert, Yang & Havey, 2008), smart phones, tablets (Dorr, Lesmes, Zhong-Lin & Bex, 2013), and over the Internet (Lavin, Silverstein & Zhang, 1999; Dagnelie, Zorge & McDonald, 2000). In-home testing has potential benefits in reducing costs, increasing convenience, recruitment of subjects for studies, monitoring of patients, and the ability to collect data frequently. However, home testing presents more challenges to standardization, display characterization and calibration.
The growing popularity of clinical letter CS testing using paper charts (e.g., Pelli-Robson chart (Pelli, Robson & Wilkins, 1988), Reagan chart (Regan, 1988), and the Mars charts (Arditi, 2005; Dougherty, Flom & Bullimore, 2005)) lead to the incorporation of letter CS testing in most clinic electronic vision test systems. While testing of visual acuity, stereo acuity and other binocular functions is not very sensitive to chart or display luminance calibration, the testing of (letter) CS requires accurate luminance calibration of the display and, in most cases, higher luminance resolution than available with typical 8-bit display and graphic cards. The enhanced luminance resolution is required to enable presentation of contrast levels near and below the human threshold for detection. A luminance calibration system with enhanced luminance resolution was provided with the early B-VAT II-SG that measured both letter CS and detection thresholds of sinusoidal gratings using only 6 bits of native luminance resolution. That system required a manual adjustment of display “brightness” to specific luminance values as measured with a photometer, as well as a flicker minimization (visual psychophysical) method to match the mean luminance of gratings in the two hardware-modified domains of the expanded dynamic range. The difficulty associated with such calibration is further exemplified by the contemporary TestChart 2000 that recommends a proprietary light meter for calibration that can be either bought or rented from the manufacturer. A number of commercially available lab systems, such as the Cambridge Research Systems ViSaGe (Cambridge Research Systems Ltd., UK), come equipped with a photometer to facilitate a system calibration. Thayaparan et al. (2007) compared the TestChart 2000 to the Pelli-Robson and Mars charts and found that the coefficient of repeatability was 0.18 for the Pelli-Robson chart, 0.12 for the Mars chart, but only 0.24 log units for TestChart 2000. In addition, they found that the TestChart 2000 did not agree well with the Pelli-Robson chart which they attributed to the performance of LCD displays at low contrast levels. They did not make any explicit statements as to which of these was the most accurate.
Most psychophysical studies involving electronic displays and manipulation of electronic images require accurate calibration of the display so that the luminance characteristics of the displayed images are known. Usually this is done by linearizing the relationship between the digital pixel representation and the luminance of the display (Brainard, 1989; Brainard, Pelli & Robson, 2002). Historically, such studies were conducted using CRT displays and accurate and expanded luminance resolution was possible by combining the three color outputs of the graphic cards through a resistors net (video attenuator) to expand the luminance resolution of monochrome CRTs (Watson, Nielsen, Poirson, Fitzhugh, Bilson, Nguyen & Ahumada, 1986; Pelli & Zhang, 1991; Li, Lu, Xu, Jin & Zhou, 2003; Falkenberg, Rubin & Bex, 2007; Niebergall, Huang & Martinez-Trujillo, 2010; Dakin, Greenwood, Carlson & Bex, 2011). Calibration and linearization of such systems requires photometric measurement of the display voltage to luminance relations (the Gamma function) followed by photometric verification of the successful calibration (Swift, Panish & Hippensteel, 1997).
A linear luminance to digital image relationship is also required for many studies that can be safely conducted within the limited 8-bit display range (Webster, Georgeson & Webster, 2002; Vera-Díaz, Woods & Peli, 2010; Haun, Woods & Peli, 2012). The same is true for most studies of image processing and image quality. If calibrations are not performed the impact of the display’s non-linear voltage (pixel-level) to luminance gamma function may drastically affect the content of the displayed images (Peli, 1992a).
The quantization of luminance levels in electronic displays is particularly problematic at low luminance levels, where a change from one pixel value to the next pixel value produces a change in luminance that is a large fraction of the prior luminance. Thus, producing fine gradations of low contrasts on dark backgrounds is difficult or impossible (this limitation affects printed charts similarly). Therefore, paper charts and computer-based contrast sensitivity tests use grey letters on bright backgrounds. Note that the need to linearize the display may result in reduction of the dynamic range, as most linearization methods result in fewer available gray levels thus reducing the available dynamic range and reducing the luminance resolution below the original 8-bit depth. The resulting limited luminance resolution (about 6 bits) is insufficient to challenge human contrast sensitivity even at the bright end of the luminance range. The contrast generated with pixel values of 254 and 255 as the low and high luminance is easily detected by a normally sighted observer, as the accelerating Gamma function produces a ratio between these luminances that is higher than the pixel-value ratio suggests. The problem is even worse when we attempt to generate sinusoidal or Gabor patches since one has to operate near the middle of the display luminance range where every grey level step represents a higher fraction of the mean luminance or a larger change in contrast and where it may be necessary to generate a sinusoidal variation near this luminance over a spatial extent of at least 6 pixels (Pelli & Zhang, 1991; Woods, Nugent & Peli, 2002).
CRT displays are rapidly disappearing from the consumer markets and are being replaced by LCD monitors. LCDs have the advantages of higher luminance, a larger color gamut (Sharma, 2002), and larger screen sizes. Offsetting these advantages are the disadvantages of more complex luminance response functions that may result in larger calibration errors (Sharma, 2002), the inability to use voltage-based luminance resolution expanders and strong sensitivity to viewing angle. If electronic displays are to be used clinically it is now necessary to be able to calibrate LCD screens.
We present a psychophysical display calibration procedure that enables (1) detection and elimination of display saturating non-linearity; (2) luminance calibration (linearization); and (3) measurements of luminance ratios of the three color channels (used in the color bit-stealing technique for luminance resolution expansion (Tyler, 1997a)), all without use of a photometer. This calibration approach can facilitate letter contrast sensitivity and other testing in the clinic, over the internet and at home.
2 Display saturating non-linearity detection and elimination
Electronic displays frequently have a saturating non-linearity at the bright end of the luminance range or a cut off at the dark end. In a display with a saturating non-linearity, the luminance curve levels off prior to the digital input reaching the minimal or maximal RGB values. This saturating non-linearity reduces the number of unique grayscale shades displayable and further complicates the calibration process. This is particularly true in calibration procedures that fit a gamma function. The region of saturating non-linearity (high luminance) occurs where we most often test the limits of the contrast sensitivity of the visual system. A saturating non-linearity may occur in individual color channels (Figure 1A). Though the calibration method in Colombo and Derrington (2001) accounted for saturating non-linearity, it did not include a procedure to detect whether saturating non-linearity occurred or a method to reduce or eliminate it. It is preferable to ensure that the display is not saturated before initiating a calibration process, as the saturation also limits the available dynamic range.
Figure 1.
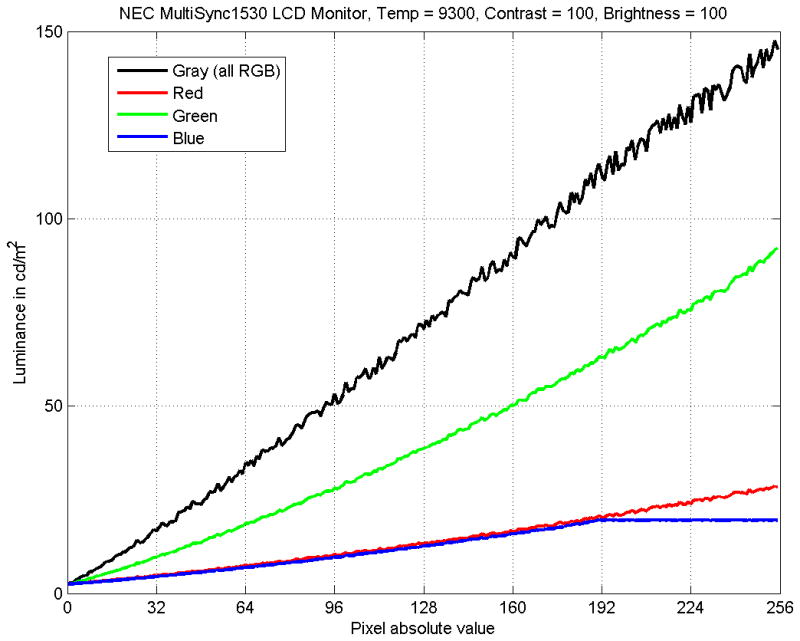
(A). Luminance output of a LCD monitor where only one channel (blue) was saturated. The grayscale luminance (black) appears to be most “noisy” in the region of saturated-blue, but did not saturate itself. The data consists of one measurement at each pixel value for each color. The noise in the gray signal is photometer measurement noise and is the reason that we programmed the photometer-based procedure to take 10 samples at each RGB level. This figure is meant to illustrate saturation non-linearity and these data were not used to estimate gamma.
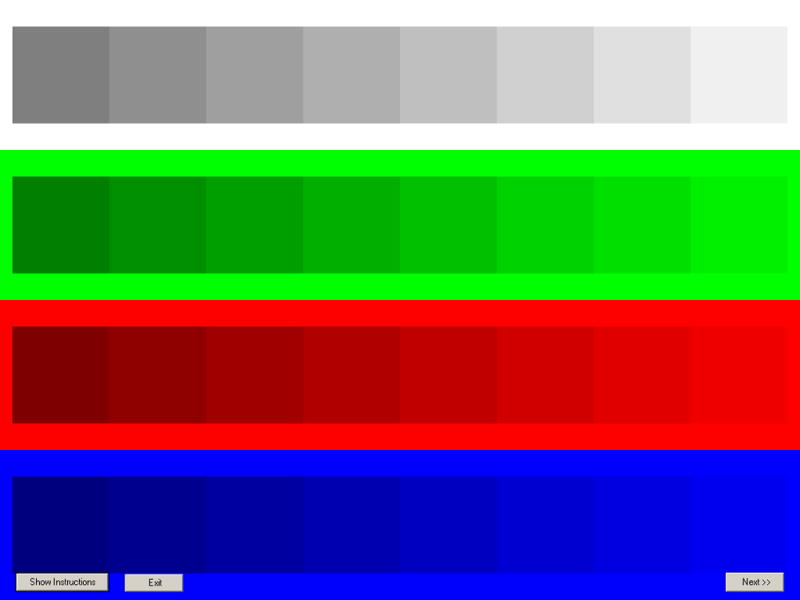
(B) Pattern for detecting and removing saturating non-linearity at high pixel values. Square patches of decreasing contrast against the bright background to detect saturation in grayscale and individual color channels. To remove saturating non-linearity, an observer adjusted the manual controls of the display device until all eight patches in each zone were visible, and the rightmost patch was just visible against the background. A similar stimulus was used for cut-off testing at low pixel values.
We used the pattern shown in Figure 1B to visually detect saturating non-linearity at maximum luminance. The background consisted of four rectangular regions (gray and individual primary colors), each near its maximum level. Each bar had 8 square patches, arranged in decreasing order of luminance1. If all 8 patches in each bar were visible, there was no saturating non-linearity and the procedure continued to the next step. If any of the brighter patches were invisible, the observer adjusts the physical or software settings on the display, including brightness, contrast, and color profile until the patches with lowest-contrast/brightest-luminance (right most) became just visible. This procedure simultaneously ensured that there was no saturating non-linearity in any of the color channels.
The same procedure was repeated for low luminances, to control for cut-off, using a similar stimulus prepared for that range. At that end the dimmest square patches will be indiscriminable if there is cut-off. At the end of the process all test patches have to be visible simultaneously at both the high and low end luminances of the display. The display settings that achieve that are then locked (if such locking is provided by the display) and recorded for future experiments. The cutoff at the low end is often only visible in gamma measurement curves if the plotted on a log-luminance scale (unlike Fig1).
3 Luminance linearization
3.1 Contrast in the relative luminance domain
For onscreen presentation of an achromatic stimulus such as a letter, where the background luminance Lbg is higher than the letter (foreground) luminance Lfg, the contrast may be calculated by the Weber contrast:
| (1) |
Thus, the contrast is calculated from the ratio of the foreground to background. To reproduce any contrast on a given display, it is possible to characterize that display from luminances that are known relatively (i.e., proportionally) to one another. As also noted by Mulligan (2009), our visual calibration is possible since knowledge of absolute luminance (e.g. cd/m2) is not required to reproduce a given contrast level. This works very well for most situations, but as described in section 3.5, it does not work as well for low luminance backgrounds.
3.2 Visual estimation of display Gamma function
A Gamma (γ) power model is often used to characterize the relationship between the RGB input levels and the luminance of a CRT display (Watson et al., 1986; Pelli & Zhang, 1991). Typically the light output of the display is measured with a photometer at different input levels, and then the data is fit to the model to obtain the Gamma function parameter(s). The function is then inverted to provide the calibration needed to linearize the display luminance.
Besides photometer-based approaches, visual methods to estimate a gamma curve have been proposed that generally have asked the observer to equalize two luminance patches (Peli, 1992a; Colombo & Derrington, 2001; Kay & Brandenberg, 2007) or by nulling apparent motion (Mulligan, 2009). Colombo and Derrington (2001) tested both side-by-side and flicker minimization settings, but found the side-by-side configuration to be easier and quicker for subjects to complete. The Kay and Brandenberg (2007) solution was implemented in a software product (SuperCal, http://www.bergdesign.com) for Macintosh computers. Another company, Applied Vision Research and Consulting (Yang, 2013), developed an online calibrator, DisplayCal, which provides a rough estimate of the gamma value using a visual matching method.
On a CRT display, the native relationship between emitted luminance and input digital value (voltage) is monotonic but nonlinear. This nonlinearity may be approximated by a power function of exponent γ. We model the output relative luminance, R(y) as follows:
| (2) |
where y is the 8-bit gray pixel value of the bitmap on the display, ymax is the maximum grey value used, γ is the display-dependent exponent, and Rmin and Rmax are the minimum and maximum luminance values (following saturation correction). In a relative luminance space, where Rmin =0 and Rmax=1, this becomes
| (3) |
This model can easily be adapted for estimation for both physical and relative luminance. Although in this paper we do not compare different gamma models, a recent review of other gamma models can be found in Besuijen (2007).
The model in equation (3) is characterized by γ that can be estimated as follows (Peli, 1992a). We collected n sample pairs of (Ri, yi),i = 1…n by a series of pair-wise luminance matching tasks, when the observer was asked to match the gray level of a known relative luminance. The stimulus comprised two horizontally abutting squares (Figure 2). The square patches were presented on a white background to maintain a display environment similar to a letter CS test, our test environment of interest. One 128-pixel square reference patch (3.4cm on one display) was constructed from alternating horizontal lines, of two known (preset) relative luminance values. The observer was sufficiently far away from the screen that the alternating lines pattern was not visible and the reference patch therefore appeared to have blended into a uniform luminance. We did not use a checkerboard pattern because horizontal lines reduce inter-pixel independence on a raster-scanning CRT (Colombo & Derrington, 2001). In addition, using single lines allows the calibration to be conducted at a shorter distance. The other square, the calibration patch, was set uniformly to a single gray value, and the observer adjusted its luminance to visually match to the reference patch. When a match is achieved the border between the two patches may no longer be visible and the two squares may appear to merge. At that point the calibration patch luminance is exactly half way between the luminances of the two levels represented by the alternating lines of the reference patch. The procedure for recursively generating the luminance matching patches is given in Step 2 of the online supplementary materials.
Figure 2.
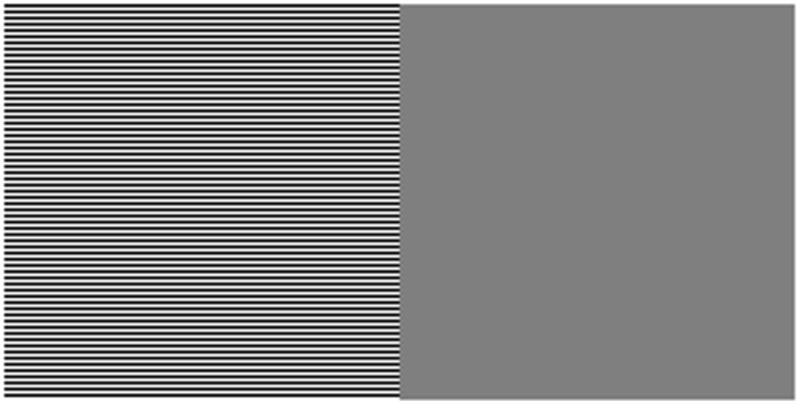
Abutting square patches for the gray level matching task. The reference patch (left) has alternating lines of two preset luminance values The calibration patch (right, in this example) was solidly filled with a single gray level and its brightness was adjusted by the observer, until the perceived brightness is as close as possible to the reference patch. Note that printed or displayed version of this figure may be distorted due to sub-sampling of the alternating lines of the reference patch.
Gamma was estimated by minimizing the sum-of-squared-errors (SSE) in equation (4) using an optimization method, such as Gauss-Newton (Press, Teukolsky, Vetterling & Flannery, 1992).
| (4) |
where (yi, Ri) are pairs of matching pixel gray level and relative luminance levels obtained through the visual task.
3.3 Results of luminance estimation
To verify the results of our psychophysical method, we performed photometer-based (Minolta LS-100, Tokyo, Japan) calibration of a ViewSonic G810 CRT. Pairs of (yi, Li) were collected at 18 gray levels on a white background, where for each gray level 0<=y<= ymax, Li was the corresponding luminance (cd/m2). Luminance levels were measured at the center of the screen using a square patch of the same size used in the psychophysical measurement.
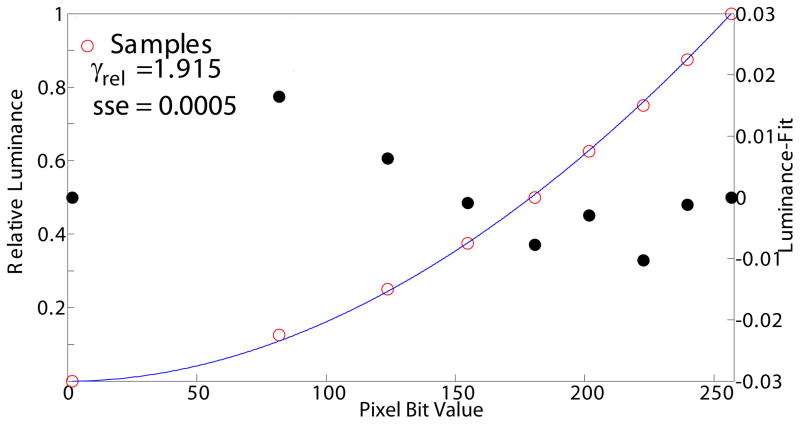
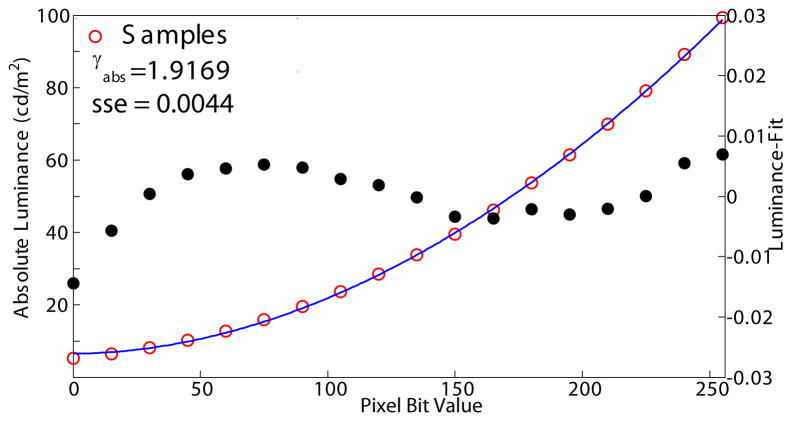
Our psychophysical method used 7 matches. The photometer samples were taken in 15-gray-level intervals between 0 and ymax (18 samples). As seen in Fig. 3, both methods produced very similar gamma curves, the difference between the γ values was about 0.1%. The main difference between the curves is a non-zero minimum luminance on the photometric data. See section 3.4 for a discussion of the effects of non-zero minimum luminance on contrast.
Figure 3.
Comparison between CRT gamma values estimated using the psychophysical method (A) and from a photometer-based measurement (B) (left axis scale). Residuals are shown as filled black circles and relate to the right axis scale. Note the non-zero luminance measured with photometer at grey value=0.
Three experienced observers and four initially naïve observers repeated the gamma estimation on an LCD monitor 10 times each (except one observer who did 6) over a period spanning 3 months. We analyzed the relative gamma, the psychophysically-estimated gamma divided by the gamma obtained with a photometer. There were no differences between subjects in relative gamma (ANOVA, F6,57=0.16, p=0.99) or variability (Levene, F6,58=0.60, p=0.73).
3.4 - Effects of non-zero minimum luminance on contrast
As described above, the psychophysical method to estimate gamma uses a relative luminance range between 0.0 and 1.0. This definition of the relative luminance implies zero luminance for a black screen (when R=G=B=0). In practice, because of reflected ambient light even in a dark room, backlight leakage (for LCD), and phosphor persistence (CRT), there is a positive luminance even when test pixels are set to zero (known as “black level”). Black levels are much lower with plasma, DLP and, particularly, OLED displays. In our experiments, we measured black levels of about 3–5 cd/m2 when the displays were at such state. This “residual” luminance results in a difference between the contrast calculated from a relative luminance model, as applied in our method, and the contrast calculated from a model accounting for the absolute minimum luminance. For dark (foreground) on light (background) stimuli (as in a Pelli-Robson chart), the error in log-contrast is a function of the minimum and maximum luminances and the background luminance. For example, if the display’s luminance range is from 5 to 100cd/m2 (as for our CRT), and the background is 100cd/m2, the error will be about 0.02 log units, while if the background luminance is 25cd/m2, the error will be about 1.0 log units. If the minimum luminance is 2cd/m2, those errors would be about 0.01 and 0.04 log units respectively, and, if the maximum luminance is 200cd/m2 (as for our LCD), those errors would be about 0.004 and 0.02 log units respectively. As can be seen section 6.2, for a bright background (near maximum luminance), those errors are negligible, being smaller than the measurement noise in those validations. These calculations also hold for the Michelson contrast definition. It is possible to reduce or eliminate these errors if the ratio of the minimum luminance to the luminance range is known or estimated. We did not implement this correction, as the errors were sufficiently small to ignore in our applications.
4 Color matching and bit-stealing for luminance resolution expansion
For a letter displayed on a white background of an 8 bit display with R=G=B, there are few possible displayable contrasts near the visible contrast threshold. Software based techniques to increase the luminance resolution include: spatial dithering - halftoning (Ulichney, 1988; Mulligan & Ahumada, 1992; Pappas & Neuhoff, 1992; Peli, 1992b), temporal dithering (Mulligan, 1993; Dorr et al., 2013) and color dithering (bit-stealing: Tyler, 1997b). Because halftoning trades resolution for gray-scale and temporal dithering may result in visible speckling, we chose to implement bit-stealing, where a small, usually subthreshold, difference in hue is the only cost of the expansion.
Bit-stealing uses unequal levels of R, G, B to produce pseudo-gray luminance values that are inserted between the 256 values of luminance available with R=G=B. To compute the intermediate luminance, one needs to obtain the relative luminances of the primary colors. The ratio of the relative luminance were used to calculate (δR, δG, δB), which are combinations of increments of 0, 1, or 2 of each color grey level to be added to the three channels to alter the luminance. A more complete treatment is given in Step 4 of the online supplementary “How-To” guide. The luminance ratios of color pairs are device-specific, may also change with different display settings, and may vary between observers under some circumstances. Tyler suggested that such a ratio can be measured psychophysically using either a flicker test between pair of colors, or a minimum distinct border match between adjacent color patches. We found with both approaches, that it was difficult even for an experienced observer to make the required judgments. Therefore, we implemented an approach that we found to be easy for untrained observers.
4.1 Color luminance ratios measurement
To estimate the luminance ratios we implemented, at the suggestion of Jeff Mulligan (Personal communication, 2007), a motion illusion procedure (Anstis & Cavanagh, 1983; Mulligan, 2009). This technique has been used in several diverse studies including testing luminance contrast with IOLs (Pierre, Wittich, Faubert & Overbury, 2007), where they used the method of adjustment until flicker, rather than motion, was perceived. We had tried this method, but found it difficult and thus switched to a forced-choice staircase. We modified the Anstis and Cavanagh technique slightly2. A sequence of four frames, arranged in the temporal order shown in Figure 4, was played in a loop with a temporal rate of 5 frames per second. In frames 1 and 3 red and green bars alternated and in frames 2 and 4 bright and dark yellow bars alternated.
Figure 4.

The four-frame sequence used in the Green/Red equi-luminance matching task. In frames 1 and 3, the Red bar remains constant and the green bar is adjusted according to the observer response. The sequence shown here with the green brighter than red will result in image motion to the left. Note that all bars in this figure are uniform (i.e. one color). On some displays and printers, the 2nd and 4th frames may show sampling/aliasing artifacts.
The sequence of frames creates a motion illusion of the vertical bars moving either to the left or right. A green bar, being brighter than the red bar, would cause the green bar at frame 1 to appear to “move” to the closer brighter yellow bar on frame 2, then onto the closer green bar at frame 3. This creates the illusion of the grating moving to the left. Likewise, a green bar darker than the red bar induces a rightward motion. When the green and red bars appear to have equal brightness, there is no apparent motion, just flickering bars. At each presentation, the observer reports in a forced-choice procedure whether the bars appear to be drifting left or right. Thus there is no need for a nulling of the motion to be perceived.
From the measured color ratios, we then generated the LUT to produce intermediate values of luminance (see Step 4 of the supplementary materials).
4.2 Results for color matching
Color ratios may vary between individuals based on individual differences in sensitivity to the primary colors of the display. Three experienced observers and four initially naïve observers with normal color vision repeated the luminance ratio estimation on an LCD, 10 times each (except one subject who did 6) over a period spanning 3 months (Figure 5). We analyzed the relative color ratios; the psychophysically estimated color ratio divided by the ratio obtained using the photometer. There were differences between observers for the green/red ratio (ANOVA, F6,56=25.2, p<0.0001) and for the red-blue ratio (F6,56=113, p<0.0001). One subject was more variable than the others for green/red ratio (Levene, F6,57=9.57, p<0.0001). For the red/blue ratio, the naïve subjects were less variable than the experienced subjects (F1,62=9.61, p=0.003). Over the limited age range of these observers (22 to 49y), there was a trend for older subjects to have a higher red/blue ratio, consistent with age related changes in the media but it was not statistically significant.
Figure 5.
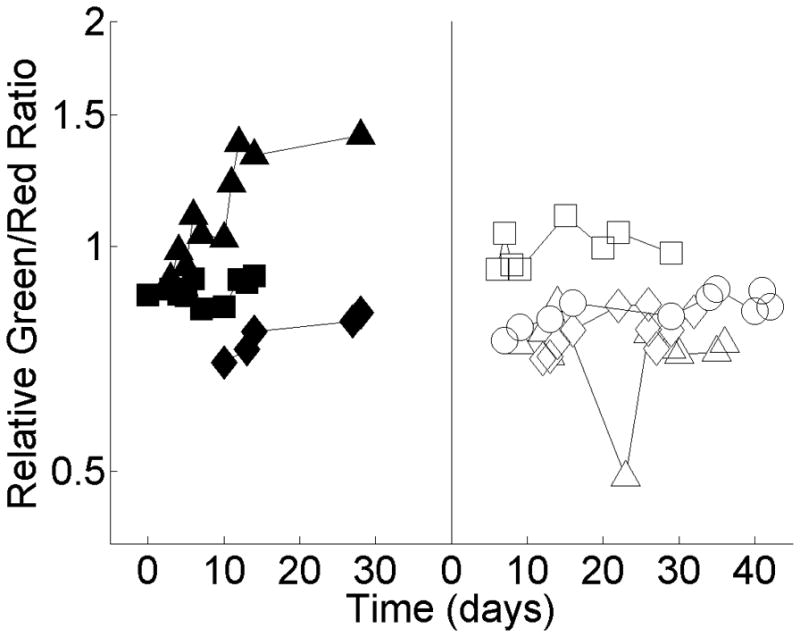
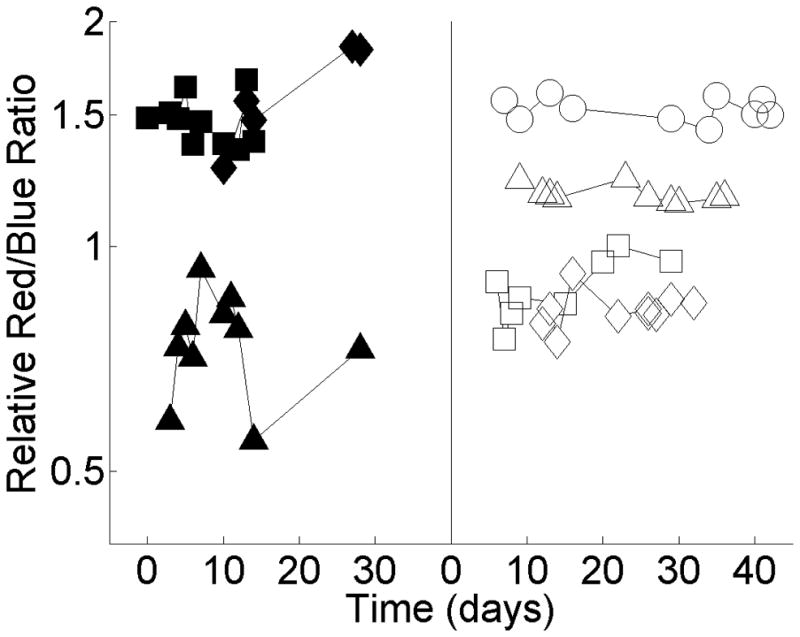
Relative green/red ratio (A) and relative red/blue ratio (B) for an LCD obtained from 3 experienced observers (filled markers) and 4 initially naïve observers (open symbols) measured repeatedly over a period of weeks. The green-red ratio of that LCD display, measured with the photometer, was 2.43, and the red/blue ratio was 2.78.
A summary of the color ratios of 6 LCDs, 6 CRTs, 2 HDTVs and 2 DLP projectors measured with a photometer are shown in Table 1. From that table, we set the hypothetical ranges for two luminance ratios. This is done by setting max(G/R) = max(G)/min(R); min(G/R) = min(G)/max(R); and similarly for R/B. Doing this we got the ranges: G/R ∈ (1.5, 6.5) and R/B ∈ (0.8,5.0) that were inclusive of the subjective ratios measured by the subjects. Based on (R,G,B) values to produce a contrast of 2.0 log units (1%), extracted from a look up table generated using fixed ratios G/R=3.5 and R/B = 2.0, we plotted (Figure 6) the expected contrast when the color ratios varied within the above ranges. The range of contrast obtained was from 1.90 to 2.04 log units, equivalent to about 3 letters on the Pelli-Robson and Mars paper charts.
Table 1.
The distribution of values of the ratio of each color (R,G,B) to the total luminance for 16 displays.
| Color | Median | Min | Max |
|---|---|---|---|
| Red | 0.23 | 0.12 | 0.26 |
| Green | 0.67 | 0.64 | 0.79 |
| Blue | 0.10 | 0.08 | 0.14 |
Figure 6.
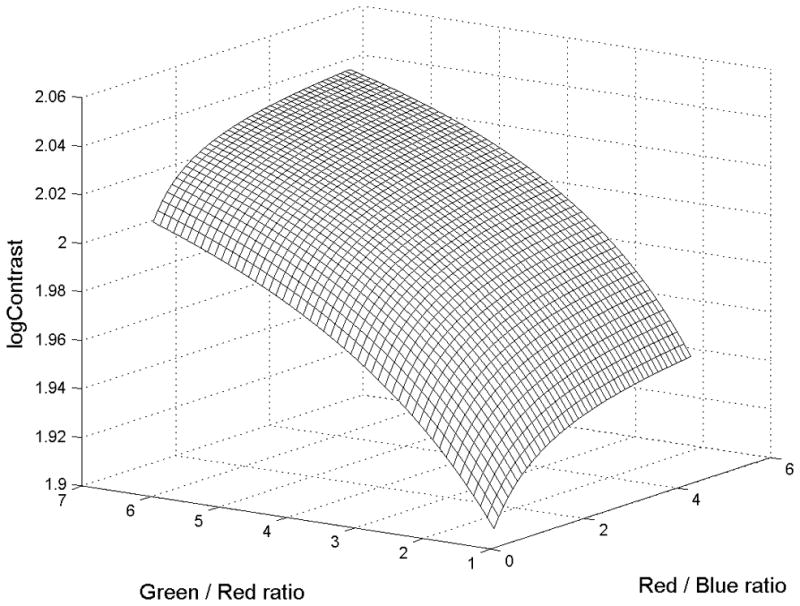
Model of the variability of log contrast values with a range of color ratios. The output log-contrast was modeled with the ratios G/R ∈ (1.5, 6.5) and R/B ∈ (0.8,5.0). An initial lookup table was generated using two fixed ratios G/R=3.5 and R/B=2.0. From the lookup table, RGB values (R=252, G=253, B=252) corresponding to an intended log-contrast of 2.0 (1%) were extracted, and then used to calculate the contrast at each set of hypothetical color ratios in the above ranges. The log-contrast (on the z-axis) varied between 1.90 and 2.04.
5 Liquid crystal display (LCD) versus cathode-ray tube (CRT)
CRTs have been replaced with LCD technology in most applications. The relationship between the voltage in an LCD pixel and the light intensity is an s-shaped curve that is nearly linear for the large region between the foot and shoulder of the s-curve (James Larimer, Personal communication, 2011). This difference from the CRT gamma function is controlled in most LCDs by electronically creating a desired display gamma function, thus providing backward compatibility with digital image content that was created for CRTs.
Several issues can affect contrast accuracy when displaying a stimulus on commercially available LCDs.
5.1 Gamma correction on LCD
We photometrically measured and fitted gamma functions to measurements of a CRT (ViewSonic G810) and a LCD (NEC MultiSync2090uxi). The residuals of the fits for both displays were of the same magnitude even though the LCD maximum luminance (200cd/m2) was twice that of the CRT (100cd/m2).
For commercial LCDs, the luminance output has likely been adjusted electronically to resemble the native gamma function of a CRT. Gamma correction is usually provided in the setup menu controls of many modern LCDs. While it is possible to set gamma to various values within the range specified by the manufacturer, we chose to select the display default value, as we expect the display to be optimized for this mode.
5.2 Effects of LCD top brightness on contrasts
For an LCD, there is usually a discontinuity in the light levels emitted between the 254 and 255 pixel values. At 255, the voltage to the LC cells that regulate the backlight transmittance is eliminated, allowing maximum transmittance. The difference between that light level and the level transmitted for the 254 level is not well regulated and can vary widely from other one-level transitions. Thus, a fitted gamma model may not properly represent low contrast stimuli with the background level set to 255 on an LCD. A simple solution is to change the maximum background luminance used on LCD to the well regulated 254.
5.3 LCD screen directionality
Despite recent advances to reduce the directional sensitivity along one dimension inherent in LCD technology (Badano, Gallas, Myers & Burgess, 2003; Krupinski, Johnson, Roehrig, Nafziger, Fan & Lubin, 2004), screen directionality remains a concern to be addressed. While early displays had this increased sensitivity set along the horizontal dimension, current displays usually are manufactured to have the directional sensitivity to be higher along the vertical dimension of the display. This effect is particularly crucial when using the display from a short distance such as in touch screen application, in which case different parts of the screen may be viewed from a sufficiently different angle to affect the imaging. To limit the impact of this effect in such an application we used a chin rest to ensure the angles and distances remained constant, and lowered the LCD on its base and tilted the LCD screen up by 18° so that the subjects’ eyes were perpendicular to the center of the screen. This also made it easier and more comfortable for older subjects to see through any bifocal or multifocal near vision segment of their glasses.
Normally, we calibrate with the viewer or the photometer perpendicular to the center of the display. When we calibrated, psychophysically and photometrically, with our NEC MultiSync LCD display tilted 18° to the direction of the viewer or the photometer, we found no discernible difference in the calibrations compared to those done perpendicular. Despite this lack of difference on that LCD, the importance of doing the calibration at the same angle as the contrast measurement cannot be over emphasized. Care must be taken so that when moving sufficiently far away from the screen so that the alternating lines pattern is invisible, that the operator’s eyes remain perpendicular to the center of the screen.
6 Verification
6.1 Validation measurement procedure
To validate our visual calibration, we compared contrasts produced with the visual calibrations to the photometrically measured foreground and background luminance ratios. Because photometer measurements are affected by many factors, such as display fluctuations, ambient or reflected light, and meter inaccuracy, a single measurement is inherently noisy. For a white background of 200 cd/m2 and a contrast of 2.0 log units (1%), the foreground luminance has to be 198 cd/m2. For the next lower nominal contrast value at 2.1 log units (0.79%), the expected foreground luminance has to be198.4 cd/m2 (a difference of only 0.2%). Our luminance meter, the Minolta LS-1003, has a specified inaccuracy of ±0.2%. This could place the distinction between two nominal luminance values (0.4 cd/m2) within the margin of errors limiting our ability to validate the results. To alleviate this, we measured, in random order, the background luminance and foreground luminances for 25 nominal values of contrasts, ranging from 0.0 to 2.5 log units in increments of 0.1 log units, each ten times. See Step 5 of the online supplementary materials for a more complete treatment of the procedure.
6.2 Results of verification procedure
Figure 7 shows the contrasts obtained with photometer-derived and psychophysically-derived calibrations for a CRT and a LCD, for the range 1.8 to 2.4 log units. Those lower contrasts are more difficult to create, and only obtained through bit-stealing. For the higher contrasts (<1.8 log units), the measured contrasts were generally indistinguishable from the intended contrasts. The psychophysical calibration contrasts were very similar to those obtained using photometric calibration for both displays (ANOVA, F1, 264=0.09, p=0.77). For both calibration methods, the measured contrasts are more variable with the CRT than with the LCD (Levene, F1,1068=607, p<0.0001), while for each display, the two calibration methods had the same variability (Levene, F6,528<2.07, p>0.15). The source of this greater variability with the CRT is not known to us, and may not have been described before. A limitation of this calibration verification (and all others of which we are aware) is that the foreground and background are measured at different times (in the same location). This suggests that the CRT has larger variability of luminance over time than the LCD. It is possible that the actual instantaneous contrasts with the CRT were less variable than we measured, since temporal variations in luminance would affect all intended luminances at that time such that the contrasts would be maintained (even though the luminance was fluctuating).
Figure 7.
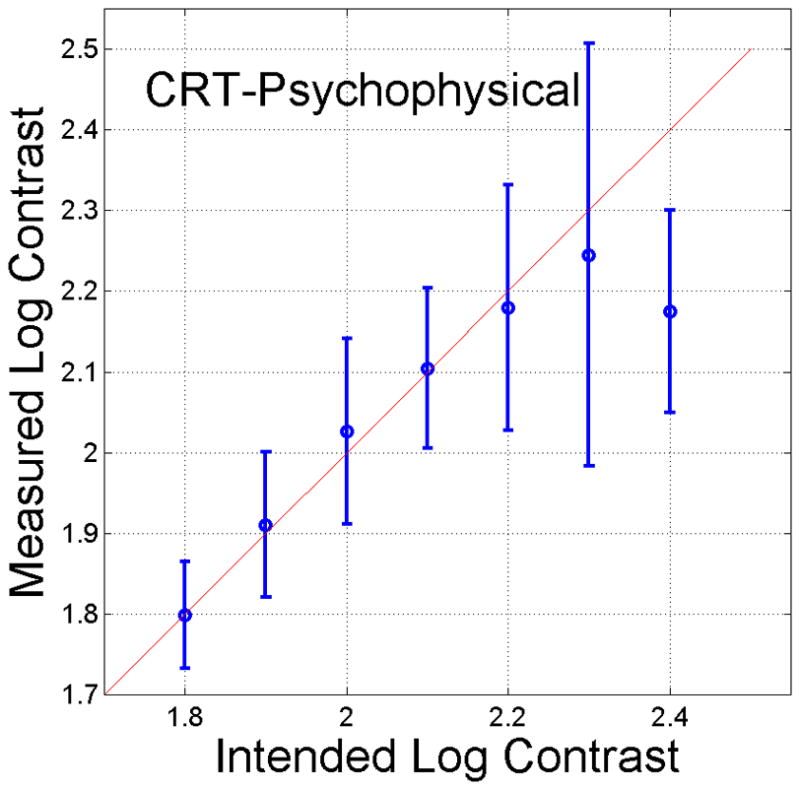
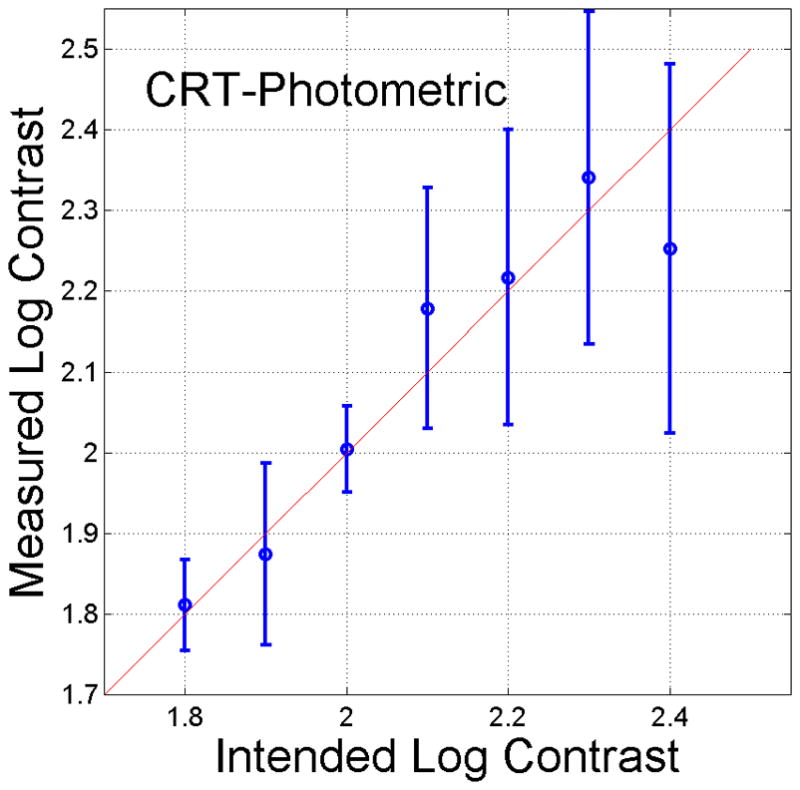
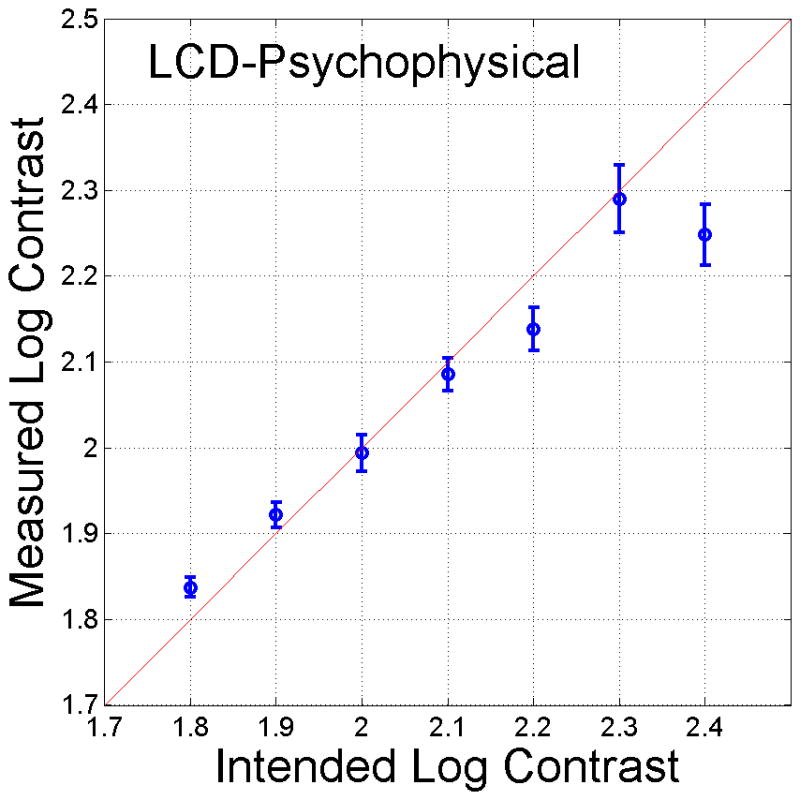
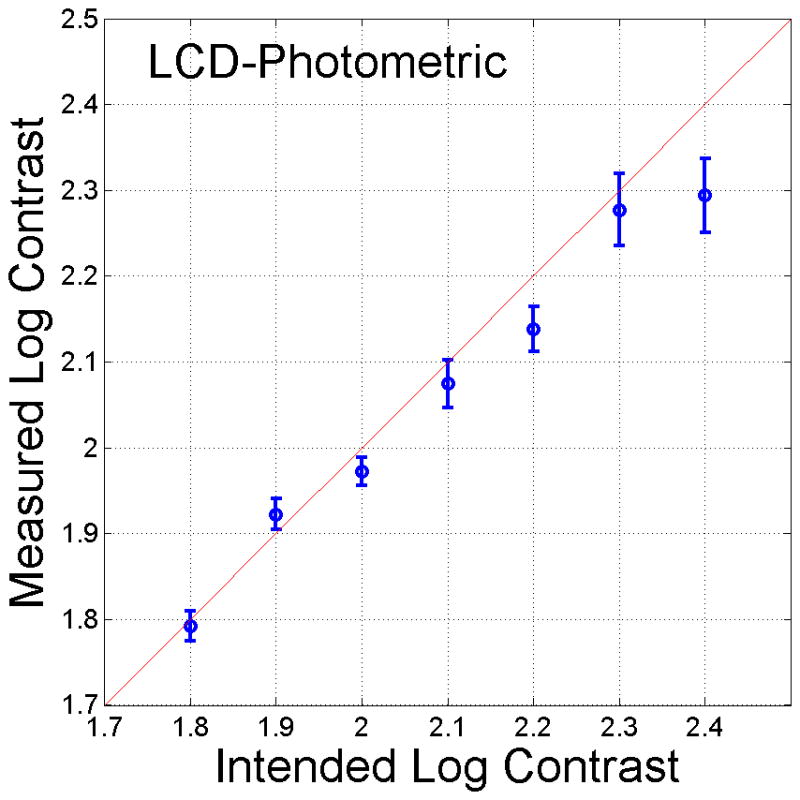
Comparison of contrasts achieved using the psychophysical method against its intended values for the lowest contrast values (1.8 to 2.4 log units) of a CRT and an LCD. For contrast below 1.8 log units (not shown), and for all conditions, the intended versus measured values fell exactly on the 45 degree line. Note that the error bars (standard deviations) for the LCD are smaller than the CRT, which suggests that low contrast stimuli presented on an LCD may be more stable than on CRT.
7 Discussion
It is inevitable that many vision tests in clinics, for routine care and for clinical trials, will transition to electronic displays (for now, these are likely to be LCD rather than CRT, DLP, OLED or plasma). Paper-based charts are subject to problems (Crossland, 2004; Dougherty et al., 2005), particularly effects of dirt, creasing, fading and difficulties obtaining and maintaining good illumination. It is also expected that CS testing will be more widespread and proper CS testing requires accurate calibration of the display system. Display systems are more vulnerable to miscalibration than paper charts as their parameters may be modified intentionally or otherwise. Some calibration problems mostly affect measurements of absolute thresholds and have little consequence for laboratory studies in which responses are compared across different conditions (e.g. Garcia-Perez, Alcalá-Quintana, Woods & Peli, 2011). However, such miscalibrations are problematic in clinical studies when an individual’s responses are compared to normative data or across clinics. Such miscalibrations of absolute contrast also affect large multi-laboratory studies, and were reported to occur in the Modelfest project (see Ahumada & Scharff, 2007). Difficulties in calibrating CS testing on a display were reported in a paper where the contrast levels used could only be specified to be monotonic (Chetrit, Gaudet, Wittich, Bailey & Overbury, 2009). Such limited calibration does not enable comparisons across papers or even across locations or screens within a single study.
However, some of the problems we addressed here, such as unaccounted-for display saturating non-linearity or non-monotonic expanded gray scale, may affect any studies, as they can result in improper representation of some contrast levels across a single experiment. Thus, appropriate calibration procedure is essential for successful implementation of these systems in the clinics and even more so in remote home testing. Evidence in the literature show that improper calibration is not rare even in highly-equipped laboratories and must be endemic in clinics where the photometric equipment is usually not available to perform or test for appropriate calibration.
We developed and validated a visual calibration system that does not require a photometer and can be easily performed by a normally-sighted person with no prior psychophysics experience. While components of our system have been mentioned in the literature, and some have been implemented, to our knowledge this is the first example of combining all the necessary components in one system and of validating the effect by photometric measurement and comparison to photometric calibrations. Furthermore, most prior work was conducted with CRTs while we have expanded the applications to LCDs and addressed specific characteristics and limitations of LCDs. A previous study using a CRT (Colombo & Derrington, 2001), reported achieving consistent performance for contrasts of 4% and higher, while our systems performance was excellent down to contrasts of 0.5% (log contrast = −2.3) for both CRT and LCD displays.
The visual calibration method has advantages and limitations. Some of these limitations are shared with photometric calibrations and some are specific to the visual calibration. The visual calibration is highly sensitive to display saturating non-linearity, as a monotonically-increasing gamma function is assumed. With photometric calibration a correction lookup table may be implemented without any model simply by inverting the measurement results. Sufficient elimination of the saturating non-linearity in some displays may be difficult. We noted, when evaluating the 16 different displays, that more expensive displays provided better and easier control of the parameters that are needed to reduce or eliminate saturating non-linearity. Meaningful display calibration must take into consideration room ambient light, scattering of light from regions outside the measurement patch, and even light reflected from the clothing of the observer. Many inexpensive photometric calibration methods, that attach a photocell to the display surface, do not account for these factors. Visual calibration naturally incorporates all of these aspects. In order to take full advantage of these benefits, it is preferable that the calibration is conducted under the same lighting condition and observation distance as used in the experimental session whenever possible.
The color ratio needed for bit-stealing may be affected by the calibrator (Figure 5), color vision deficiency and age (yellowing of the crystalline lens). This needs to be addressed for both photometric and visual calibration. With visual calibration, using a calibrator who is from the expected subject population will naturally and directly adjust for these effects. The effect of color ratio is of interest only if its magnitude is meaningful. For an intended contrast of 2.0 log units, variation of the color ratio among devices and normally-sighted observers can result in a contrast of 1.90 to 2.04 log units. This range of 0.14 log units corresponds to about 3 letters in the Mars or Pelli-Robson charts. These errors are of the same magnitude as the coefficient of repeatability reported for these charts (Thayaparan et al., 2007). That study (Thayaparan et al., 2007) found worse repeatability for the TestChart 2000, a commercial system that uses bit-stealing but assumes color ratios of 1.0 in all cases (David Thomson, Personal communication, 2008). Under this assumption, the luminance output could be non- monotonic and would produce questionable results at low contrasts where the effect of bit-stealing is crucial. Thus, measuring the color ratios rather than using a generic value will eliminate a small, but systematic source of error in the measurements.
There are a number of limitations of our technique that also affect the photometric calibration technique. The bit-stealing technique which works well for general images, may be affected by the hue difference particularly for an application like our letter CS (Woods, Fullerton, Goldstein, McNiff, McIvor & Peli, in preparation) where we render large uniform regions against a background that is also large and uniform. When this happens, the stimulus and the background are each specified by a single entry in the look-up table and thus detection may be accomplished by the combination of luminance contrast and color contrast. It has been shown that slight color differences can affect luminance contrast threshold (Gur & Akri, 1990). This problem may be limited by modifying both the background and letter values by selecting entries from the look up table that are close in ratio to the intended contrast but are also closer in hue. Another solution may be achieved by dithering the luminance contrast slightly using the color bit-stealing across a narrow range for both regions thus trading the hue difference for a slight luminance noise (Tyler, 1997b).
Brainard (1989; Brainard et al., 2002) noted that the use of displays in psychophysics experiments implicitly relies on four assumptions: (1) phosphor constancy – that the relative spectral power spectra of the light emitted does not vary with the intensity of stimulation; (2) phosphor independence – that the emitted intensity of a phosphor is determined by the input value and is independent of the other two phosphors; (3) spatial independence – that the display’s output at a location depends only on the input values for that location; and (4) single scale factor – that the relative intensities of the phosphors do not vary by location. Although that described CRTs, the treatments of how these assumptions affect the desired luminance is valid also for LCDs.
We have found that letter-CS (absolute values) and repeatability, measured using a computer-based test with CRTs and LCDs that were visually calibrated, were comparable to Pelli-Robson and Mars charts (Woods et al., in preparation). Our visual calibration was validated with a letter-CS test, consisting of gray letters on a white background, in mind. There are many other applications for which this technique may be appropriate, but would require additional validation. However, the measurement of letter-CS, because it operates at the limits of the human visual system and deals with minute differences in contrast is extremely demanding and thus we expect other applications of this technique to pose no difficulty.
Future technologies such as OLED and plasma may replace the LCD and they have one distinct advantage of black – zero value actually being black.
8 Conclusions
We have brought together several psychophysical techniques to develop a simple, easily deployed, display calibration technique. The procedure is usable for both CRTs and LCDs and has been validated for both. Although there are limitations in its general laboratory use, the availability of this calibration technique would enable CS measurements that can be done in the home, over the Internet, or in clinics at remote locations. We will make our software available upon request at no charge to non-profit institutions and with the proper execution of a material transfer agreement specifying rules for citation and prohibiting further distribution. The software will be supplied “as is” with no assurance of continuing support.
Supplementary Material
Acknowledgments
Supported in part by a grant from Johnson & Johnson Vision Care, Inc. and NIH grants EY05957 and EY19100
Footnotes
In a pilot experiment, we determined the best increments (on our displays) for the saturation test bars as follows: For the bright background: for grayscale, pixel-value increment=2 (e.g. the squares were 253, 251, 249, etc.) For the color patches, the increments were green=3, red=4, blue=5. For the dark background: grayscale increment=3, all colors increment= 5.
In their method, the green bar luminance remained fixed whereas we fixed the red luminance. Since the green channel in most displays is brighter than the red channel at the same input pixel value, fixing the green channel carries the risk that the luminance at that pixel value is higher than the maximum luminance available for the red channel, whereas the luminance of any red pixel value will be within the range of the green channel. The same argument can be applied for luminance matching between red and blue (i.e. it is preferable to fix the channel that is expected to have the lower maximum luminance).
This is a fairly expensive photometer, costing about $3,500
Previously presented: To L, Woods RL, Peli E. Visual calibration of displays for accurate contrast reproduction. SID International Symposium, May 31-June 5, 2009
References
- Ahumada A, Scharff L. Lines and dipoles are efficiently detected (abstract) Journal of Vision. 2007;7(9):337. [Google Scholar]
- Anstis SM, Cavanagh P. A minimum motion technique for judging equiluminance. In: Mollon JD, Sharpe LT, editors. Color Vision: Psychophysics and Physiology. London: Academic Press; 1983. pp. 66–77. [Google Scholar]
- Arditi A. Improving the design of the letter contrast sensitivity test. Investigative Ophthalmology and Visual Science. 2005;46(6):2225–2229. doi: 10.1167/iovs.04-1198. [DOI] [PubMed] [Google Scholar]
- Badano A, Gallas BD, Myers KJ, Burgess AE. Effect of viewing angle on visual detection in liquid crystal displays. Proceedings of SPIE, Medical Imaging 2003: Visualization, Image-Guided Procedures, and Display; Bellingham, WA. 2003. pp. 474–483. [Google Scholar]
- Besuijen J. Visual gamma measurement and methods to compare gamma models. Journal of the Society for Information Display. 2007;15(8):611–623. [Google Scholar]
- Brainard DH. Calibration of a computer controlled color monitor. Color Research and Application. 1989;14(1):23–34. [Google Scholar]
- Brainard DH, Pelli DG, Robson T. Display characterization. In: Hornak J, editor. Encyclopedia of Imaging Science and Technology. Hoboken, NJ: John Wiley & Sons, Inc; 2002. pp. 172–188. [Google Scholar]
- Chetrit S, Gaudet M, Wittich W, Bailey IL, Overbury O. A comparative study of the efficiency of chart versus computer-generated contrast sensitivity testing in glaucoma patients and controls. Canadian Journal of Optometry. 2009;71(3):34–41. [Google Scholar]
- Colombo E, Derrington A. Visual calibration of CRT monitors. Displays. 2001;22:87–95. [Google Scholar]
- Corwin TR, Carlson NB, Berger E. Contrast sensitivity norms for the Mentor B-VAT II-SG video acuity tester. Optometry and Vision Science. 1989;66(12):864–870. doi: 10.1097/00006324-198912000-00011. [DOI] [PubMed] [Google Scholar]
- Crossland MD. The role of contrast sensitivity measurement in patients with low vision. Optometry in Practice. 2004;5(3):105–114. [Google Scholar]
- Dagnelie G, Kramer KM, Seifert G, Yang L, Havey G. Bringing outcome measurement to the patient: Design of a calibration system for PC-based vision testing (Poster Presentation). Proceedings of the 9th International Conference on Low Vision-Vision; 2008; Montreal, QC. 2008. [Google Scholar]
- Dagnelie G, Yang L, Bahrami H, Stone J, Melia M. Vision tests for the home PC: Test validation and results from a lutein supplementation trial. Journal of Vision. 2003;3(12):57. [Google Scholar]
- Dagnelie G, Zorge IS, McDonald TM. Lutein improves visual function in some patients with retinal degeneration: A pilot study via the Internet. Optometry. 2000;7(13):147–164. [PubMed] [Google Scholar]
- Dakin SC, Greenwood JA, Carlson TA, Bex PJ. Crowding is tuned for perceived (not physical) location. Journal of Vision. 2011;11(9):2, 1–13. doi: 10.1167/11.9.2. [DOI] [PMC free article] [PubMed] [Google Scholar]
- Dorr M, Lesmes L, Zhong-Lin L, Bex PJ. Investigative Ophthalmology and Visual Science. 2013. Rapid and reliable assessment of the contrast sensitivity function on an iPad. Submitted. [DOI] [PMC free article] [PubMed] [Google Scholar]
- Dougherty BE, Flom RE, Bullimore MA. An evaluation of the Mars Letter Contrast Sensitivity Test. Optometry and Vision Science. 2005;82(11):970–975. doi: 10.1097/01.opx.0000187844.27025.ea. [DOI] [PubMed] [Google Scholar]
- Falkenberg HK, Rubin GS, Bex PJ. Acuity, crowding, reading and fixation stability. Vision Research. 2007;47(1):126–135. doi: 10.1016/j.visres.2006.09.014. [DOI] [PubMed] [Google Scholar]
- Garcia-Perez MA, Alcalá-Quintana R, Woods RL, Peli E. Psychometric functions for detection and discrimination with and without flankers. Attention, Perception, and Psychophysics. 2011;73(3):829–853. doi: 10.3758/s13414-010-0080-8. [DOI] [PMC free article] [PubMed] [Google Scholar]
- Gur M, Akri V. Human contrast sensitivity is enhanced by color (abstract) Investigative Ophthalmology and Visual Science. 1990;31(4, Suppl):264. [Google Scholar]
- Haun AM, Woods RL, Peli E. Electronic magnification and perceived contrast of video. Journal of the Society for Information Display. 2012;20(11):616–623. doi: 10.1002/jsid.127. [DOI] [PMC free article] [PubMed] [Google Scholar]
- Kay RL, Brandenberg CB. United States Patent 7,304,482. Nonlinearities of a display device by adaptive bisection with continuous user refinement. 2007 Dec 4;
- Krupinski EA, Johnson J, Roehrig H, Nafziger J, Fan J, Lubin J. Use of a human visual system model to predict observer performance with CRT vs LCD display of images. Journal of Digital Imaging. 2004;17(4):258–263. doi: 10.1007/s10278-004-1016-4. [DOI] [PMC free article] [PubMed] [Google Scholar]
- Lavin Y, Silverstein AD, Zhang X. Visual experiment on the Web. Proceedings of SPIE, Human Vision and Electronic Imaging IV; Bellingham, WA. 1999. [Google Scholar]
- Li X, Lu ZL, Xu P, Jin J, Zhou Y. Generating high gray-level resolution monochrome displays with conventional computer graphics cards and color monitors. Journal of Neuroscience Methods. 2003;130(1):9–18. doi: 10.1016/s0165-0270(03)00174-2. [DOI] [PubMed] [Google Scholar]
- Mulligan J. Methods for spatiotemporal dithering. The SID International Symposium Digest of Technical Papers. 1993;24:155–158. [Google Scholar]
- Mulligan JB. Presentation of calibrated images over the web. Proceedings of SPIE-IS&T Electronic Imaging; Bellingham, WA. 2009. pp. 1–10. [Google Scholar]
- Mulligan JB, Ahumada AJ., Jr Principled halftoning based on human vision models. Proceedings of Human Vision, Visual Processing and Digital Display III; Bellingham, WA. 1992. pp. 109–121. [Google Scholar]
- Niebergall R, Huang L, Martinez-Trujillo JC. Similar perceptual costs for dividing attention between retina- and space-centered targets in humans. Journal of Vision. 2010;10(12):4, 1–14. doi: 10.1167/10.12.4. [DOI] [PubMed] [Google Scholar]
- Pappas TN, Neuhoff DL. Least-squares model-based halftoning. Proceedings of SPIE, Human Vision, Visual Processing, and Digital Display III; Bellingham, WA. 1992. pp. 109–121. [Google Scholar]
- Peli E. Display nonlinearity in digital image processing for visual communications. Optical Engineering. 1992a;31(11):2374–2382. [Google Scholar]
- Peli E. United States Patent 5,109,282. Halftone imaging apparatus and method. 1992 Apr 28;
- Pelli DG, Robson JG, Wilkins AJ. The design of a new letter chart for measuring contrast sensitivity. Clinical Vision Sciences. 1988;2(3):187–199. [Google Scholar]
- Pelli DG, Zhang L. Accurate control of contrast on microcomputer displays. Vision Research. 1991;31(7–8):1337–1350. doi: 10.1016/0042-6989(91)90055-a. [DOI] [PubMed] [Google Scholar]
- Pierre A, Wittich W, Faubert J, Overbury O. Luminance contrast with clear and yellow-tinted intraocular lenses. Journal of Cataract and Refractive Surgery. 2007;33(7):1248–1252. doi: 10.1016/j.jcrs.2007.03.024. [DOI] [PubMed] [Google Scholar]
- Press WH, Teukolsky SA, Vetterling WT, Flannery BP. Numerical Recipes in C: The Art of Scientific Computing. Cambridge: Cambridge University Press; 1992. [Google Scholar]
- Regan D. Low-contrast letter charts and sinewave grating tests in ophthalmological and neurological disorders. Clinical Vision Sciences. 1988;2(3):235–250. [Google Scholar]
- Rutstein RP, Corliss DA. BVAT distance vs. near stereopsis screening of strabismus, strabismic amblyopia and refractive amblyopia; A prospective study of 68 patients. Binocular Vision and Strabismus Quarterly. 2000;15(3):229–236. [PubMed] [Google Scholar]
- Sharma G. Comparative evaluation of color characterization and gamut of LCDs versus CRTs. Proceedings of SPIE, Color Imaging: Device-Independent Color, Color Hardcopy, and Applications VII; San Jose, CA. 2002. pp. 177–186. [Google Scholar]
- Swift D, Panish S, Hippensteel B. The use of the VisionWorks in visual psychophysical research. Spatial Vision. 1997;10(4):471–477. doi: 10.1163/156856897x00401. [DOI] [PubMed] [Google Scholar]
- Thayaparan K, Crossland MD, Rubin GS. Clinical assessment of two new contrast sensitivity charts. British Journal of Ophthalmology. 2007;91(6):749–752. doi: 10.1136/bjo.2006.109280. [DOI] [PMC free article] [PubMed] [Google Scholar]
- Tyler CW. Colour bit-stealing to enhance the luminance resolution of digital displays on a single pixel basis. Spatial Vision. 1997a;10(4):369–377. doi: 10.1163/156856897x00294. [DOI] [PubMed] [Google Scholar]
- Tyler CW. 1997 OSA Technical Digest Series: Vision Science and Its Applications. Vol. 1. Washington, DC: 1997b. Why we need to pay attention to psychometric function slopes; pp. SuD2-1/240–243. [Google Scholar]
- Ulichney RA. Dithering with blue noise. Proceedings of the IEEE. 1988;76(1):56–79. [Google Scholar]
- Vera-Díaz FA, Woods RL, Peli E. Shape and individual variability of the blur adaptation curve. Vision Research. 2010;50(15):1452–1461. doi: 10.1016/j.visres.2010.04.013. [DOI] [PMC free article] [PubMed] [Google Scholar]
- Waltuck MH, McKnight RN, Peli E. United States Patent 5,026,151. Visual Function Tester with Binocular Vision Testing. 1991 Jun 25;
- Watson AB, Nielsen KRK, Poirson A, Fitzhugh A, Bilson A, Nguyen K, Ahumada A. Use of a raster frame buffer in vision research. Behavior Research Methods, Instruments and Computers. 1986;18(6):587–594. [Google Scholar]
- Webster MA, Georgeson MA, Webster SM. Neural adjustments to image blur. Nature Neuroscience. 2002;5(9):839–840. doi: 10.1038/nn906. [DOI] [PubMed] [Google Scholar]
- Williams RE, Decker TA, Kurtzman C, Kuether CL. United States Patent 4,239,351. Apparatus For Generating and Displaying Visual Acuity Targets. 1980 Dec 16;
- Wong BP, Woods RL, Peli E. Stereoacuity at distance and near. Optometry and Vision Science. 2002;79(12):771–778. doi: 10.1097/00006324-200212000-00009. [DOI] [PubMed] [Google Scholar]
- Woods R, Fullerton M, Goldstein R, McNiff SA, McIvor T, Peli E. Search for low contrast letters as a measurement of contrast sensitivity. (In preparation) [Google Scholar]
- Woods RL, Nugent AK, Peli E. Lateral interactions: Size does matter. Vision Research. 2002;42(6):733–745. doi: 10.1016/s0042-6989(01)00313-3. [DOI] [PubMed] [Google Scholar]
- Yang JB. [Accessed February 4, 2013];Display Calibration. 2013 http://www.visionrc.com/Tweak/DisplayCal.aspx.
Associated Data
This section collects any data citations, data availability statements, or supplementary materials included in this article.


