

Summary
Background
Fast weight gain and linear growth in children in low-income and middle-income countries are associated with enhanced survival and improved cognitive development, but might increase risk of obesity and related adult cardiometabolic diseases. We investigated how linear growth and relative weight gain during infancy and childhood are related to health and human capital outcomes in young adults.
Methods
We used data from five prospective birth cohort studies from Brazil, Guatemala, India, the Philippines, and South Africa. We investigated body-mass index, systolic and diastolic blood pressure, plasma glucose concentration, height, years of attained schooling, and related categorical indicators of adverse outcomes in young adults. With linear and logistic regression models, we assessed how these outcomes relate to birthweight and to statistically independent measures representing linear growth and weight gain independent of linear growth (relative weight gain) in three age periods: 0–2 years, 2 years to mid-childhood, and mid-childhood to adulthood.
Findings
We obtained data for 8362 participants who had at least one adult outcome of interest. A higher birthweight was consistently associated with an adult body-mass index of greater than 25 kg/m2 (odds ratio 1·28, 95% CI 1·21–1·35) and a reduced likelihood of short adult stature (0·49, 0·44–0·54) and of not completing secondary school (0·82, 0·78–0·87). Faster linear growth was strongly associated with a reduced risk of short adult stature (age 2 years: 0·23, 0·20–0·52; mid-childhood: 0·39, 0·36–0·43) and of not completing secondary school (age 2 years: 0·74, 0·67–0·78; mid-childhood: 0·87, 0·83–0·92), but did raise the likelihood of overweight (age 2 years: 1·24, 1·17–1·31; mid-childhood: 1·12, 1·06–1·18) and elevated blood pressure (age 2 years: 1·12, 1·06–1·19; mid-childhood: 1·07, 1·01–1·13). Faster relative weight gain was associated with an increased risk of adult overweight (age 2 years: 1·51, 1·43–1·60; mid-childhood: 1·76, 1·69–1·91) and elevated blood pressure (age 2 years: 1·07, 1·01–1·13; mid-childhood: 1·22, 1·15–1·30). Linear growth and relative weight gain were not associated with dysglycaemia, but a higher birthweight was associated with decreased risk of the disorder (0·89, 0·81–0·98).
Interpretation
Interventions in countries of low and middle income to increase birthweight and linear growth during the first 2 years of life are likely to result in substantial gains in height and schooling and give some protection from adult chronic disease risk factors, with few adverse trade-offs.
Funding
Wellcome Trust and Bill & Melinda Gates Foundation.
Introduction
Promotion of faster weight gain in children with growth failure is an important goal of paediatric care in countries of low and middle income, in view of the well known associations between poor growth and impaired cognitive development and increased morbidity and mortality. However, some studies suggest that rapid weight gain in the first 2 years of life is related to an increased risk of obesity1,2 and insulin resistance3,4 later in life. Reports about this so-called catch-up dilemma5–7 draw attention to the potential risks and benefits of faster early growth. Much of the concern is based on studies of weight gain in children in high-income countries, without a concomitant consideration of how linear growth and weight gain relative to linear growth affect outcomes later in life. Separation of their effects is important because, although early linear growth strongly predicts adult height,8 lean body mass,9,10 attained schooling,11 employment,12 and earnings,13,14 excess adiposity is a well recognised risk factor for cardiometabolic diseases. The key questions for paediatricians and policy makers are: what is the optimum age for promotion of growth for enhanced survival and human capital, and will this promotion necessarily lead to an increase in cardiometabolic disease?
We explored how birthweight, linear growth, and weight gain relative to linear growth in childhood and adulthood are related to body size and composition, cardiometabolic risk factors (blood pressure and plasma glucose concentrations), and human capital outcomes (height and attained schooling) in young adults. We compared results across these diverse outcomes to explore possible trade-offs. We focused on birth and the period from 0 to 2 years to provide additional insights into the long-term importance of the first 1000 days—widely recognised as a particularly sensitive period for child health and development.
Methods
Study design and participants
We used data from five prospective birth cohort studies included in the Consortium for Health Orientated Research in Transitional Societies (COHORTS):15 the 1982 Pelotas Birth Cohort (Brazil);16 the Institute of Nutrition of Central America and Panama Nutrition Trial Cohort (Guatemala);17 the New Delhi Birth Cohort (India);10 the Cebu Longitudinal Health and Nutrition Survey (Philippines);18 and the Birth to Twenty Cohort (South Africa).19 All studies of these cohorts were reviewed and approved by appropriate ethics review boards.
Procedures
We identified common ages of childhood measurements across the five sites, and focused on birthweight, birthlength (available for Guatemala, India, and the Philippines), weight and length at age 2 years, and weight and height mid-childhood (aged 4 years for Brazil, Guatemala, India, and South Africa; 8 years for the Philippines). Birthweight was measured in hospitals at delivery in South Africa and Brazil, in the community by research staff within 72 h of birth in India, in hospitals or at home by birth attendants provided with project scales in the Philippines, and by a project nurse at home or in a health-care centre in Guatemala. Gestational age estimates were based on the mother's report of the date of her last menstrual period. Birthlength was measured by trained research staff within 72 h of birth in India, within 6 days in the Philippines, and 15 days after birth in Guatemala.
Statistical methods are needed to separate the effects of linear growth and weight gain because they are strongly correlated, as are repeat measurements taken in the same individual. We derived standardised residuals by regressing current size (represented as Fisher-Yates transformed weight-for-age and length-for-age Z scores) on all previous size measures to produce conditional size measures.20,21 Conditional height is present length or height accounting for previous length or height, and weight (but not present weight). Conditional relative weight is present weight accounting for present height and all previous weight and height measures. For example, adult conditional relative weight is derived from a regression of adult weight on adult height, weight and height at mid-childhood, weight and length when aged 2 years, and birthweight.
Conditional variables represent children's deviation from the expected size on the basis of their own previous measures and the growth of the other children in each cohort, and can be interpreted as representing faster or slower relative weight gain or linear growth. For example, a child with a positive value for mid-childhood conditional height is taller than expected in view of previous size and thus had a faster rate of linear growth than would be expected from age 2 years to mid-childhood. Our exposure variables represent birthweight and conditional height and conditional relative weight when aged 2 years, during mid-childhood, and during adulthood. Equivalents of the conditional variables (g or kg, and cm) are shown in the appendix (p 20).
We calculated conditional variables separately for each site and sex from the largest sample with complete non-pregnant anthropometric data at all selected ages to avoid bias as a result of including only individuals with adult outcomes. Because birthlength was not available for Brazil and South Africa, we included only birthweight in the regression models for all sites. In separate analyses of the three sites for which data for birthlength were available, we compared results with and without the inclusion of birthlength. Associations of the resulting conditional relative weight and conditional height variables with later outcomes were similar with each method.
Height, weight, and waist circumference were measured with standard techniques. Binary variables represent overweight and obesity (body-mass index [BMI] ≥25 kg/m2 or the International Obesity Task Force equivalent for individuals aged <18 years22) and short stature (height-for-age Z score23 <–2 when aged <19 years; or <150·1 cm for women and <161·9 cm for men if aged ≥19 years). Fat mass, fat-free mass, and percentage body fat were calculated with site-specific methods (bioelectrical impedance in Brazil; validated equations including weight, height, and abdominal circumference in Guatemala, or skinfold thickness in India and the Philippines; and dual x-ray absorptiometry [Delphi, Hologic] in South Africa).9 Within each site and sex, we used a Fisher-Yates transformation to express fat mass and fat-free mass in SD units to enable comparisons within and between sites.
Blood pressure was measured by aneroid sphygmomanometer in Brazil, mercury sphygmomanometer in the Philippines, and digital devices elsewhere (UA-767 [A and D Medical] in Guatemala; Omron M6 [Omron] in South Africa; and Omron 711 [Omron] in India). Participants were measured seated after 5–10 min of rest, with appropriate cuff sizes. We used the mean of three measurements (Philippines), two measurements (Brazil and India), or the second and third of three measurements (Guatemala and South Africa). In accordance with international recommendations, elevated blood pressure was defined as a systolic blood pressure of 130 mm Hg or more or a diastolic blood pressure of 85 mm Hg or more24 in view of the young ages and low prevalence of hypertension in several cohorts.
Fasting blood glucose concentration was measured in all cohorts except in Brazil, where a random finger-prick capillary whole-blood sample was obtained and adjusted for time since previous meal.25 Adjustments were made for differences in plasma, whole venous blood, and capillary values.26,27 Participants with glucose concentrations of 6·1 mmol/L or more, or those taking drugs for diabetes were considered to have dysglycaemia (ie, impaired fasting glucose or diabetes).28
The number of completed years of schooling was recorded in all sites.11 As an adverse outcome, a binary variable indicates failure to complete secondary school. Socioeconomic status at birth was represented by mother's education and a site-specific indicator of household wealth, which was a summary measure of housing type and ownership and type of dwelling (India), or an asset index based on household possessions (all other sites). Additionally, we tested whether inclusion of gestational age or premature birth (gestational age <37 weeks) affected the coefficients of the conditional variables.
Statistical analysis
We used linear regression for continuous outcomes and logistic regression for categorical outcomes to estimate associations with conditional height and conditional relative weight at different ages. Models for each outcome included the largest sample with complete data. We excluded women who were pregnant at the time of measurement from all analyses. We compared our main analysis sample with samples with adult data but incomplete anthropometry, and with those with birth measures but without adult outcome data by use of Bonferroni-adjusted ANOVA to account for multiple comparisons. To assess potential bias related to attrition and missing data, we compared results estimated by Heckman29 selection models with standard regression models.
We assessed site and sex heterogeneity with F tests, allowing other predictors (eg, age and socioeconomic status) to vary across sites. To measure the variation of effect sizes between combinations of sex and site, we used restricted maximum likelihood to estimate the SD of the effect size for each site and sex around their pooled value. This SD value is close to the SD of estimates specific to each site and sex for each growth variable with each outcome. When it is zero, the effect sizes for each sex and site are compatible with a fixed-effects model.
Glucose and blood-pressure models included birthweight, and conditional height and conditional relative weight when aged 2 years, at mid-childhood, and during adulthood. Because attained schooling cannot be affected by subsequent growth in people who dropped out as children or adolescents, schooling models exclude adult conditional relative weight and conditional height. Adult size outcomes (height, BMI, and body composition measures) also exclude adult conditional height and conditional relative weight. Because conditional height and conditional relative weight variables are not correlated, they can be included together in models without concerns about colinearity.
Because we noted heterogeneity by site and sex for at least one conditional relative weight or conditional height variable in most models, we present results stratified by sex and site; stratified by sex and adjusted for site; and pooled, adjusted for site and sex. Because of the large number of outcomes, we created detailed tables (appendix) that include all estimated coefficients, but summarised results graphically to present site and sex-specific coefficients, with sex-stratified pooled results. We adjusted all models for adult age. Adjustment for gestational age or socioeconomic status at birth did not meaningfully alter coefficients or p values in the models for body composition or cardiometabolic outcomes, so for these models we present results unadjusted for these factors. We adjusted height and schooling models for socioeconomic status at birth, and additionally adjusted height for maternal height to account for differences in genetic growth potential. Information about paternal height was not available. We used Stata (version 12) for analyses.
Role of the funding source
The sponsors of the study provided financial support for data management and data analysis, but had no other role in study design, data collection, data analysis, data interpretation, or writing of the report. The corresponding author had full access to all the data in the study and all authors made the decision to submit for publication.
Results
We obtained data for 8362 participants who had provided information about at least one adult outcome of interest (table 1). Participants who were lost to follow-up or excluded because of missing data rarely differed significantly from those who were included (appendix p 2). Mean adult age at which measurements were taken ranged from about 18 years in South Africa to more than 31 years in Guatemala (table 1). The prevalence of adverse outcomes generally reflects the age and relative economic development of the five samples. Adult height and fat-free mass were highest in Brazilian men (table 1). Dysglycaemia was too rare to analyse in sex-stratified models in the South African cohort (table 1).
Table 1.
Characteristics of participants in the five cohorts
|
Brazil |
Guatemala |
India |
Philippines |
South Africa |
||||||
|---|---|---|---|---|---|---|---|---|---|---|
| Men (n=1889) | Women (n=1702) | Men (n=171) | Women (n=155) | Men (n=775) | Women (n=553) | Men (n=1006) | Women (n=889) | Men (n=584) | Women (n=638) | |
| Birthweight (kg) | 3·29 (0·52) | 3·17 (0·51) | 3·09 (0·52) | 3·02 (0·43) | 2·85 (0·44) | 2·76 (0·39) | 3·03 (0·42) | 2·98 (0·41) | 3·14 (0·53) | 3·02 (0·48) |
| Birthlength (cm) | NA | NA | 49·8 (2·4) | 48·8 (2·1) | 48·6 (2·1) | 48·1 (2·0) | 49·4 (2·0) | 48·9 (2·0) | NA | NA |
| Gestational age (weeks) | 39·3 (1·9) | 39·1 (3·0) | 39·5 (3·0) | 38·7 (2·6) | 39·1 (2·5) | 38·6 (2·2) | 38·9 (2·1) | 38·2 (1·9) | 38·1 (1·9) | 39·3 (1·9) |
| Adult age (years) | 22·7 (0·4) | 22·7 (0·4) | 31·4 (1·4) | 31·1 (1·3) | 29·1 (1·3) | 29·2 (1·4) | 21·3 (0·8) | 21·1 (1·0) | 18·1 (0·6) | 18·1 (0·6) |
| Adult height (cm) | 173·8 (6·9) | 160·9 (6·2) | 163·0 (6·1) | 151·1 (5·2) | 169·6 (6·2) | 154·9 (5·6) | 163·0 (5·9) | 151·1 (5·4) | 170·8 (7·8) | 159·65 (6·21) |
| Adult weight (kg) | 72·1 (14·0) | 60·6 (12·6) | 64·3 (10·1) | 61·3 (11·5) | 71·8 (13·8) | 59·2 (13·1) | 56·0 (9·3) | 46·3 (7·9) | 60·1 (11·7) | 57·8 (10·5) |
| Adult body-mass index (kg/m2) | 23·8 (4·1) | 23·4 (4·7) | 24·1 (3·3) | 26·8 (4·6) | 24·9 (4·3) | 24·6 (5·0) | 21·0 (3·1) | 20·3 (3·1) | 20·6 (3·7) | 22·7 (3·9) |
| Adult waist circumference (cm) | 80·9 (10·2) | 74·8 (10·5) | 85·3 (8·3) | 92·3 (11·2) | 90·3 (11·9) | 79·6 (12·2) | 72·1 (7·5) | 67·7 (7·3) | NA | NA |
| Adult body fat (%) | 16·3 (3·8) | NA* | 19·4 (5·9) | 34·9 (6·9) | 24·2 (5·8) | 34·2 (6·9) | 16·7 (5·1) | 32·7 (4·8) | 14·3 (5·7) | 32·4 (6·4) |
| Adult fat mass (kg) | 12·2 (5·0) | NA* | 13·0 (5·9) | 22·1 (8·5) | 18·0 (6·9) | 20·9 (7·9) | 9·7 (4·5) | 15·4 (4·6) | 8·9 (5·3) | 19·4 (7·4) |
| Adult fat-free mass (kg) | 60·4 (9·6) | NA* | 51·3 (5·2) | 39·1 (3·3) | 53·8 (7·8) | 38·1 (5·7) | 46·3 (5·8) | 31·0 (4·2) | 50·9 (6·5) | 38·9 (5·5) |
| Adult systolic blood pressure (mm Hg) | 123·5 (14·4) | 111·2 (13·0) | 117·0 (10·4) | 107·7 (11·2) | 118·4 (11·4) | 106·8 (11·1) | 111·8 (10·9) | 99·4 (10·0) | 120·6 (10·7) | 114·7 (9·8) |
| Adult diastolic blood pressure (mm Hg) | 75·6 (11·7) | 71·6 (10·7) | 72·6 (9·2) | 69·3 (9·0) | 78·0 (10·3) | 73·6 (9·2) | 75·8 (9·6) | 67·8 (8·6) | 70·9 (8·8) | 71·9 (8·5) |
| Adult plasma glucose concentration (mmol/L) | 5·1 (0·7) | 4·9 (0·7) | 5·2 (0·6) | 5·1 (1·1) | 5·5 (1·1) | 5·3 (0·8) | 4·7 (0·6) | 4·5 (0·5) | 4·7 (0·5) | 4·5 (0·4) |
| Number of completed years of schooling | 8·9 (3·2) | 9·9 (3·1) | 5·0 (3·5) | 4·8 (3·5) | 13·2 (3·4) | 13·9 (3·1) | 10·3 (3·4) | 11·5 (2·8) | 10·8 (1·5) | 11·4 (1·3) |
| Mother's height (cm) | 156·7 (6·1) | 156·3 (5·8) | 148·5 (4·8) | 148·5 (5·3) | 152·0 (5·6) | 151·9 (5·0) | 150·6 (4·9) | 150·5 (4·9) | 158·5 (6·6) | 158·1 (6·5) |
| Number of years mother spent in school | 6·5 (4·1) | 6·6 (4·3) | 1·3 (1·6) | 1·2 (1·5) | 5·7 (4·5) | 5·8 (4·5) | 7·0 (3·3) | 6·9 (3·2) | 9·7 (2·5) | 9·6 (2·5) |
| Body-mass index >25 kg/m2 | 584/1882 (31·0%) | 437/1701 (25·7%) | 54/157 (34·4%) | 86/141 (61·0%) | 370/775 (47·7%) | 253/551 (45·9%) | 102/1004 (10·2%) | 68/883 (7·7%) | 54/573 (9·4%) | 162/630 (25·7%) |
| Elevated blood pressure† | 666/1884 (35·4%) | 224/1702 (13·2%) | 29/161 (18·0%) | 10/152 (6·6%) | 209/769 (27·2%) | 67/546 (12·3%) | 174/1004 (17·3%) | 20/885 (2·3%) | 118/555 (21·3%) | 60/617 (9·7%) |
| Dysglycaemia‡ | 148/1590 (9·3%) | 98/1503 (6·5%) | 4/114 (3·5%) | 5/133 (3·7%) | 161/762 (21·1%) | 75/540 (13·9%) | 8/870 (0·9%) | 7/709 (1·0%) | 4/358 (1·1%) | 1/367 (0·3%) |
| Short stature§ | 74/1883 (3·9%) | 57/1701 (3·4%) | 69/157 (43·9%) | 59/141 (41·8%) | 78/775 (10·1%) | 105/551 (19·1%) | 432/1004 (43·0%) | 374/888 (42·1%) | 41/573 (7·1%) | 36/631 (5·7%) |
| Did not complete secondary school | 952/1770 (53·8%) | 651/1619 (40·2%) | 154/168 (91·7%) | 144/154 (93·5%) | 114/775 (14·7%) | 42/553 (7·6%) | 370/1006 (36·8%) | 185/889 (20·8%) | 271/568 (47·7%) | 171/621 (27·5%) |
Data are mean (SD) or n/N (%). Participants had at least one adult outcome of interest and complete anthropometric data. NA=not available.
Female body composition not measured in Brazil because examination occurred at an army recruitment centre.
Systolic blood pressure ≥130 mm Hg or diastolic blood pressure ≥85 mm Hg.24
Plasma glucose concentration >6·1 mmol/L or taking drugs for diabetes.24
Height-for-age Z score <–2 when aged <19 years; or <150·1 cm for women or <161·9 cm for men if aged ≥19 years.
Higher birthweight and conditional relative weight at age 2 years and mid-childhood were consistently associated with higher adult BMI in men and women (figure 1, appendix p 5). The association between conditional relative weight and BMI strengthened with age at measurement: overall, BMI increased by 0·5 kg/m2 per SD increase in birthweight, by 1·0 kg/m2 at 2 years, and 1·3 kg/m2 in mid-childhood. Higher conditional height at 2 years and mid-childhood was also associated with higher adult BMI, but coefficients were smaller than were those for conditional relative weight and diminished with age (figure 1). The findings were similar for the binary outcome of obesity (table 2, appendix p 6). Heterogeneity between sexes and sites was primarily a result of size rather than direction of coefficients.
Figure 1.
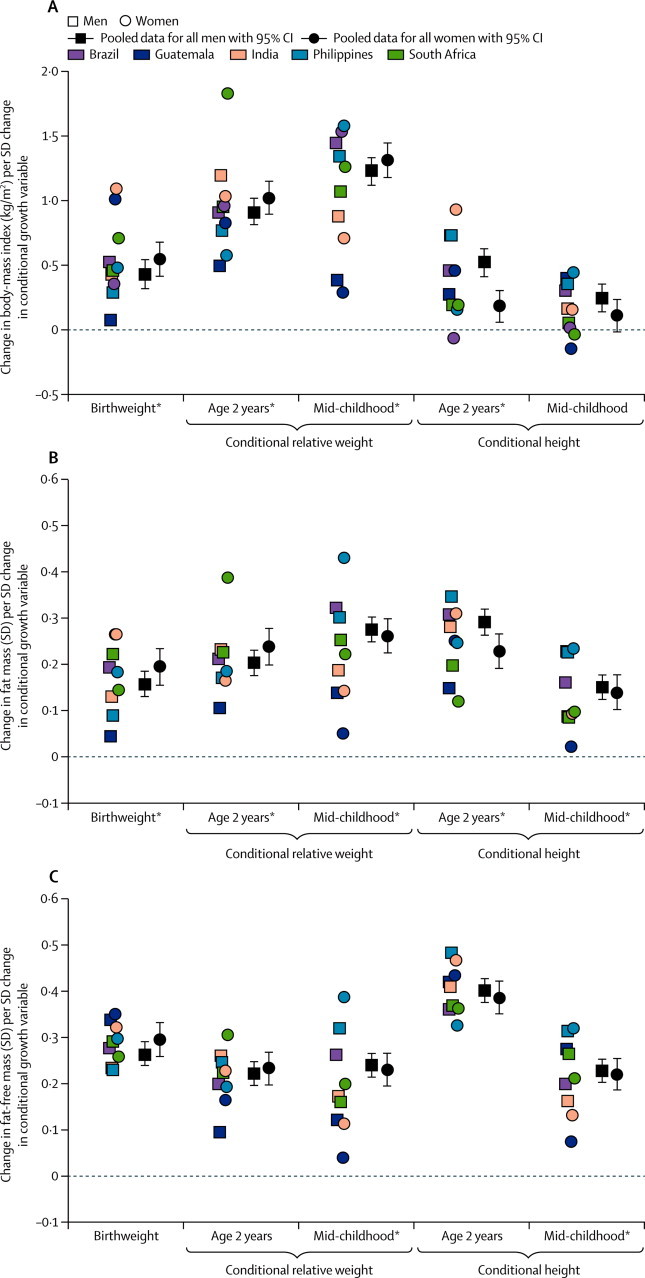
Association of birthweight, conditional relative weight and conditional height with (A) body-mass index, (B) fat mass, and (C) fat-free mass
Site-specific datapoints represent β coefficients from linear regression models done separately for each site and sex. *Significant heterogeneity between sexes and sites.
Table 2.
Association of birthweight, conditional relative weight gain, and conditional height with adverse outcomes
| Body-mass index >25 kg/m2 | Elevated blood pressure* | Dysglycaemia† | Short stature‡ | Did not complete secondary school | |
|---|---|---|---|---|---|
| Overall number affected | 2170/8297 (26·2%) | 1571/8233 (19·1%) | 511/6947 (7·4%) | 1325/8302 (16·0%) | 3054/8121 (37·6%) |
| Birthweight | 1·28 (1·21–1·35) | 0·93 (0·88–0·99) | 0·89 (0·81–0·98) | 0·49 (0·44–0·54) | 0·82 (0·78–0·87) |
| Conditional relative weight at age 2 years | 1·51 (1·43–1·60) | 1·07 (1·01–1·13) | 0·95 (0·86–1·04) | 0·94 (0·86–1·03) | 0·95 (0·90–0·99) |
| Conditional relative weight mid-childhood | 1·76 (1·66–1·86) | 1·22 (1·15–1·30) | 1·08 (0·98–1·18) | 1·13 (1·04–1·23) | 1·04 (0·99–1·10) |
| Conditional height at age 2 years | 1·24 (1·17–1·31) | 1·12 (1·06–1·19) | 0·98 (0·89–1·18) | 0·23 (0·20–0·25) | 0·74 (0·67–0·78) |
| Conditional height mid-childhood | 1·12 (1·06–1·18) | 1·07 (1·01–1·13) | 0·94 (0·86–1·03) | 0·39 (0·36–0·43) | 0·87 (0·83–0·92) |
Data are n/N (%) or odds ratio (95% CI). Odds ratios calculated with logistic regression models of the pooled sample and indicate how a difference of 1 SD in each measure affects the likelihood of the adverse outcome. All models were adjusted for adult age. The models for short stature and completion of secondary school were further adjusted for mother's education and household wealth at birth; the model for short stature was also adjusted for mother's height.
Systolic blood pressure ≥130 mm Hg or diastolic blood pressure ≥85 mm Hg.
Plasma glucose concentration ≥6·1 mmol/L or taking drugs for diabetes.
Height-for-age Z score <–2 when aged <19 years; <150·1 cm for women or <161·9 cm for men when aged ≥19 years.
All conditional relative weight and conditional height variables were associated with higher adult fat mass and fat-free mass (figure 1, appendix pp 7–8). Coefficients for birthweight and relative weight increased with the age at which size was measured, while conditional height coefficients decreased (figure 1). Birthweight and conditional relative weight at age 2 years were more strongly associated with fat-free mass than with fat mass, contrasting with stronger associations of conditional relative weight in mid-childhood with fat mass than with fat-free mass (appendix pp 7–8). Conditional height at age 2 years and mid-childhood were more strongly associated with fat-free mass than with fat mass, and both associations were stronger at 2 years than at mid-childhood. The findings for percentage body fat and waist circumference (appendix pp 9–10, 21–22) were similar to those for fat mass and BMI. Heterogeneity between sexes and sites was greater for fat mass than for fat-free mass.
Birthweight was unrelated to systolic blood pressure (figure 2, appendix p 11). Higher conditional relative weight at all ages was associated with higher systolic blood pressure, and the associations strengthened with increasing age at measurement (figure 2). Conditional height at age 2 years and mid-childhood was also positively related to systolic blood pressure (figure 2). The association between birthweight and systolic blood pressure was not the same in Guatemala as in other sites (figure 2, appendix p 11). The β coefficients for associations between conditional relative weight at mid-childhood and adulthood and conditional height at 2 years were larger in men than in women (appendix p 11). The findings were similar for diastolic blood pressure and elevated blood pressure (table 2, appendix pp 12–13, 23), except that higher birthweight was associated with a reduced likelihood of elevated blood pressure in adulthood (table 2).
Figure 2.
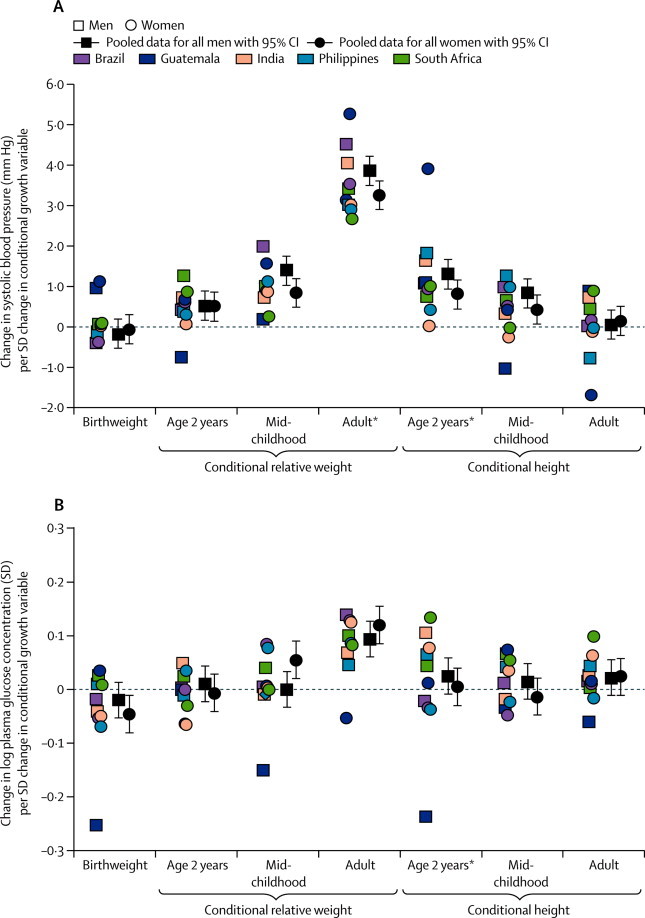
Association of birthweight, conditional relative weight, and conditional height with (A) systolic blood pressure and (B) log plasma glucose concentrations
Site-specific datapoints represent β coefficients from linear regression models done separately for each site and sex. *Significant heterogeneity between sexes and sites.
Conditional relative weight in adulthood and, in women only, in mid-childhood were associated with higher plasma glucose concentration in adulthood (figure 2, appendix p 14). Conditional relative weight at age 2 years was unrelated to glucose, and birthweight was inversely associated with plasma glucose concentration in women (figure 2, appendix p 14). Conditional height at any age was unrelated to adult plasma glucose concentration (figure 2, appendix p 14). The findings were similar for dysglycaemia (table 2, appendix p 15). Heterogeneity between sexes and sites was significant only for conditional height at age 2 years (appendix).
Each SD of birthweight predicted 1·5 cm higher adult height in the pooled sample (figure 3). Conditional relative weight at age 2 years was unrelated to adult height, but conditional relative weight at mid-childhood was inversely related (figure 3, appendix p 16). By contrast, increased conditional height at age 2 years and mid-childhood strongly predicted an increase in adult height in all sites (3·2 cm per SD increase in conditional height at age 2 years and 1·9 cm per SD mid-childhood; figure 3, appendix p 16). Heterogeneity was a result of site and sex differences in the size rather than direction of coefficients (coefficients in men more than coefficients in women). Birthweight and conditional height at age 2 years and mid-childhood were strongly inversely related to the chance of short adult stature (table 2, appendix p 17).
Figure 3.
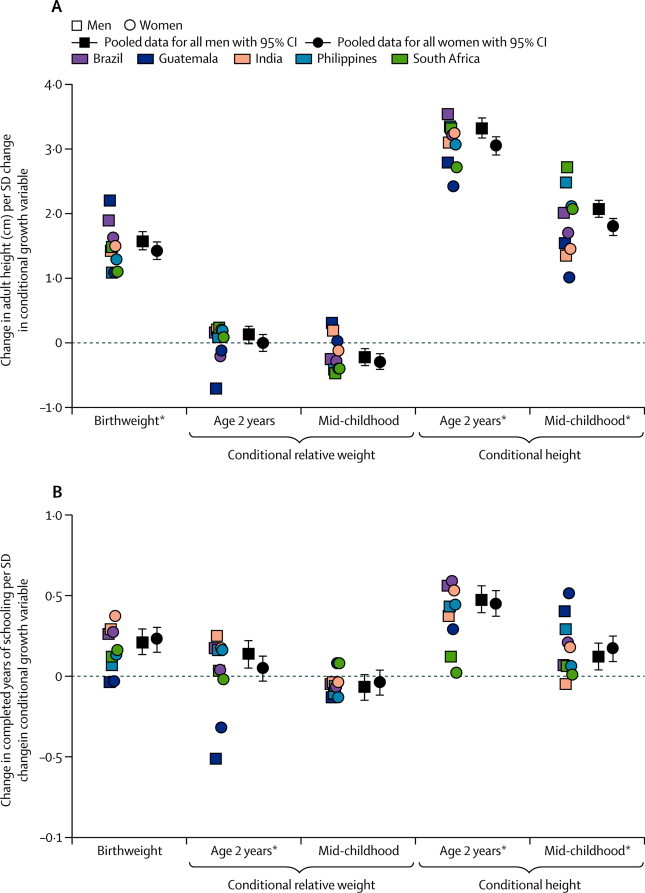
Association of birthweight, conditional relative weight, and conditional height with (A) adult height and (B) years spent at school
Site-specific datapoints represent β coefficients from linear regression models done separately for each site and sex. *Significant heterogeneity between sexes and sites.
One SD higher birthweight predicted about 0·2 years more schooling (figure 3, appendix p 18). One SD higher conditional relative weight at 2 years was associated with 0·14 years more schooling in men, but there was no association in women. Conditional relative weight at mid-childhood was unrelated to attained schooling (figure 3). In Guatemala, conditional relative weight at 2 years was inversely related to attained schooling in both sexes (appendix p 19); by contrast, higher conditional height at 2 years was strongly related to higher attained schooling (except in South Africa), with one SD in conditional height at 2 years relating to a half year increase in the pooled sample (figure 3). Lower birthweight and conditional height at age 2 years were associated with increased odds of failing to complete high school (table 2, appendix p 19). Overall, heterogeneity reflected differences between sites rather than between sexes.
Estimations produced by Heckman selection models did not produce coefficients that were substantially different from those estimated with standard linear and logistic regression models.
Discussion
We have shown that higher birthweight is related to increased liklihood of adult overweight in five populations in countries of low and middle income, but to lower likelihood of other adverse outcomes. Although higher conditional relative weight at age 2 years was associated with higher risk of adult overweight and a slightly increased risk of elevated blood pressure, it was unrelated to dysglycaemia, adult stature, or educational attainment. By contrast, conditional relative weight in mid-childhood was associated with higher likelihood of adult overweight and elevated blood pressure, but was unrelated to schooling. Although associated with slightly increased likelihood of adult overweight (mostly related to lean mass) and elevated blood pressure, higher conditional heights at age 2 years and at mid-childhood were related to lower risk of short stature and poor educational attainment.
Few studies from low-income and middle-income settings have followed up cohorts to adulthood. Individuals in the cohorts that we studied were born when poor early life nutrition was more common than it is now, which is shown by the high prevalence of stunting during infancy.30 However, the individuals grew up in rapidly changing environments that fostered development of obesity and chronic disease risk. Countries that are challenged by the dual burden of persistent undernutrition and emerging obesity need information about the many effects of early child growth, particularly during the important first 1000 days. Although the studies included in our analysis cannot be fully representative of the countries in which they were done, the many similarities of results across settings suggest that results may be generalised to other low-income and middle-income settings.
Another strength of our study is that we were able to separate linear growth from relative weight gain. Weight gain is a result of linear growth and soft tissue gain (fat mass and fat-free mass); our conditional relative weight variables represent weight change that is separated from change in height. Conditional relative weight and conditional height variables are uncorrelated, and we expressed them in SD units to allow direct comparison of coefficients within regression models. Our variables therefore have advantages when compared with other representations of growth, and give more nuanced results than do those that are based on weight gain alone. In our study, one SD in conditional relative weight at 2 years corresponds to change in weight-for-age Z score from birth to 2 years that is slightly less than the 0·67 units typically used to define rapid weight gain.5 In a previous COHORTS report,11 one SD of conditional weight at age 2 years related to 0·4 years more schooling. Here, we showed that attained schooling was predominantly associated with conditional height in the first 2 years, and an increase in conditional relative weight in this period contributed to a rise of only 0·09 years of schooling. These findings are important, because an extra half year of schooling is associated with a 5% annual return to income.11
Each estimate for conditional relative weight or conditional height represents an independent age-specific association. We noted that associations of conditional relative weight with adult adiposity and cardiometabolic risk factors strengthened substantially with age. Thus, the most important period for adverse associations of higher relative weight gain with adult cardiometabolic risk was after the age of 2 years. This finding is consistent with the ALSPAC study31 in the UK, which also showed that associations of conditional weight for length after infancy with systolic blood pressure and BMI were strongest at age 10 years, and with previous studies32–34 that showed increased risks related to fast weight gain after infancy. By contrast, for cardiometabolic risk factors, conditional height coefficients were smaller than conditional relative weight coefficients and decreased with age, which is consistent with a Brazilian study.35
In view of the nature of conditional growth variables, we could assess independent associations of birthweight with subsequent outcomes, without concern about statistical issues such as the reversal paradox.36 Furthermore, in our analysis, gestational age was not a confounder of the relation between conditional variables and adult outcomes. A separate analysis of COHORTS data (unpublished) established that a premature birth or being small for gestational age were related to persistent deficits in adult height and schooling, but did not affect blood pressure or plasma glucose concentrations.
We addressed potential trade-offs of different early growth patterns by comparing human capital outcomes known to be associated with impaired child growth and development with cardiometabolic disease risk factors. Birthweight and faster conditional relative weight in the first 2 years of life had little relation with adult cardiometabolic risk factors, but were important for fat-free mass. Indeed, early weight gain was more strongly associated with adult fat-free mass than with adult fat mass. This finding could explain the negative associations of birthweight and the small or non-significant associations of early relative weight gain with elevated blood pressure and dysglycaemia. Faster mid-childhood relative weight gain was more strongly associated with fat mass than fat-free mass, and increased risk of elevated blood pressure and dysglycaemia. The positive associations of all growth variables at all ages with adult BMI and risk of overweight and obesity are probably a result of their joint effect on fat mass and fat-free mass, and the fact that overweight adults have highly variable amounts of body fat.
Despite being restricted to participants with complete data, the sample that we analysed differed little from individuals who were excluded, and estimates produced with Heckman selection models were not different from models estimated with conventional methods. Therefore, our estimated coefficients do not seem to have been biased by attrition or missing data. Some differences between our cohorts were unavoidable, such as methods for measurement of birthweight, plasma glucose concentration, blood pressure, and adult body composition, and also age at mid-childhood and adulthood. Our choice of age intervals was determined by the availability of measurements in each cohort rather than what we might have chosen for the greatest biological signal, such as within the first 2 years.
Heterogeneity, as represented by significant site or sex interactions, or both, with key exposures, could be a result of the differences between cohorts or true effect modification. Although data for 48 months were not available in the Philippines, mid-childhood estimates did not differ systematically from other sites. Although our cohorts differed in childhood size and adult cardiometabolic risk profile, significant site and sex heterogeneity mostly reflected differences in size of associations, not direction. Therefore, use of pooled analyses to draw conclusions seems to be justified. Outliers were usually from Guatemala (which provided the smallest sample) or South Africa (the youngest). For example, the unique absence of an association between early height gain and schooling in South Africa is probably because participants aged 18 years had no opportunity for education after secondary school. Additionally, the absence of significant predictors of glucose concentration in South Africa is probably a result of the cohort's young age and little variation in glucose concentration (few concentrations were >6 mmol/L).
Our findings suggest that interventions to increase birthweight and linear growth during the first 2 years of life are likely to result in substantial gains in height and schooling (key aspects of human capital), and give some protection from development of adult chronic disease risk factors, with no or negligible adverse trade-offs. Consistent with a growing body of research, our results indicate that faster relative weight gain after the age of 2 years has little benefit for human capital, and weight gain after mid-childhood could lead to large adverse effects on later cardiovascular risk factors. Notably, this finding is particularly true for weight gain that is not accompanied by height gain. Our data support the present focus on promotion of improved nutrition and linear growth in the first 1000 days of life, and also reinforce the importance of prevention of rapid relative weight gain after age 2 years.
Although the associations we describe do not prove causation, our results challenge several programmes in countries of low and middle income (panel). Rapid weight gain should not be promoted after the age of 2–3 years in children who are underweight but not wasted. Growth monitoring programmes should incorporate length and height measures, not just weight measures. New interventions that specifically promote linear growth instead of weight gain should be developed, tested, and promoted; exclusive breastfeeding, high-quality protein (eg, animal), and micronutrients could be further investigated.37 Traditional school feeding programmes that increase BMI with little effect on height38 might be doing more harm than good in terms of future health.
Panel. Research in context.
Systematic review
A 2008 systematic review30 examined how birthweight and weight-for-age and length-for-age Z scores at age 2 years related to adult human capital and chronic disease risk. Therefore, we searched PubMed for reports published in any language since Jan 1, 2009, which related birthweight and childhood growth rates to these same adult outcomes. We focused on studies that attempted to assess both weight gain and linear growth at different ages, and that involved appropriate statistical methods to differentiate their effects on subsequent outcomes. Our search terms were “weight gain”, “linear growth”, “rapid weight gain”, “birth cohorts”, and “prospective studies”. Few identified studies were done in low-income and middle-income countries, and few used the statistical methods needed to model correlated life course data. Although many reports associate rapid weight gain with obesity and related outcomes, we identified only two31,35 that directly compared how linear growth and relative weight gain related to adult blood pressure, glucose metabolism, body composition, height, or schooling. No reports directly compared several outcomes representing health and human capital to enable assessment of risks and benefits of early growth patterns.
Interpretation
We have studied life course determinants of young adult human capital and disease risk factors in five countries of low and middle income, by using appropriate statistical methods to directly compare how faster relative weight gain and faster linear growth relate to these outcomes. We have shown that effects on the different outcomes are age specific. Fast linear growth in the first 2 years of life is associated with increased adult height and amount of schooling. Adverse associations with fast relative weight gain are largely confined to mid-childhood and adulthood. Our data support the current focus on promotion of nutrition and linear growth in the first 1000 days of life (from conception to age 2 years), and also reinforce the importance of prevention of rapid relative weight gain after age 2 years. These findings have implications for present practices in low-income and middle-income countries, particularly emphasising the need to monitor linear growth as well as weight, and to avoid promotion of excess weight gain in children older than 2 years. Optimum growth patterns in early life are likely to lead to less undernutrition, increased human capital, and reduced risks of obesity and non-communicable diseases, thus addressing both components of the double burden of nutrition.
Mortality and undernutrition are falling substantially in most parts of the world, except for Sub-Saharan Africa, and new targets are being formulated to replace the present set of 2015 Millennium Development Goals.39 Our analyses provide strong justification for the proposal of a new goal for optimum linear growth that is expressed as a reduction in stunting. This goal should replace the present target of a reduction in underweight alone, which is one of the indicators for the first Millennium Development Goals towards the eradication of extreme poverty. Whereas promotion of linear growth in early life could build human capital in adults without increasing the burden of non-communicable diseases, the present focus on underweight might have detrimental repercussions, particularly if interventions take place after 1000 days.
Acknowledgments
Acknowledgments
The COHORTS collaboration is funded by the Wellcome Trust (089257/Z/09/Z). Additional funding for data analysis for this study was provided by the Bill & Melinda Gates Foundation (OPP1020058). The cohort studies in Guatemala and the Philippines were funded by the US National Institutes of Health; that in Brazil by the Wellcome Trust; that in India by the Indian Council of Medical Research, US National Center for Health Statistics, UK Medical Research Council, and British Heart Foundation; and that in South Africa by the Wellcome Trust, Human Sciences Research Council, South African Medical Research Council, South-African Netherlands Programme on Alternative Development, Anglo American Chairman's Fund, and University of the Witwatersrand in South Africa. We thank Jane Pearce for producing graphs and formatting tables.
Contributors
LSA, CHDF, and CO led the writing team. LSA and CO did data analysis. LSA and CHDF wrote the report and had final responsibility for the content. All authors contributed to data collection, and reviewed and commented on the report and approved its final content.
COHORTS group members
Universidade Federal de Pelotas, Brazil: Cesar G Victora, Fernando C Barros, Denise Gigante, Pedro C Hallal, Bernardo L Horta; Hubert Department of Global Health, Emory University, USA: Reynaldo Martorell, Aryeh Stein, Yaw Addo, Wei Hao; Instituto de Nutrición de Centra América y Panamá, Guatemala: Manual Ramirez-Zea; Sunderlal Jain Hospital, India: Santosh K Bhargava; Sitaram Bhartia Institute of Science and Research, India: Harshpal Singh Sachdev; MRC Lifecourse Epidemiology Unit, UK: Caroline Fall, Clive Osmond; University of North Carolina at Chapel Hill, USA: Linda Adair; Office of Population Studies, University of San Carlos, Philippines: Isabelita Bas, Nanette Lee, Judith Borja; University of Leeds, UK: Darren Dahly; Northwestern University, USA: Christopher Kuzawa; Developmental Pathways for Health Research Unit, University of the Witwatersrand, South Africa: Linda Richter, Shane Norris, Julia De Kadt.
Conflicts of interest
We declare that we have no conflicts of interest.
Supplementary Material
References
- 1.Stettler N, Iotova V. Early growth patterns and long-term obesity risk. Curr Opin Clin Nutr Metab Care. 2010;13:294–299. doi: 10.1097/MCO.0b013e328337d7b9. [DOI] [PubMed] [Google Scholar]
- 2.Demerath EW, Reed D, Choh AC. Rapid postnatal weight gain and visceral adiposity in adulthood: the Fels Longitudinal Study. Obesity (Silver Spring) 2009;17:2060–2066. doi: 10.1038/oby.2009.105. [DOI] [PMC free article] [PubMed] [Google Scholar]
- 3.Leunissen RW, Stijnen T, Hokken-Koelega AC. Influence of birth size on body composition in early adulthood: the programming factors for growth and metabolism (PROGRAM)-study. Clin Endocrinol (Oxf) 2009;70:245–251. doi: 10.1111/j.1365-2265.2008.03320.x. [DOI] [PubMed] [Google Scholar]
- 4.Dulloo AG. Thrifty energy metabolism in catch-up growth trajectories to insulin and leptin resistance. Best Pract Res Clin Endocrinol Metab. 2008;22:155–171. doi: 10.1016/j.beem.2007.08.001. [DOI] [PubMed] [Google Scholar]
- 5.Ong KK. Catch-up growth in small for gestational age babies: good or bad? Curr Opin Endocrinol Diabetes Obes. 2007;14:30–34. doi: 10.1097/MED.0b013e328013da6c. [DOI] [PubMed] [Google Scholar]
- 6.Hales CN, Ozanne SE. The dangerous road of catch-up growth. J Physiol. 2003;547:5–10. doi: 10.1113/jphysiol.2002.024406. [DOI] [PMC free article] [PubMed] [Google Scholar]
- 7.Victora CG, Barros FC, Horta BL, Martorell R. Short-term benefits of catch-up growth for small-for-gestational-age infants. Int J Epidemiol. 2001;30:1325–1330. doi: 10.1093/ije/30.6.1325. [DOI] [PubMed] [Google Scholar]
- 8.Stein AD, Wang M, Martorell R. Growth patterns in early childhood and final attained stature: data from five birth cohorts from low- and middle-income countries. Am J Hum Biol. 2010;22:353–359. doi: 10.1002/ajhb.20998. [DOI] [PMC free article] [PubMed] [Google Scholar]
- 9.Kuzawa CW, Hallal PC, Adair L. Birth weight, postnatal weight gain, and adult body composition in five low and middle income countries. Am J Hum Biol. 2012;24:5–13. doi: 10.1002/ajhb.21227. [DOI] [PMC free article] [PubMed] [Google Scholar]
- 10.Sachdev HS, Fall CH, Osmond C. Anthropometric indicators of body composition in young adults: relation to size at birth and serial measurements of body mass index in childhood in the New Delhi birth cohort. Am J Clin Nutr. 2005;82:456–466. doi: 10.1093/ajcn.82.2.456. [DOI] [PubMed] [Google Scholar]
- 11.Martorell R, Horta BL, Adair LS. Weight gain in the first two years of life is an important predictor of schooling outcomes in pooled analyses from five birth cohorts from low- and middle-income countries. J Nutr. 2010;140:348–354. doi: 10.3945/jn.109.112300. [DOI] [PMC free article] [PubMed] [Google Scholar]
- 12.Carba DB, Tan VL, Adair LS. Early childhood length-for-age is associated with the work status of Filipino young adults. Econ Hum Biol. 2009;7:7–17. doi: 10.1016/j.ehb.2009.01.010. [DOI] [PMC free article] [PubMed] [Google Scholar]
- 13.Thomas D, Frankenberg E. Health, nutrition and prosperity: a microeconomic perspective. Bull World Health Organ. 2002;80:106–113. [PMC free article] [PubMed] [Google Scholar]
- 14.Hoddinott J, Maluccio JA, Behrman JR, Flores R, Martorell R. Effect of a nutrition intervention during early childhood on economic productivity in Guatemalan adults. Lancet. 2008;371:411–416. doi: 10.1016/S0140-6736(08)60205-6. [DOI] [PubMed] [Google Scholar]
- 15.Richter LM, Victora CG, Hallal PC. Cohort profile: the Consortium of Health-Orientated Research in Transitioning Societies. Int J Epidemiol. 2012;41:621–626. doi: 10.1093/ije/dyq251. [DOI] [PMC free article] [PubMed] [Google Scholar]
- 16.Victora CG, Barros FC. Cohort profile: the 1982 Pelotas (Brazil) birth cohort study. Int J Epidemiol. 2006;35:237–242. doi: 10.1093/ije/dyi290. [DOI] [PubMed] [Google Scholar]
- 17.Stein AD, Melgar P, Hoddinott J, Martorell R. Cohort profile: the Institute of Nutrition of Central America and Panama (INCAP) Nutrition Trial Cohort Study. Int J Epidemiol. 2008;37:716–720. doi: 10.1093/ije/dyn028. [DOI] [PMC free article] [PubMed] [Google Scholar]
- 18.Adair LS, Popkin BM, Akin JS. Cohort profile: the Cebu longitudinal health and nutrition survey. Int J Epidemiol. 2011;40:619–625. doi: 10.1093/ije/dyq085. [DOI] [PMC free article] [PubMed] [Google Scholar]
- 19.Richter L, Norris S, Pettifor J, Yach D, Cameron N. Cohort profile: Mandela's children: the 1990 Birth to Twenty study in South Africa. Int J Epidemiol. 2007;36:504–511. doi: 10.1093/ije/dym016. [DOI] [PMC free article] [PubMed] [Google Scholar]
- 20.Keijzer-Veen MG, Euser AM, van Montfoort N, Dekker FW, Vandenbroucke JP, Van Houwelingen HC. A regression model with unexplained residuals was preferred in the analysis of the fetal origins of adult diseases hypothesis. J Clin Epidemiol. 2005;58:1320–1324. doi: 10.1016/j.jclinepi.2005.04.004. [DOI] [PubMed] [Google Scholar]
- 21.Li H, Stein AD, Barnhart HX, Ramakrishnan U, Martorell R. Associations between prenatal and postnatal growth and adult body size and composition. Am J Clin Nutr. 2003;77:1498–1505. doi: 10.1093/ajcn/77.6.1498. [DOI] [PubMed] [Google Scholar]
- 22.Cole TJ, Bellizzi MC, Flegal KM, Dietz WH. Establishing a standard definition for child overweight and obesity worldwide: international survey. BMJ. 2000;320:1240–1243. doi: 10.1136/bmj.320.7244.1240. [DOI] [PMC free article] [PubMed] [Google Scholar]
- 23.WHO Child Growth Standards based on length/height, weight and age. Acta Paediatr Suppl. 2006;450:76–85. doi: 10.1111/j.1651-2227.2006.tb02378.x. [DOI] [PubMed] [Google Scholar]
- 24.International Diabetes Federation . The IDF consensus worldwide definition of the metabolic syndrome. International Diabetes Federation; Brussels: 2006. [Google Scholar]
- 25.Norris SA, Osmond C, Gigante D. Size at birth, weight gain in infancy and childhood, and adult diabetes risk in five low- or middle-income country birth cohorts. Diabetes Care. 2012;35:72–79. doi: 10.2337/dc11-0456. [DOI] [PMC free article] [PubMed] [Google Scholar]
- 26.Kumar G, Sng BL, Kumar S. Correlation of capillary and venous blood glucometry with laboratory determination. Prehosp Emerg Care. 2004;8:378–383. doi: 10.1016/j.prehos.2004.06.010. [DOI] [PubMed] [Google Scholar]
- 27.Petersen JR, Graves DF, Tacker DH, Okorodudu AO, Mohammad AA, Cardenas VJ., Jr Comparison of POCT and central laboratory blood glucose results using arterial, capillary, and venous samples from MICU patients on a tight glycemic protocol. Clin Chim Acta. 2008;396:10–13. doi: 10.1016/j.cca.2008.06.010. [DOI] [PubMed] [Google Scholar]
- 28.WHO . Definition, diagnosis and classification of diabetes mellitus and its complications: report of a WHO Consultation, part 1: diagnosis and classification of diabetes mellitus. World Health Organization; Geneva: 1999. [Google Scholar]
- 29.Heckman J. Sample selection bias as a specification error. Econometrica. 1979;47:153–161. [Google Scholar]
- 30.Victora CG, Adair L, Fall C. Maternal and child undernutrition: consequences for adult health and human capital. Lancet. 2008;371:340–357. doi: 10.1016/S0140-6736(07)61692-4. [DOI] [PMC free article] [PubMed] [Google Scholar]
- 31.Jones A, Charakida M, Falaschetti E. Adipose and height growth through childhood and blood pressure status in a large prospective cohort study. Hypertension. 2012;59:919–925. doi: 10.1161/HYPERTENSIONAHA.111.187716. [DOI] [PMC free article] [PubMed] [Google Scholar]
- 32.Law CM, Shiell AW, Newsome CA. Fetal, infant, and childhood growth and adult blood pressure: a longitudinal study from birth to 22 years of age. Circulation. 2002;105:1088–1092. doi: 10.1161/hc0902.104677. [DOI] [PubMed] [Google Scholar]
- 33.Eriksson JG, Forsen TJ, Kajantie E, Osmond C, Barker DJ. Childhood growth and hypertension in later life. Hypertension. 2007;49:1415–1421. doi: 10.1161/HYPERTENSIONAHA.106.085597. [DOI] [PubMed] [Google Scholar]
- 34.Eriksson JG, Osmond C, Kajantie E, Forsen TJ, Barker DJ. Patterns of growth among children who later develop type 2 diabetes or its risk factors. Diabetologia. 2006;49:2853–2858. doi: 10.1007/s00125-006-0459-1. [DOI] [PubMed] [Google Scholar]
- 35.Menezes AM, Hallal PC, Dumith SC. Adolescent blood pressure, body mass index and skin folds: sorting out the effects of early weight and length gains. J Epidemiol Community Health. 2012;66:149–154. doi: 10.1136/jech.2010.124842. [DOI] [PMC free article] [PubMed] [Google Scholar]
- 36.Tu YK, Ellison GT, Gilthorpe MS. Growth, current size and the role of the ‘reversal paradox’ in the foetal origins of adult disease: an illustration using vector geometry. Epidemiol Perspect Innov. 2006;3:9. doi: 10.1186/1742-5573-3-9. [DOI] [PMC free article] [PubMed] [Google Scholar]
- 37.Roberfroid D, Huybregts L, Lanou H. Impact of prenatal multiple micronutrients on survival and growth during infancy: a randomized controlled trial. Am J Clin Nutr. 2012;95:916–924. doi: 10.3945/ajcn.111.029033. [DOI] [PubMed] [Google Scholar]
- 38.Bhutta ZA, Ahmed T, Black RE. What works? Interventions for maternal and child undernutrition and survival. Lancet. 2008;371:417–440. doi: 10.1016/S0140-6736(07)61693-6. [DOI] [PubMed] [Google Scholar]
- 39.WHO . Countdown to 2015: building a future for women and children: the 2012 Report. WHO and UNICEF; Washington DC: 2012. [Google Scholar]
Associated Data
This section collects any data citations, data availability statements, or supplementary materials included in this article.