Abstract
Zeolites have potential application as ion-exchangers, catalysts and molecular sieves. Zeolites are once again drawing attention in Japan as stable adsorbents and solidification materials of fission products, such as 137Cs+ from damaged nuclear-power plants. Although there is a long history of scientific studies on the crystal structures and ion-exchange properties of zeolites for practical application, there are still open questions, at the atomic-level, on the physical and chemical origins of selective ion-exchange abilities of different cations and detailed atomic structures of exchanged cations inside the nanoscale cavities of zeolites. Here, the precise locations of Cs+ ions captured within A-type zeolite were analyzed using high-resolution electron microscopy. Together with theoretical calculations, the stable positions of absorbed Cs+ ions in the nanocavities are identified, and the bonding environment within the zeolitic framework is revealed to be a key factor that influences the locations of absorbed cations.
Zeolites are composed of aluminoslicate frameworks that provide regularly arranged nanocavities or nanochannels. While zeolitic frameworks are assembled with covalent bonds, they also have ionic sites as components of [AlO4]−. The inclusion of negatively charged [AlO4]− tetrahedra requires counter cations such as Na+ or H+ to satisfy the charge neutrality of the system. Counter cations are generally involved not in the framework, but inside the nanocavities. Such counter cations inside the nanocavities can be easily substituted by various cations, even at low temperatures, leading to zeolites with distinct ion-exchange ability and cation-specific selectivity, which is advantageous for the efficient removal of fission products from high-level harmful nuclear waste1,2,3. Application to the management of radioactive waste leaks, such as 137Cs, has especially attracted attention after the earthquake disaster in 20114. However, the ion-exchange behavior of counter cations within the zeolitic framework has been poorly understood, especially at the atomic scale. It is considered that the cationic species that absorb into the nanocavities of zeolite are dependent on the size and shape of the zeolitic framework, as well as the size and chemistry of the ionic species. To clarify this issue, precise atomic-level information of the local structures of absorbed cations in the zeolitic framework is required, but has not yet been successfully obtained due to the scientific and technical reasons discussed below.
There have been a large number of X-ray and/or neutron diffraction investigations performed on different kinds of zeolites with different ion-exchanged cations, often combined with Rietveld analyses5,6,7 to determine where absorbed cations are located in the zeolitic frameworks or nanocavities. Such diffractometric analyses can provide statistically averaged atomic structures, but can do not provide direct information on the non-periodic local structures. Non-framework species within zeolites do not necessarily have periodic structure; therefore, microscopic methods could be effective for such analyses. High-resolution transmission electron microscopy (HRTEM) has proven to be a powerful technique for nanostructural analyses in real-space8,9,10. However, the application of this method to electron sensitive zeolites is severely restricted due to electron irradiation damage of the specimen11. In addition, the crystal structures of zeolites are very complex, so that their projected potential is not simple, even for a low-indexed zone axis. To precisely determine cation site locations requires a microscope with much higher resolution. Recent improvements in electron optics have enabled to correction of the spherical aberration (C3) of magnetic lenses12. While aberration-corrected HRTEM (AC-HRTEM) imaging has provided significant improvement in spatial resolution, it has also caused a decline of the phase contrast, especially in the low spatial frequency region13. The degradation of image contrast prohibits the imaging of electron-sensitive zeolite with large periodic structure, because more electron irradiation is required to improve the poor contrast of the HRTEM image. Therefore, to achieve AC-HRTEM imaging of zeolitic frameworks, it is necessary to select optimum electron microscope imaging conditions to minimize electron irradiation damage to the specimen. In contrast to the HRTEM mode, high-angle annular dark-field (HAADF) scanning transmission electron microscopy (STEM) imaging has significant advantage in quantitative image contrast; however, intense electron probing for zeolite observations is destructive. Direct imaging with HAADF-STEM of Ag cations captured in a zeolitic framework has already been reported14. However, the detailed structure of the zeolitic framework could not be visualized in that work due to the extremely low image contrast. The locations of metal ions relative to the zeolitic framework are thus somewhat ambiguous. In this study, the precise mechanism for Cs+ exchange within NaA zeolite was examined using high-resolution electron microscopy and theoretical calculations. Direct imaging of Cs+ cations captured in zeolites is still a challenge because the Cs+ ions are not firmly anchored to the zeolitic framework and their atomic number is not so large. Ab initio density functional theory calculations were also performed to determine the atomic-level structure of Cs+ in the zeolitic framework observed using HRTEM and STEM techniques.
Results
Ion-exchange of caesium within NaA zeolite
Cs+ exchanged zeolite was prepared by soaking small crystallite NaA zeolite powder in 7.5 mmol/L of CsCl aqueous stock solution at room temperature. The cation-exchange between Cs+ and Na+ was performed for 12 h; however, some of the Na+ ions included in zeolite did not exchange. The results of energy dispersive X-ray spectrometry (EDS) indicate that the atomic ratio of captured Cs+ and remaining Na+ within the zeolite was approximately 1 to 3 (Supplementary Fig. S1). Figure 1 shows the known crystal structure of NaA5. There are three types of Na+ sites within NaA, which has two types of cages. Sites at the center of single six-membered ring (S6R) and single eight-membered ring (S8R) are denoted Na1 and Na2 respectively, although the Na2 site is slightly shifted from the center of S8R and forms four symmetrically equivalent positions that have ca. 25% occupancy; a Na+ cation at a Na2 site exists in either of the four positions in a S8R. Another extra site of Na3 is located at the inside of the α-cage, but the occupancy of Na+ at this site is relatively low (6.6%).
Figure 1. Crystal structure of NaA zeolite.
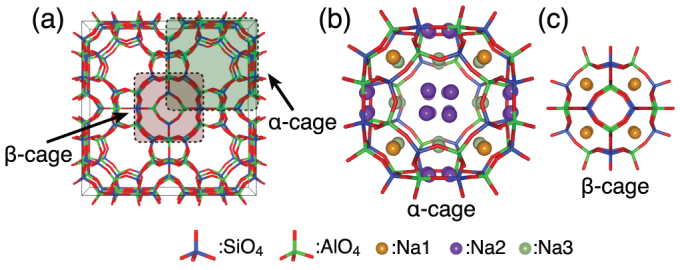
(a) [100]-projection of NaA zeolite structure. (b) Schematic model of α-cage. (c) Schematic model of β-cage.
High-angle annular-dark field scanning transmission electron microscopy (HAADF-STEM)
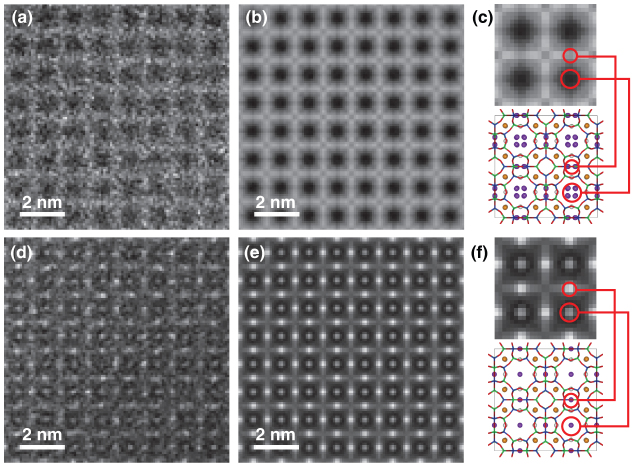
To minimize unnecessary electron irradiations, very fast and coarse scanning conditions, the pixel dwell time and a pixel size are 10 μs per pixel and 0.04 nm2, respectively, was applied during objective lens focusing. When starting the HAADF-STEM image capture, the scanning condition was switched from focus mode to capture mode with a dwell time of 32 μs per pixel and a pixel size of 0.01 nm2 (Nyquist spatial frequency of captured image is 5 nm−1). Figures 2(a) and (d) show raw experimental HAADF-STEM images of NaA and Cs+-exchanged NaA, respectively. Both images were taken with first one slow-scan because the samples were already damaged after this first scan. The raw HAADF-STEM images contained much noise due to severely restricted electron dose. To visualize the detailed structure, a Bragg filter based on a fast Fourier transform (FFT) was applied to the HAADF-STEM images and the results are shown in Figs. 2(b) and (e). Although the signal-to-noise ratios of the raw HAADF-STEM images were very low, highest order spots appeared in the FFT patterns, which guaranteed that each HAADF-STEM images had detected information of sufficiently high spatial frequency (see Fig. S2). Only the bright contrast corresponding to zeolitic framework is observed in the HAADF-STEM image of NaA, as shown in Fig. 2(c). On the other hand, in addition to the contrast of the zeolitic framework, extra bright spots were observed in the image of Cs+-exchanged zeolite, as shown in Fig. 2(f). It should be noted that there are two types of bright spots; those at the center of the zeolitic framework and those on the zeolitic framework. Considering the atomic structure of the zeolitic framework, these bright spots correspond to Cs+ captured at Na2 sites. The atomic number of Cs is large compared with those of atoms in the aluminosilicate framework; therefore, Cs+ column sites are observed as much brighter contrast than the framework. However, no bright contrast was observed at Na1 and Na3 sites in the image of Cs+-exchanged NaA, in contrast to that previously reported for Ag+ within zeolite A14. Although all Na+ cations can be exchanged with Cs+ cations under extreme conditions where there is reductive Cs(0) gas15,16, Na+ cations remained at Na1 sites under the present conditions. The results of HAADF-STEM observations indicate that Cs+ cations were exchanged with only Na+ cations at Na2 sites. Furthermore, Cs+ cations appear to be located closer to the center of S8R, while Na+ cations in NaA are slightly shifted from the center of S8R with a partial occupancy of 25%. In contrast to Cs+ cations, Na+ cations located at Na2 were not visualized in the HAADF-STEM image, as shown in Fig. 3(c). The projected atomic density of Na at Na2 sites is much lower than those of zeolitic frameworks and Na is a comparatively light element; therefore, the image contrast for Na+ cations at Na2 sites could not be detected in the HAADF-STEM image. The experimental HAADF-STEM images are in good agreement with images simulated from the model structure (see Figs. S4 and S5).
Figure 2. Experimental AC-HAADF-STEM images.
(a) Raw HAADF STEM image of NaA. (b) Filtered HAADF STEM image of NaA. (c) Extracted image of NaA and corresponding structure model. (d) Raw HAADF STEM image of Cs-exchanged NaA. (e) Filtered HAADF STEM image of Cs-exchanged NaA. (f) Extracted image of Cs-exchanged NaA and corresponding structure model.
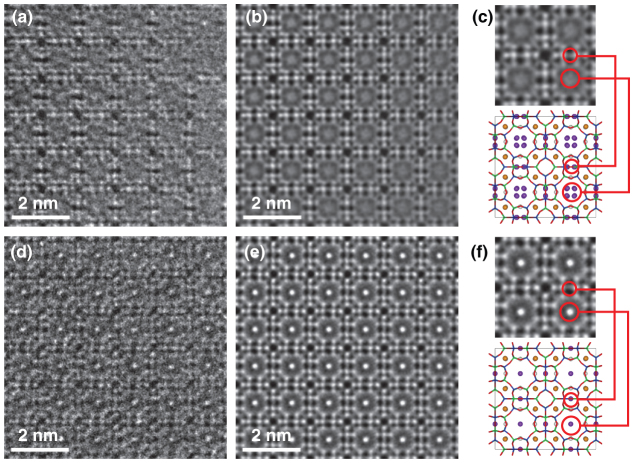
Figure 3. Experimental HRTEM images.
(a) AC-HRTEM image of NaA. (b) Filtered HRTEM image of NaA. (c) Extracted image of NaA and corresponding structure model. (d) Raw HRTEM image of Cs-exchanged NaA. (e) Filtered HRTEM image of Cs-exchanged NaA. (f) Extracted image of Cs-exchanged NaA and corresponding structure model.
Aberration corrected high resolution transmission electron microscopy (AC-HRTEM)
AC-HRTEM observations were performed to precisely evaluate the locations of Cs+ cations captured at Na2 sites. Negative spherical aberration imaging (NCSI) conditions17,18,19,20 were applied for AC-HRTEM observations. In the NCSI mode, the combination of negative spherical aberration and suitable over-focus conditions causes bright and sharper atomic contrast from additional combination of phase and amplitude contrast20,21, which is favorable for the structural analysis of complex zeolitic frameworks22. However, in contrast to the HAADF-STEM observation, AC-HRTEM imaging is very sensitive to dynamical scattering of the electron beam. Therefore, all AC-HRTEM images were acquired from a very thin sample area, such as a wedge-shaped edge. Figures 3(a) and (d) show experimental AC-HRTEM images for NaA and Cs+-exchanged NaA, respectively. To minimize electron irradiation damage, all AC-HRTEM observations were conducted with a minimum-dose-system23. The raw AC-HRTEM images still contained much noise, as did the HAADF-STEM images; therefore, the raw images were also processed with the Bragg filters and the results are shown in Figs. 3(b) and (e) (see also Fig. S3). The detailed structures of the zeolitic frameworks were clearly visualized in the processed AC-HRTEM images, in contrast to that observed in the HAADF-STEM images. Although Na+ cations at the Na2 sites were still not clearly imaged, Cs+ cations at the Na2 sites were visualized as sharp bright contrasts at the center of S8R. Figure 4 shows AC-HRTEM images of partially Cs+-exchanged NaA simulated from three structural models with various Na2 sites. Comparison of the simulated images with the experimental image indicates that the Cs+ cations captured at Na2 sites are located exactly at the S8R center. On the other hand, the image contrast of Cs+ cations at Na2 sites that overlap with the zeolitic framework in the projected image is degraded in the experimental AC-HRTEM image. The projected potential of a Cs+ cation site overlapped with the zeolitic framework is much higher, so that the decrease of the electron beam amplitude due to thermal diffuse scattering (TDS) may not be negligible in the AC-HRTEM image24. However, image simulation in this study did not take TDS absorption into consideration. The deviation between the experimental and simulated AC-HRTEM images could be due to TDS at much higher projected potential sites (see Fig. S7). The two types of projected sites are crystallographically equivalent; therefore, Cs+ cations must be located on both sites.
Figure 4. Simulated HRTEM images of Cs-exchanged at Na2 site.
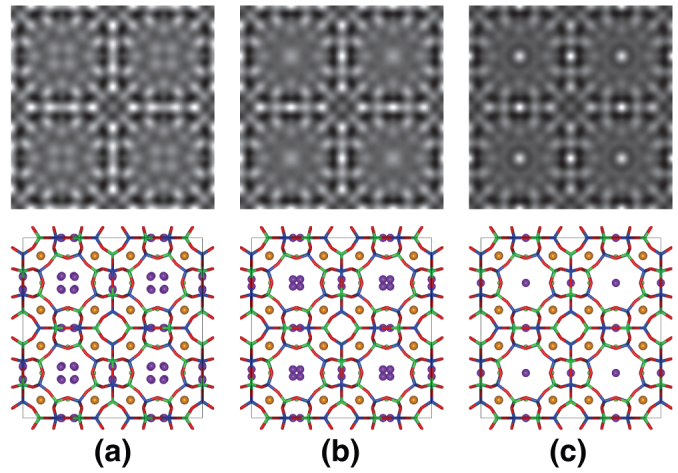
(a) Image simulated with Cs+ cation placed at the same position as Na2. (b) Image simulated with Cs+ cation placed at a position 0.07 nm away from the center of S8R. (c) Image simulated with Cs+ cation placed at the center of S8R.
Ab initio molecular dynamics simulations
Ab initio molecular dynamics (AIMD) simulations were performed to theoretically clarify the behavior of Na+ and Cs+ ions around the Na2 sites. The unit cell of the sodium zeolite ZK-4, Na9Al9Si15O48, were employed as the simulation cell, which has the same framework as the NaA zeolite. According to the Löwenstein's law25, i.e., forbidden sequence of Al-O-Al, the atomic configuration of Al and Si in the framework is limited to only two types (types A and B) as shown in Fig. S8. According to static structural optimizations for several Na2 sites in the crystal, the most stable sites for Na+ and Cs+ ions are both in the S8R for both the A and B frameworks, and the other possible sites have much higher energies and/or no energy local minima. The type-A framework was selected for the AIMD simulations because of the slightly lower (by 0.05 eV) calculated total energy, which can be qualitatively explained by Dempsey's law of least Al-O-Si-O-Al sequences26. Figure 5 shows the positions of Na+ and Cs+ ions in the S8R every 50 steps during the AIMD simulations at 300 and 1000 K. The positions of Na+ ions are circularly distributed in S8R with several dense regions, which correspond to equivalent Na2 sites with partial occupancy. In contrast, the Cs+ positions are centrally distributed in the S8R, which is different from the Na+ distribution, probably due to the ionic size difference as discussed later. With increasing temperature, Cs+ ions still fasten at the central site with larger thermal oscillation. Therefore, the behavior of Na+ and Cs+ ions in the AIMD simulations support the results from high-resolution electron microscopy.
Figure 5. Molecular dynamics simulations of counter cations within zeolite A.
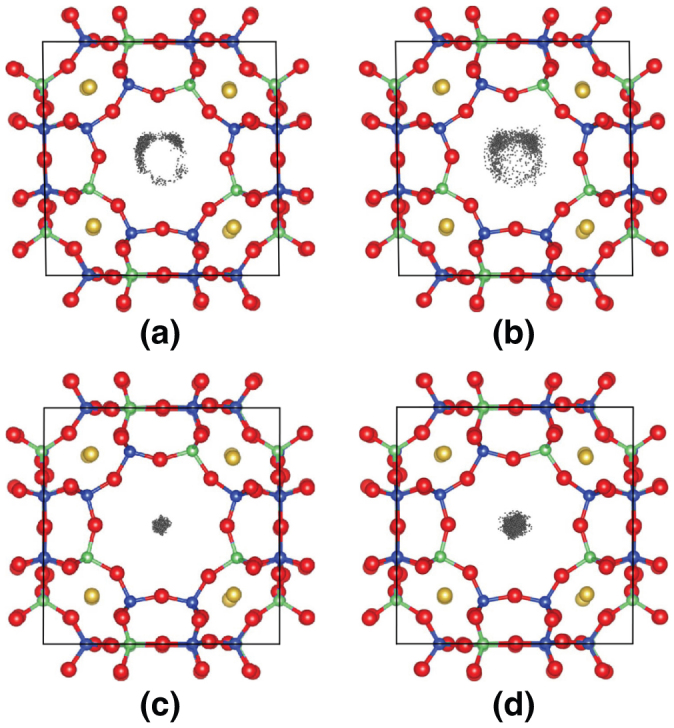
(a, b) Trajectories of Na+ cation placed near the center of S8R of NaA zeolite at 300 and 1000 K. (c, d) Trajectories of Cs+ cation placed near the center of S8R of partially Cs-exchanged NaA zeolite at 300 and 1000 K.
Discussion
The HAADF-STEM observation of partially Cs+-exchanged NaA shows that Cs+ cations were exchanged with only Na+ cations located at Na2 sites of NaA zeolite. The atomic Na+/Cs+ ratio of 8/3 expected from this result is consistent with the EDX elemental analysis results (see Fig. S1). Previous X-ray structural analyses showed that four separate Na2 sites in S8R have partial occupancy of 25% each, which indicates Na+ at Na2 sites are statistically located at these four Na2 sites5. In contrast, Cs+ ions within NaA zeolite are exactly located at the center of S8R, as shown by the AC-HRTEM observation. The difference between the cation sites for Na+ and Cs+ ions in S8R was also confirmed from the trajectories in the AIMD calculations (see Fig. 5).
The interaction of Na+ and Cs+ with the framework is considered to be basically ionic. However, the atomic-level behavior of these cations in S8R is quite different, as suggested by both the experimental and theoretical results. One main reason for the difference may be the size effect. Although the ionic radius of Cs+ (0.17 nm) is much larger than that of Na+ (0.10 nm)27, the size of the spacing at the center of S8R favorably fits the Cs+ radius. First-principles calculations with static structural optimization showed that smaller sized Na+ at a Na2 site has only two nearest-neighboring oxygen ions at the apexes of neighboring TO4 tetrahedra with bond lengths of 0.23–0.25 nm, whereas Cs+ in S8R is surrounded by eight oxygen ions with bond lengths of 0.34–0.37 nm. These bond lengths are almost equal to the sums of the ionic radii of Cs+, Na+ and O2− (0.14 nm). Such a bonding environment favors the location of Cs+ at the center of S8R.
Finally, it is worth noting that Cs+ in S8R of the zeolite is also thermally stable. The present AIMD calculations at high temperature (1000 K) indicated that Cs+ is still situated at the center of S8R, without diffusion into other sites. This may also be an indication that Cs+ is firmly ‘captured' at the center of S8R. Moreover, Cs+ at the S8R center is ionically bonded with as many as eight oxygen ions. Such behavior and bonding environment of Cs+ may be advantageous for the application of zeolite to the long-term management of radioactive waste because Cs+ leaching from the zeolite would be expected to be significantly low.
In summary, high-resolution microscopic analyses indicate that Cs+ cations are exchanged with Na+ cations located at the Na2 sites of NaA zeolite. This is the first report of direct atomic-scale imaging of a zeolitic framework and exchanged cations. The large Cs+ cations cannot fit into the small S6R cavities; therefore, over 70% of the Na+ cations within NaA zeolite are not exchanged with Cs+ cations. However, AIMD calculations at high temperature indicate the potential application of NaA zeolite for the long-term storage of Cs+ cations following solidification28, especially with respect to the thermal stability of Cs+ cations at the center of S8R. To improve the ion-exchange capability of zeolite, it is essential to choose a suitable framework with cavities suitable for the ionic radius of the counter-cation.
Methods
Materials and sample preparations
Partially Cs+-exchanged zeolite was prepared from 0.1 g of NaA zeolite (Tosoh Zeolum 4A type, Si/Al = 1 (atomic)) by immersion into 7.5 mmol/L of nonradioactive CsCl (Sigma-Aldrich) aqueous solution (20 ml) at room temperature for 12 h. Cs+-exchanged zeolite powder was separated from solution, washed several times with distilled water, and then dried in air at 50°C. The quantity of Cs+ captured in a zeolite particle was estimated using an energy-dispersive X-ray spectrometer (Bruker QUANTAX) attached to a field emission scanning electron microscope (Hitachi High-Tech SU8000). Small crystalline particles of zeolite A were crushed in an agate mortar with ethanol and collected on a gold-coated TEM microgrid.
AC-STEM observations
AC-STEM images were obtained with an electron microscope (JEOL JEM2100F, accelerating voltage = 200 kV). The microscope was equipped with a CEOS probe (STEM) corrector. The probe convergence angle was 25 mrad and the detection angle of the HAADF detector was 73–194 mrad. Parts of the images were Bragg-filtered based on a fast Fourier transform. Image processing was performed using Digital Micrograph software (Gatan).
AC-HRTEM observations
Prior to observations, the specimen was set under the high vacuum of the TEM column overnight for sufficient dehydration. The AC-HRTEM observations were performed on an electron microscope (JEOL JEM2200FS) equipped with a CEOS image (TEM) aberration corrector. The images were observed at an accelerating voltage of 200 kV and recorded on a slow-scan CCD camera (Gatan Ultrascan1000). The spherical aberration C3, of the objective lens was controlled to be −15 μm. Parts of the images were Bragg-filtered based on a fast Fourier transform. A minimum-dose system was employed for TEM observations to eliminate unnecessary electron irradiation to the specimen. Image processing was performed using Digital Micrograph software (Gatan).
Multislice (S)TEM simulations
Simulation of TEM and HAADF-STEM images were executed using Total Resolution LLC MacTempas X based on a multislice method29. Crystallographic parameters determined from X-ray diffractometry were employed for image calculation of the NaA-type zeolite. The locations of Cs+ cations in the zeolitic framework were determined by comparing simulated images and experimental AC-(S)TEM images.
Ab initio molecular dynamics simulations
AIMD simulations were performed using the projector augmented-wave (PAW) method30 within the generalized gradient approximation (GGA)31 implemented in the VASP code32,33. The plane wave cut-off energy was set to be 400 eV. The 3s and 3p electrons for Al, Si, and Na, 5s, 5p, and 6s for Cs, and 2s and 2p for O were treated as valence electrons. The unit cell of ZK-4 zeolite including 81 atoms was used with a single k-point sampling at the Γ-point. The NVT ensemble was employed with temperature control using the algorithm by Nosé34. The time step was set to 1 fs and the total simulation time was 100 ps, which corresponds to 100,000 steps, in which the first 20,000 steps, i.e., 20 ps, were removed as thermal equilibration steps.
Author Contributions
K.Y. designed and conducted all (S)TEM experiments. A.N. prepared ion-exchanged A-type zeolites. Ab initio calculations were performed by K.T. and K.M. Aberration corrected HRTEM was supervised by H.K., Y.I. and Y.S. supported and advised the experiments. All authors read and commented on the manuscript.
Supplementary Material
Supplementary Information
Acknowledgments
All authors acknowledge Prof. Y. Ikuhara at the University of Tokyo and Japan Fine Ceramics Center for proposing the collaboration between the authors and a great contribution to start this work. K.M. also acknowledges Izumi Science and Technology Foundation. A part of this work was supported by Kyoto University Nano Technology Hub in “Nanotechnology Platform Project” sponsored by the Ministry of Education, Culture, Sports, Science and Technology (MEXT) of Japan.
References
- Shaltry M., Phongikaroon S. & Simpson M. F. Ion exchange kinetics of fission products between molten salt and zeolite-A. Micropor. Mesopor. Mater. 152, 185–189 (2012). [Google Scholar]
- Yildiz B., Erten H. N. & Kis M. The sorption behavior of Cs+ ion on clay and zeolite in radioactive waste management: sorption kinetics and thermodynamics. J. Radioanal. Nucl. Chem. 288, 475–483 (2011). [Google Scholar]
- Dunzik-Gougar M. L., Simpson M. F. & Scheets B. E. Two-site equilibrium model for ion exchange between multi-valent cations and zeolite-A in a molten salt. Micropor. Mesopor. Mater. 84, 366–372 (2005). [Google Scholar]
- Sato I., Kudo H. & Tsuda S. Removal efficiency of water purifier and adsorbent for iodine, cesium, strontium, barium and zirconium in drinking water. J. Toxicol. Sci. 36, 829–834 (2011). [DOI] [PubMed] [Google Scholar]
- Pluth J. J. & Smith J. V. Accurate Redetermination of Crystal Structure of Dehydrated Zeolite A. Absence of Near Zero Coordination of Sodium. Refinement of Si,Al-Ordered Superstructure. J. Am. Chem. Soc. 102, 4704–4708 (1980). [Google Scholar]
- Hasegawa K. et al. A Synchrotron Powder Diffraction Study of Na-LTA. Jpn. J. Appl. Phys. 38, 65–68 (1999). [Google Scholar]
- Ikeda T., Izumi F., Kodaira T. & Kamiyama T. Structural Study of Sodium-Type Zeolite LTA by Combination of Rietveld and Maximum-Entropy Methods. Chem. Mater. 10, 3996–4004 (1998). [Google Scholar]
- Corma A. et al. Synthesis and Structure of Polymorph B of Zeolite Beta. Chem. Mater. 20, 3218–3232 (2008). [Google Scholar]
- Díaz I., Kokkoli E., Terasaki O. & Tsapatsis M. Surface Structure of Zeolite (MFI) Crystals. Chem. Mater. 16, 5226–5232 (2004). [Google Scholar]
- Ritsch S. et al. High-Resolution Electron Microscopy Study of ZSM-12 (MTW). Chem. Mater. 10, 3958–3965 (1998). [Google Scholar]
- Yoshida K. & Sasaki Y. Optimal accelerating voltage for HRTEM imaging of zeolite. Microscopy 62, 369–375 (2013). [DOI] [PubMed] [Google Scholar]
- Haider M. et al. Towards 0.1 nm resolution with the first spherically corrected transmission electron microscope. J. Electron Microsc. 47, 395–405 (1998). [Google Scholar]
- Lentzen M. et al. High-resolution imaging with an aberration-corrected transmission electron microscope. Ultramicroscopy 92, 233–242 (2002). [DOI] [PubMed] [Google Scholar]
- Mayoral A. et al. Atomic Resolution Analysis of Silver Ion-Exchanged Zeolite A. Angew. Chem. Int. Ed. 50, 11230–11233 (2011). [DOI] [PubMed] [Google Scholar]
- Heo N. H. & Seff K. Reaction of Dehydrated Na12-A with Cesium. Synthesis and Crystal Structure of Fully Dehydrated, Fully Cs+-Exchanged Zeolite A. J. Am. Chem. Soc. 109, 7986–7992 (1987). [Google Scholar]
- Heo N. H. & Seff K. Preparation and Structure of Fully Caesium Exchanged Zeolite A and of the Linear (Cs4)3+ Cation. J. Chem. Soc. Chem. Commun. 1987, 1225–1226 (1987). [Google Scholar]
- Jia C. L., Houbem L., Thust A. & Barthel J. On the benefit of the negative-spherical-aberration imaging technique for quantitative HRTEM. Ultramicroscopy 110, 500–505 (2010). [Google Scholar]
- Urban K. W. et al. Negative spherical aberration ultrahigh-resolution imaging in corrected transmission electron microscopy. Phil. Trans. R. Soc. London, Ser A 367, 3735–3753 (2009). [DOI] [PubMed] [Google Scholar]
- Jia C. L. & Urban K. Atomic-Resolution Measurement of Oxygen Concentration in Oxide Materials. Science 303, 2001–2004 (2004). [DOI] [PubMed] [Google Scholar]
- Jia C. L., Lentzen M. & Urban K. High-Resolution Transmission Electron Microscopy Using Negative Spherical Aberration. Microsc. Microanal 10, 174–184 (2004). [DOI] [PubMed] [Google Scholar]
- Lentzen M. Progress in Aberration-Corrected High-Resolution Transmission Electron Microscopy Using Hardware Aberration Correction. Microsc. Microanal. 12, 191–205 (2006). [DOI] [PubMed] [Google Scholar]
- Yoshida K., Sasaki Y. & Kurata H. High-resolution imaging of zeolite with aberration-corrected transmission electron microscopy. AIP Adv. 3, 042113 (2013). [Google Scholar]
- Fujiyoshi Y. et al. A new method for optimal-resolution electron microscopy of radiation-sensitive specimen. Ultramicroscopy 5, 459–468 (1980). [Google Scholar]
- Wang Z. L. Thermal diffuse scattering in sub-angstrom quantitative electron microscopy–phenomenon, effects and approaches. Micron 34, 141–155 (2003). [DOI] [PubMed] [Google Scholar]
- Loewenstein W. The distribution of aluminum in the tetrahedral of silicates and aluminates. Am. Mineral. 39, 92–96 (1954). [Google Scholar]
- Dempsey E. Calculation of Madelung potentials for faujasite-type zeolites. I J. Phys. Chem. 73, 3660–3668 (1969). [Google Scholar]
- Shannon R. Revised effective ionic radii and systematic studies of interatomic distances in halides and chalcogenides. Acta Crystallogr. A 32, 751–767 (1976). [Google Scholar]
- Lima E. et al. Cesium leaching from γ-irradiated CsA and CsX zeolites. J. Hazard. Mater. 160, 614–620 (2008). [DOI] [PubMed] [Google Scholar]
- Goodman P. & Moodie A. F. Numerical evaluation of N-beam wave functions in electron scattering by multislice method. Acta Cryst. A 30, 322–324 (1974). [Google Scholar]
- Blöchl P. E. Projector augmented-wave method. Phys. Rev. B 50, 17953–17979 (1994). [DOI] [PubMed] [Google Scholar]
- Pendrew P. E., Burke K. & Ernzerhof M. Generalized Gradient Approximation Made Simple. Phys. Rev. Lett. 77, 3865–3868 (1996). [DOI] [PubMed] [Google Scholar]
- Kresse G. & Hafner J. Ab initio molecular dynamics for liquid metals. Phys. Rev. B 47, 558–561 (1993). [DOI] [PubMed] [Google Scholar]
- Kresse G. & Hafner J. Ab initio molecular dynamics for open-shell transition metals. Phys. Rev. B 48, 13115–13118 (1993). [DOI] [PubMed] [Google Scholar]
- Nosé S. Constant Temperature Molecular Dynamics Methods. Prog. Theor. Phys. Suppl. 103, 1–46 (1991). [Google Scholar]
Associated Data
This section collects any data citations, data availability statements, or supplementary materials included in this article.
Supplementary Materials
Supplementary Information


