

Abstract
As psychological instruments are converted for administration on computers, differences in luminance and contrast of these displays may affect performance. Specifically, high-luminance assessments may mask age-group differences that are apparent under lower luminance conditions. We examined the effects of luminance and contrast on object detection using computerized and naturalistic assessments. Younger and older adults displayed more differences in performance across differing contrast levels in conditions that were matched for luminance, despite the conditions appearing perceptually different. These findings indicate that computerized assessments should be created with luminance levels that are similar to those of the tasks they purport to simulate in order to enhance their validity.
Keywords: aging, computer assessment, luminance, object detection
While age-related deficits in visual perception are widely known, the relation of visual variables to the predictive validity of increasingly popular computerized assessments of perceptual and cognitive tasks is not yet known. As standard neuropsychological instruments and other vision-based assessments are converted for administration on computers, differences in luminance and contrast of these displays relative to those of more traditional modes of administration may result in disparate findings. The direct luminance emitted from standard computer monitors in certain settings can be greater than the luminance found in everyday settings such as the home and office, where the illumination of an object depends on the amount of light emitted from an external source (e.g., a lamp) combined with the reflectance of the object's surface. High-luminance computerized assessments may accordingly mask group differences in task performance that are apparent under lower luminance conditions.
The possibility of reduced sensitivity of computerized tests to group differences is especially relevant to study groups that differ in aspects of vision such as contrast sensitivity (e.g., Cronin-Golomb, Gilmore, Neargarder, Morrison, & Laudate, 2007; Gilmore, Cronin-Golomb, Neargarder, & Morrison, 2005), which is strongly affected by luminance levels. In older adults, the normal decline in contrast sensitivity has been shown to worsen under decreased luminance levels in healthy individuals (Sloane, Owsley, & Alvarez, 1988; Sloane, Owsley, & Jackson, 1988) and in those who are visually impaired (Cornelissen, Bootsma, & Kooijman, 1995). These reductions in contrast sensitivity may be eliminated at higher luminance levels (Culham & Kline, 2002; Sloane, Owsley, & Alvarez, 1988; Sloane, Owsley, & Jackson, 1988). It follows that the increased signal strength of the higher luminance emitted from a computer screen may reduce age-related performance differences related to contrast sensitivity seen under normal indoor lighting conditions, compromising the ability of the laboratory-based measure to accurately assess genuine age-based differences in performance.
To address this issue, in the present study we used luminance-matched naturalistic and computerized assessments to examine the relation between contrast and luminance on object detection on a task related to everyday living—finding a pill on a tiled surface. We hypothesized that younger adults would respond to the stimuli faster and commit fewer errors than older adults under low-luminance conditions regardless of mode of presentation (computerized or naturalistic). Additionally, based on previous reports indicating improved performance in older adults when luminance was increased, we hypothesized that these group differences would be reduced in the high-luminance condition (representative of a standard computer monitor), which would suggest that luminance would be one critical factor to consider in the development of computerized assessments of real-world tasks, including neuropsychological assessments. Finally, we expected to see no differences in the naturalistic real pill condition based on the fact that performance involves both contrast and depth perception abilities.
Method
This project was part of a larger dual-site study of vision and cognition in aging and neurodegenerative disorders. Recruitment and test procedures and analytic methods were standard across the two sites of the study, Boston University (Boston, Massachusetts) and Case Western Reserve University (Cleveland, Ohio).
Older adults (OAs) were recruited from local communities. All were free of dementia, as indicated by performance on the modified Mini-Mental State Examination (Stern, Sano, Paulson, & Mayeux, 1987; M = 28.5, SD = 1.2). Younger adults (YAs) were undergraduates at Boston University or Case Western Reserve University. All OAs and YAs participants were free of medical abnormalities, as determined by health history screening. Twenty-three of the 28 older adults received a detailed neuro-ophthalmological examination to rule out visual disorders arising from dysfunction of anterior pathways, including cataracts, glaucoma, and macular degeneration. There were no differences between those who completed the neuro-ophthalmological examination and those who did not on acuity or contrast sensitivity. Those who did not choose to have the examination were, on average, 10 years younger than the others and presumably did not participate because of work-related conflicts. YAs reported that they had a normal history of eye health. No differences in task performance were noted between the Boston and Cleveland samples. Data were accordingly collapsed across sites for analysis.
Participants
Twenty-eight healthy older adults (M = 68.7, SD = 9.3) and 30 healthy younger adults were tested (M = 20.3, SD = 2.0). The OA group had significantly more years of education (M = 16.4, SD = 2.1) than the YA group (M = 14.70, SD = 1.56; t(56) = 3.5, p = .001), though the YA level would not be considered terminal, as they would be completing two more years of college. The OAs were recruited through the community and the YAs were recruited from undergraduate psychology courses. Characteristics for each of these groups are listed in Table 1.
Table 1.
Participant Characteristics. Means (Standard Deviations)
| Demographic characteristics | Younger adults (n = 30) Mean (SD) | Older adults (n = 28) Mean (SD) |
|---|---|---|
| Age (years) | 20.3 (2.0) | 68.7 (9.3) |
| Education (years) | 14.7 (1.6) | 16.4 (2.1) |
| Depression | ||
| BDI-II | 3.1 (3.9) | |
| GDS | 3.2 (3.6) | |
| Reaction time (dominant hand) | ||
| Purdue Pegboard Test | 15.3 (1.7) | 13.0 (1.7)* |
| Near Acuity (log-transformed) | −.09 (.03) | .06 (.13)* |
p < .01.
Simple motor speed, as indicated by performance on the Purdue Pegboard test, differed between groups, t(55) = 5.31, p < .001, with the YA group performing faster than the OA group. Scores on this measure were used as a covariate, when significant, to account for any potential differences in reaction time on the main task. Both groups endorsed no depression as indicated by either the Beck Depression Inventory, 2nd edition (BDI; Beck, Steer, & Brown, 1996) or the Geriatric Depression Scale (GDS; Sheikh & Yesavage, 1986).
Study methods were approved by the institutional review boards of Boston University, Case Western Reserve University, and University Hospitals Case Medical Center. All individuals gave informed consent. Exclusion criteria included being a non-native speaker of English; presence of a serious uncorrected eye condition such as glaucoma, cataracts, macular degeneration, or double vision; history of depression or other psychiatric disorder significant enough to require treatment or hospitalization; head trauma resulting in loss of consciousness; history of drug and alcohol abuse; dementia; and other serious health conditions. Participants used their own refractive correction for testing.
Materials
Basic vision assessments
Binocular central acuity was measured at 16 in using the Lighthouse Near Visual Acuity Test (2nd edition, Lighthouse International New York, New York), a high contrast Snellen-type chart, for which participants read letters of progressively smaller size. The near Functional Acuity Contrast Test (FACT; Stereo Optical Company Incorporated, Chicago, Illinois) was used to assess static contrast sensitivity. FACT is a measure of contrast sensitivity across five spatial frequencies (1.5, 3.0, 6.0, 12.0, and 18.0 cycles per degree [cpd]), with eight trials at one frequency per row. In each trial, the contrast between foreground and background becomes lower and participants are instructed to indicate the orientation of the gratings. Like the acuity test, the FACT was administered at 16 in.
Pill assessments
All testing was conducted in a room with no outside lighting, illuminated by two lamps, each fixed with a 150-W General Electric Reveal light bulb connected to a voltage regulator to minimize variability. The lighting in the room was approximately 75 candelas per square meter (cd/m2) at the center of the table used for the two naturalistic conditions and 90 cd/m2 eight inches from the center of the monitor—halfway between the participant and the monitor for the two computerized conditions.
Naturalistic assessment 1 (three-dimensional pill condition; N1)
For the first naturalistic assessment, round mints (“pills”; 7 mm diameter, 4 mm depth) were painted seven different shades of gray to match the following Michelson contrast values: .33%, 1.40%, 2.10%, 3.50%, 3.95%, 5.13%, and 6.60%. Contrast varied over a 1.3 log unit range. Luminance values ranged between 24 and 27 cd/m2. Contrast values for each shade were confirmed using a Minolta CS-100 photometer. Pills that differed from these values by more than .017 log-transformed Michelson contrast units were discarded. Pills were presented on an 8.5-x-11-in piece of Epson double-sided matte paper, on which a 6-x-6 grid (each square, 3.3 cm2) was printed using an Epson Stylus Photo R2400 printer. A sliding partition, which consisted of a piece of poster board attached to a slide on the table, allowed the examiner to manually place the pill on the grid before revealing the grid to the participant. Reaction time (RT) and accuracy were recorded by the examiner, who was naäve to the hypotheses, using a computerized stopwatch program accurate to a millisecond.
Naturalistic assessment 2 (printed condition; N2)
The second naturalistic assessment was similar to N1 but used disks printed onto the same background grid rather than actual three-dimensional pills. Michelson contrast values for the seven shades were .35%, 1.46%, 2.05%, 3.65%, 4.25%, 4.90%, and 6.60%. Contrast varied over a 1.3 log unit range. Luminance values ranged between 24 and 27 cd/m2. Sheets were placed in a three-ring binder and trials were separated by a piece of paper printed only with a centered fixation cross. RT and accuracy were recorded in the same manner as N1.
Computerized assessments (HL and LL)
Both the high- and low-luminance computer conditions were presented on a 17-in (15.9-in viewable) Elo Touchsystems Entuitive touch screen CRT monitor at a resolution of 1024 × 768 and a refresh rate of 85 Hz. The monitor was regularly calibrated using Color Vision's Spyder2Pro software and hardware to achieve a perceptually linear curve (gamma 2.2), where a gray level of 0 (black) was set at 0.22 cd/m2 and the gray level of 255 (white) was 8.18 cd/m2.
Whereas contrast values between the two conditions were similar, luminance values differed, making the two conditions appear different (see Figure 1). The high-luminance condition appeared to be whiter than the low-luminance condition, which appeared to be grayer. The high-luminance computer condition appeared perceptually similar to the naturalistic conditions. They were both white. The low-luminance computer condition appeared different than the naturalistic conditions (more gray) but had similar luminance levels. Contrast values were similar across all conditions. Differences in luminance between the foreground and background created the seven contrasts studied. In the high-luminance condition, luminance values ranged from 89–99 cd/m2, while luminance values on the low-luminance condition ranged from 14–17 cd/m2. Michelson contrast values for the high-luminance condition were .33%, 1.85%, 2.75%, 3.70%, 4.65%, 5.10%, and 6.6%, and for the low-luminance condition were .30%, 1.85%, 2.90%, 3.70%, 4.25, 5.10%, and 6.30%. Trials were separated by a fixation cross appearing 500 ms after the participant made a response.
Figure 1.

Screen shots of examples of the two computer conditions (low luminance, top, and high luminance, bottom). The displays for the low-luminance condition were perceptually darker than the displays for the high-luminance condition. The high-luminance condition appeared perceptually similar to the naturalistic printed and real-pill conditions (not shown).
Procedure for Pill Assessments
Each participant received all four assessments: the naturalistic three-dimensional painted pill condition (N1), the naturalistic two-dimensional pill condition (N2), the high-luminance computer condition (HL), and the low-luminance computer condition (LL). Presentation of the four conditions was counterbalanced across participants. Within each condition, the seven shades of pills were presented four times per quadrant, for a total of 16 trials per shade, resulting in 112 trials per condition. One half of the participants received trials in the same randomly assigned order and the other half received trials in the reverse order. Participants were instructed to touch the pill as quickly and as accurately as possible. RT and accuracy were recorded. Participants were given breaks from testing, as needed.
Naturalistic version 1
Participants began each trial with their dominant hand on a rest placed halfway between the participant and the test stimuli. Before each trial, the experimenter slid the screen across the table to conceal the location in which the next pill would be placed. The screen was opened to reveal the grid background and pill. RT was recorded from the time the display was visible to the participant until the time the pill or an incorrect location was touched. RT and accuracy were recorded by the experimenter pressing the appropriate key on a laptop computer with software designed to measure and store RT and accuracy data. An answer was considered correct if the participant touched the pill or the square on which it was placed. All other areas of the grid were considered incorrect.
Naturalistic version 2
Participants began each trial with their dominant hand on the rest and with gaze fixated on a cross at the center of the page. RT was measured from the time the display was visible (after the fixation-cross page was flipped) until the time the participant touched the printed pill or an incorrect area on the grid. RT and accuracy were recorded by the experimenter pressing the appropriate key on a laptop computer with software designed to measure and store RT and accuracy data.
Computerized version (HL and LL)
Participants were seated in a chair centered in front of the computer monitor, with their heads stationary on a chin rest 16 in from the screen. Each trial began with the participants resting their dominant hand on a rest and with gaze fixated on a cross at the center of the screen. RT was measured from the time the stimulus appeared until the participant touched the screen. Accuracy, RT, and location of errors were recorded by the presentation software (Superlab 4.0).
Results
Where appropriate, scores on near acuity (log-transformed values) and simple motor speed, as indicated by performance on the Purdue Pegboard test, were included as covariates. Age and contrast sensitivity were not included as covariates in any comparisons because we hypothesized that these variables explained why performance might differ between groups. When a violation of the sphericity assumption was noted, Huynh-Feldt correction was applied to the data.
Basic Vision Assessments
All participants had acuity equal to or better than 20/40 (0.30 LogMar). The mean acuity score for the OA group was .06 Log Mar (SD = .03) and the mean acuity score for the YA group was −.09 (SD = .13). Independent samples t tests revealed significant acuity differences between the two groups, t(27.38) = 5.69, p < .001, consistent with expected age-related differences. Acuity was included as a covariate in the analyses, as needed.
We analyzed performance on the FACT using a mixed design analyses of variance (ANOVA). Group served as the between-subjects variable and spatial frequency as the within-subjects variable. Results revealed a main effect of group, F(1, 54) = 50.3, p < .001; a main effect of spatial frequency, F(2.5, 133.1) = 201.4, p < .001, which was expected because contrast sensitivity varies according to spatial frequency; and a significant interaction between group and spatial frequency, F(2.5, 133.2) = 15.6, p < .001. Follow-up analyses using independent samples t tests with the Bonferroni correction (α= .05/5 = .01) revealed that the YA group outperformed the OA group at every spatial frequency (all ps <.001) except for the 1.5-cpd condition, t(52.3) = 1.6, p = .12. Contrast sensitivity by spatial frequency is shown in Figure 2.
Figure 2.
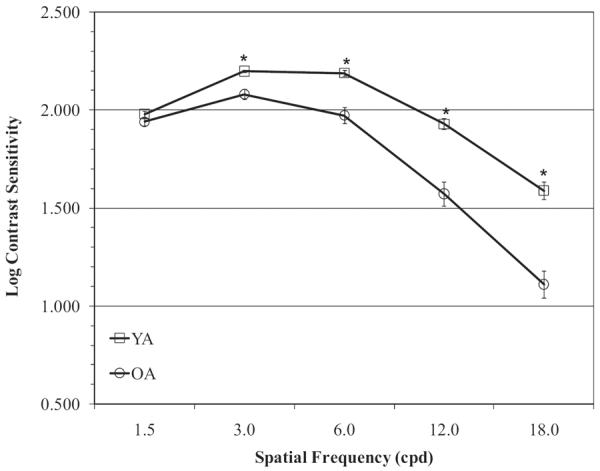
Mean score by spatial frequency (1.5, 3.0, 6.0, 12.0, and 18.0) on the Functional Acuity Contrast Test by age. Error bars represent the standard error of the mean. The YA group performed better than OA at 3.0, 6.0, 12.0, and 18.0 cpd, p < .01. * Significant group differences (p < .01).
Pill Assessments
To test our hypotheses regarding the naturalistic (N1 and N2) and computerized (HL and LL) pill conditions, we performed four separated mixed design analyses of variance (ANOVAs) with group (YA, OA) serving as the between-group factor and contrast level as the within-group factor. Both groups had significant difficulty with the lowest contrast level, indicating it was close to threshold for detection; therefore, RT analyses for this shade were analyzed separately. All analyses were conducted on mean RT and error rates. Trials in which pill location was incorrectly identified were excluded from the RT data. RTs greater than two standard deviations from an individual's contrast specific mean were excluded to remove outliers that may have resulted from poor concentration, guessing, or other potential confounds.
For each significant ANOVA, planned follow-up comparisons using independent samples t tests with a Bonferroni correction (α= .05/7 = .007) were performed. Although groups differed on near acuity, it was not a significant covariate in the analyses, indicating that differences between groups were not due to acuity differences. As expected, the YA group performed significantly better on a measure of simple motor speed, the Purdue Pegboard test, and performance on this measure was used as a covariate when appropriate.
We did not perform analyses wherein the four conditions (NI, N2, HL, and LL) were directly compared. These analyses were not feasible due to the fact that Michelson contrast values were not identical across the four conditions, and because RT was measured slightly differently in the computerized and naturalistic conditions.
Naturalistic (N1) results (painted three-dimensional condition)
Mean RT is shown in Figure 3. Neither group committed any errors on this condition. For RT, a mixed design ANOVA indicated a significant main effect of group (1, 56) = 6.94, p < .01), but no main effect of contrast, F(5.24, 293.16) = 1.44, p = .21, and no interaction between group and contrast level, F (5.24, 293.16) = .68, p = .65); therefore. follow-up analyses were not performed.
Figure 3.

Mean RT on the painted three-dimensional naturalistic condition (N1) by age group. Error bars represent the standard error of the mean. Groups performed similarly on both RT and error rates.
Naturalistic (N2) results (printed two-dimensional condition)
Mean RTs and group differences in error rates are shown in Figure 4. For error rates, a mixed design ANOVA indicated a significant main effect of group, F(1, 56) = 22.16, p < .001, a significant main effect of contrast, F(2.27, 126.85) = 455.85, p < .001, and a significant interaction between group and contrast, F(2.27, 126.85) = 9.17, p < .001. Pairwise comparisons, using a more conservative alpha level of .007 (.05/7), indicated significant group differences at 1.46% contrast, t(31.56) = 4.36, p < .001, but not at any of the remaining contrast levels. The OA group committed more errors than the YA group.
Figure 4.

Mean RT on the printed two-dimensional naturalistic condition (N2) by age group. Error bars represent the standard error of the mean. Relative to OA, the YA group performed better at 1.46%, 2.05%, 3.65%, 4.25%, and 4.90%, p < .007 (indicated by asterisks). The YA group also made fewer errors at 1.46% contrast, p < .007 (indicated by the symbol [strok] ). * Significant group differences in reaction time (p < .007). [strok]
 Significant group differences in error rates (p < .007).
An independent samples t test indicated no significant group differences in RT for the lowest contrast level (.35%), t(42) = 0.33, p = .75. A mixed design ANOVA indicated a significant main effect of group, F(1, 56) = 26.37, p < .001, a significant main effect of contrast, F(2.04, 114.39) = 347.61, p < .001, and a significant interaction between group and contrast, F(2.04, 114.39) = 31.45, p < .001. Pairwise comparisons, using a more conservative alpha level of .007 (.05/7), indicated significant group differences at 1.46%, t(48.8) = 7.6, p < .007; 2.05%, t(56) = 6.3, p < .007; 3.65%, t(56) = 3.9, p < .007; 4.25%, t(56) = 3.1, p < .007; and 4.90%, t(56) = 3.3, p < .007 contrast levels. Groups performed similarly at 6.60% contrast level, t(56) = 2.6, p = .01. In all cases the YA performed significantly faster.
High-luminance (HL) computer condition results
Mean RTs and group differences in error rates are shown in Figure 5. For error rates, a repeated measures ANOVA indicated a significant main effect of group, F(1, 56) = 4.24, p < .04, a significant main effect of contrast, F(1.10, 61.72) = 523.96, p < .001, and a significant interaction between group and contrast, F(1.10, 61.72) = 5.03, p < .03. Pairwise comparisons using a more conservative alpha level of .007 (.05/7) indicated no significant group differences at any contrast level.
Figure 5.

Mean RT on the high-luminance computerized condition (HL) by age group. Error bars represent the standard error of the mean. The YA group performed better than OA at 1.85% and 2.90% contrast levels, p < .007 (represented by asterisks). * Significant group differences in reaction time (p < .007).
An independent samples t test indicated no significant group differences in RT for the lowest contrast level (.30%; t(42) = 0.23, p = .82). A mixed design ANOVA indicated a significant main effect of group, F(1, 56) = 8.26, p < .006, a significant main effect for contrast, F(1.39, 77.83) = 44.93, p < .001, and a significant interaction between group and contrast, F(1.39, 77.83) = 11.69, p < .001, for the remaining contrast levels. Pairwise comparisons, also using a more conservative alpha level of .007 (.05/7), indicated significant group differences at 1.85%, t(56) = 4.1, p < .007, and 2.90%, t(39.7) = 5.8, p < .007 contrast levels. Groups performed similarly at 3.70%, t(47.0) = 5.8, p < .007; 4.25%, t(56) = 3.0, p < .007; 5.10%, t(56) = 3.4, p < .007; and 6.30%, t(56) = 3.4, p < .007 contrast levels.
Low-luminance (LL) computer condition results
Mean RTs and group differences in error rates are shown in Figure 6. For error rates, a mixed design ANOVA indicated a significant main effect of group, F(1, 56) = 17.40, p < .001, a significant effect of contrast, F(2, 62, 146.90) = 385.21, p < .001, and a significant interaction between group and contrast, F(2.62, 146.90) = 10.33, p < .001. Pairwise comparisons, using a more conservative alpha level of .007 (.05/7), indicated significant group differences at .33% (lowest), t(46.01) = 3.56, p < .001, and 1.85% contrast, t(36.64) = 3.96, p < .001, but not at 2.75%, t(27.64) = 2.31, p = .03; 3.70%, t(28.60) = 1.22, p = .23; 4.65%, t(40.75) = .95, p = .35; 5.10%, t(27.00) = 1.44, p = .16; or 6.60% (darkest), t(45.53) = 1.35, p = .19. In all significant cases, the OA group committed more errors than the YA group.
Figure 6.

Mean RT on the low-luminance computerized condition (LL) by age group. Error bars represent the standard errors of the mean. The YA group performed better than OA at 1.85%, 2.75%, 3.70%, 4.65%, 5.10%, and 6.60% contrast levels, p < .007 (represented by asterisks). The YA group also made fewer errors than OA at .33% and 1.85% contrast levels, p < .007 (indicated by the symbol [strok]8). * Significant group differences in reaction time (p < .007). [strok]t Significant group differences in error rates (p < .007).
As indicated above, RT data for the lowest contrast level (.33%) were considered separately because of significant deficits in accuracy on this level in both groups relative to their accuracy at the other levels. An independent samples t test indicated no significant group difference in RT for .33% contrast, t(47) = 1.69, p = .10. For the remaining six contrast levels, a mixed design ANOVA indicated a significant main effect of group, F(1, 56) = 27.02, p < .001, a significant main effect of contrast level, F(1.54, 86.00) = 233.10, p < .001, and a significant interaction between group and contrast level, F(1.54, 86) = 13.04, p < .001. Pairwise comparisons, using a more conservative alpha level of .007 (.05/7), indicated significant group differences at 1.85%, t(56) = 4.1, p < .007; 2.75%, t(39.7) = 5.8, p < .007; 3.70%, t(47.0) = 5.8, p < .007; 4.65%, t(48.6) = 4.4, p < .007; 5.10%, t(56) = 3.0, p < .007; and 6.60%, t(56) = 3.4, p < .007 contrast levels.
Discussion
Our results indicate that age-related differences in the sensitivity to contrast of computer-presented stimuli diminish with increased screen luminance levels (i.e., increasing stimulus strength), and that this effect of luminance alters the relation between performance on computerized and naturalistic assessments. Specifically, the relation between performance on computerized assessments and two-dimensional naturalistic assessments (i.e., paper assessments) was more similar when the two types of assessments employed comparable luminance levels, despite the two conditions appearing perceptually different (lighter or darker). We noted significant age-related differences in RT for the low-luminance computer condition, as well as for the naturalistic printed condition (also of low luminance), but not the high-luminance computer condition or the three-dimensional printed condition. In the two low-luminance conditions, younger adults performed better than older adults. Consistent with our hypotheses, both groups performed better with the increased luminance level in the high-luminance condition than on the low-luminance conditions. This finding is in accord with earlier reports indicating that age-related changes in the normal contrast sensitivity curve are reduced at high-luminance levels (Culham & Kline, 2002; Sloane, Owsley, & Alvarez, 1988; Sloane, Owsley, & Jackson, 1988) but extend those findings to applications where the relation between performance on computerized and naturalistic assessments is of importance.
Consistent with the RT data, group differences in error rates were observed only on the two-dimensional low-luminance conditions (printed naturalistic condition and low-luminance computer condition), with older adults committing more errors than the younger adults. Because this difference was absent in the high-luminance computer condition, it can be inferred that increased monitor luminance improved the accuracy of older adults. These results agree with those of previous studies (Krupinski, Roehrig, & Furukawa, 1999; Lin & Huang, 2006) that found that computer screen illumination influenced object-detection abilities, with higher luminance levels resulting in better performance.
In the most naturalistic condition (three-dimensional painted-pill condition), the older adults were slower overall, but we did not find a main effect of contrast or an interaction between group and contrast. This finding suggests that when the visual cue of depth or shadow was added (i.e., a real pill), it permitted compensation for the contrast sensitivity deficit observed in older adults. Both groups performed best under this condition, with the fastest RTs and no errors. The increased naturalism of the stimuli enhanced object-detection abilities. This is a very important finding because scientists often use computerized assessments in a laboratory setting to infer the types of real-world deficits that older individuals encounter. If, indeed, the addition of information in a naturalistic setting (such as depth perception) aids in compensating for the luminance and contrast deficits observed in a controlled environment, it significantly alters the ecological validity of the laboratory findings. It demonstrates that besides luminance and contrast, other visual cues such as depth perception are equally important in the detection of objects in a real-world environment.
For both groups, performance on the low-luminance computer condition and on the printed naturalistic condition, of similar low luminance, were more similar to one another than performance on the remaining two conditions. This finding supports our hypothesis that performance on the two low-luminance conditions would be comparable. When luminance levels were not held constant between computer-displayed and two-dimensional naturalistic assessments, performance on these tasks differed, even though the displays appeared perceptually similar. This finding demonstrates the importance of creating computerized assessments accurately. It is critical that computerized assessments be created with physical properties that are similar to those of naturalistic assessments (i.e., luminance levels), despite looking different.
As technology continues to change how we create neuropsychological and visual assessments, it is crucial that we understand the differences and similarities between computerized and noncomputerized assessments. As the present results indicate, computerized assessments with luminance levels similar to noncomputerized assessments seem to be more sensitive to contrast sensitivity deficits than are assessments with higher luminance levels, and hence may be more ecologically valid as displays of tasks of interest that do not present themselves on computer monitors. Typically, matching to real-world tasks would involve decreasing the luminance output of computer monitors. To reiterate, if visual assessments are to be presented on computer screens, it is essential that they are not presented with higher luminance levels than typically seen in indoor office settings.
While a reduction in luminance levels is recommended for improving the relation between computerized and noncomputerized assessments, the opposite may be recommended for improving performance in the real world. In relation to activities of daily living, it is important to note that increased luminance levels improve contrast perception and object-detection abilities especially in older adults, as shown in the present study. These results are similar to those of previous studies that have shown increased luminance to improve other aspects of vision and daily life (Albert, Bear-Lehman, & Burkhardt, 2006; Cullinen, Silver, Gould, & Irvine, 1979). Taken together, these reports emphasize that it is important that lighting levels are increased as individuals age to compensate for visual deficits.
In conclusion, increasing luminance, together with optimizing the naturalism of stimuli, enhances the ability to detect an object at certain contrast levels. If the goal is to simulate real-world tasks, computerized and noncomputerized assessments should be created with similar physical properties, despite perceptual differences, especially for older adults and others who experience declines in contrast sensitivity. The present study focused on luminance, contrast, and depth cues; further studies are needed to explore the effect of the lack of additional cues in computerized displays that may lead to an overestimate of visual deficits on real-world tasks. Other characteristics of computer displays may also be pertinent, such as refresh rates (Montegut, Bridgeman, & Sykes, 1997). Better understanding the effect of visual cues and display characteristics may result in improved validity of computerized assessments of real-world tasks.
Acknowledgments
We thank all of the individuals who participated in this study. Thomas Laudate, Bruce Reese, and Chelsea Toner provided expert technical support. Funding for this study was provided by the National Institute of Neurological Disorders and Stroke (R01 NS050446 and R01 NS052914 to ACG).
References
- Albert SM, Bear-Lehman J, Burkhardt A. Disparities between ambient, standard lighting and retinal acuities in community-dwelling older people: Implications for disability. Journal of the American Geriatric Society. 2006;54:1713–1718. doi: 10.1111/j.1532-5415.2006.00922.x. doi:10.1111/j.1532-5415.2006.00922.x. [DOI] [PubMed] [Google Scholar]
- Beck AT, Steer RA, Brown GK. Manual for Beck Depression Inventory (BDI-II) Psychological Corporation; San Antonio, TX: 1996. [Google Scholar]
- Cornelissen FW, Bootsma A, Kooijman AC. Object perception by visually impaired people at different light levels. Vision Research. 1995;35:161–168. doi: 10.1016/0042-6989(94)00183-m. doi:10.1016/0042-6989(94)00183-M. [DOI] [PubMed] [Google Scholar]
- Cronin-Golomb A, Gilmore GC, Neargarder S, Morrison SR, Laudate TM. Enhanced stimulus strength improves visual cognition in aging and Alzheimer's disease. Cortex. 2007;43:952–966. doi: 10.1016/s0010-9452(08)70693-2. doi: 10.1016/S0010-9452(08)70693-2. [DOI] [PubMed] [Google Scholar]
- Culham JC, Kline DW. The age deficit on photopic counterphase flicker: Contrast, spatial frequency, and luminance effects. Canadian Journal of Experimental Psychology. 2002;56:177–186. doi: 10.1037/h0087395. doi: 10.1037/h0087395. [DOI] [PubMed] [Google Scholar]
- Cullinen TR, Silver JR, Gould ES, Irvine D. Visual disability and home lighting. Lancet. 1979;1:643–644. doi: 10.1016/s0140-6736(79)91082-1. [DOI] [PubMed] [Google Scholar]
- Gilmore GC, Cronin-Golomb A, Neargarder SA, Morrison SR. Enhanced stimulus contrast normalizes visual processing of rapidly presented letters in Alzheimer's disease. Vision Research. 2005;45:1013–1020. doi: 10.1016/j.visres.2004.10.017. doi:10.1016/j.visres.2004.10.017. [DOI] [PubMed] [Google Scholar]
- Krupinski E, Roehrig H, Furukawa T. Influence of film and monitor display luminance on observer performance and visual search. Academic Radiology. 1999;6:411–418. doi: 10.1016/s1076-6332(99)80191-3. doi:10.1016/S1076-6332(99)80191-3. [DOI] [PubMed] [Google Scholar]
- Lin CC, Huang KC. Effects of ambient illumination and screen luminance combination on character identification performance on desktop TFT-LCD monitors. International Journal of Industrial Ergonomics. 2006;36:211–218. doi:10.1016/j.ergon.2005.11.004. [Google Scholar]
- Montegut MJ, Bridgeman B, Sykes J. High refresh rate and oculomotor adaptation facilitate reading from video displays. Spatial Vision. 1997;10:305–322. doi: 10.1163/156856897x00230. doi:10.1163/156856897X00230. [DOI] [PubMed] [Google Scholar]
- Sheikh JI, Yesavage JA. Geriatric Depression Scale (GDS): Recent evidence and development of a shorter version. In: Brink TL, editor. Clinical Gerontology: A Guide to Assessment and Intervention. Hawthorne Press; New York, NY: 1986. pp. 165–173. [Google Scholar]
- Sloane ME, Owsley C, Alvarez SL. Aging, senile miosis and spatial contrast sensitivity at low luminance. Vision Research. 1988;28:1235–1246. doi: 10.1016/0042-6989(88)90039-9. doi:10.1016/0042-6989(88)90039-9. [DOI] [PubMed] [Google Scholar]
- Sloane ME, Owsley C, Jackson CA. Aging and luminance-adaptation effects on spatial contrast sensitivity. Journal of the Optical Society of America A, Optics and Image Science. 1988;5:2181–2190. doi: 10.1364/josaa.5.002181. doi: 10.1364/JOSAA.5.002181. [DOI] [PubMed] [Google Scholar]
- Stern Y, Sano M, Paulson J, Mayeux R. Modified Mini-Mental State Examination: Validity and reliability. Neurology. 1987;37:179. [Google Scholar]