

Abstract
The brain’s response to somatosensory stimuli is essential to experience-driven learning in children. It was hypothesized that advances in event-related potential technology could quantify the response to touch in somatosensory cortices and characterize the responses of hemiparetic children. In this prospective study of 8 children (5–8 years old) with hemiparetic cerebral palsy, both event-related potential responses to sham or air puff trials and standard functional assessments were used. Event-related potential technology consistently measured signals reflecting activity in the primary and secondary somatosensory cortices as well as complex cognitive processing of touch. Participants showed typical early responses but less efficient perceptual processes. Significant differences between affected and unaffected extremities correlated with sensorimotor testing, stereognosis, and 2-point discrimination (r > 0.800 and P = .001 for all). For the first time, a novel event-related potential paradigm shows that hemiparetic children have slower and less efficient tactile cortical perception in their affected extremities.
Keywords: somatosensory, event-related potential, cerebral palsy, hemiparetic
The perception of tactile stimuli in the human cortex is essential to the function of many systems involved in neurodevelopment. Early learning in infants is driven in large part by somatosensory inputs. More complex neural processes in childhood emerge from basic sensory experience.1–4 Conversely, abnormal sensory perception can result in altered cognitive, communicative, and motor development,5–7 highlighting the need for objective measurements of sensory experience in young children. Although auditory and visual stimuli have been successfully studied, touch has proven more difficult to characterize. Developing tools to quantitatively assess the cortical processing of tactile stimuli will facilitate the evaluation of neurorehabilitative strategies in children with deficits involving the somatosensory cortex.
Recent studies addressing somatosensory perception have primarily used neuroimaging. In particular, functional magnetic resonance imaging (fMRI) has added to our understanding of the brain structures responding to tactile stimulation.8–11 However, imaging modalities such as fMRI are limited in their ability to characterize the timing and evolution of responses; activation of various touch receptors in distal extremities generates cortical signals in less than 1 second, well under the temporal resolution of most fMRI technology.12 The need exists for methods that can measure both the temporal and quantitative characteristics of the cortical responses to touch. Additionally, to be of use in populations of vulnerable children or infants, such methods must fulfill special requirements: easy administration, high reproducibility, and lack of discomfort.
Measurement of event-related potential, or time-locked electroencephalography (EEG), offers one approach to characterization of cortical signals by time and amplitude in response to stimuli by providing information on the strength and speed of electrical signals traveling through the brain.13 Modern improvements to evoked potential measurements offer a technology that is noninvasive, rapidly administered, and sensitive to stimulus differences in a range of modalities.14
Our first goal was to develop a new paradigm for evaluating cortical responses to light touch in children. We hypothesized that event-related potential technology would allow us to differentiate normal and altered patterns of tactile perception in children with hemiparetic cerebral palsy and that these results would relate to neurobehavioral function.
Methods
The proof-of-concept study population consisted of 8 children between the ages of 6 and 8 years with a diagnosis of hemiparetic cerebral palsy who were participating in a constraint-induced movement therapy camp in the Department of Pediatric Rehabilitation at Vanderbilt University Medical Center. Criteria for entry into the camp were a minimum age equivalent of 60 months on the Ages and Stages Questionnaire in communication, problem solving, and social emotional domains. Cerebral palsy was classified according to published definitions15 and diagnosed by specialists in the pediatric neurology and the spasticity clinics at Vanderbilt. Functionality was graded according to the Gross Motor Function Classification Scale.16 Patient characteristics are described in Table 1. Patients all had a diagnosis of hemiparetic cerebral palsy, with a Gross Motor Classification score of 1 corresponding to high functionality. For all patients, there was either no impairment of finger extension or an impairment in a Zancolli I pattern17 (complete extension of the fingers or less than 20° of flexion with the wrist in neutral position). The affected side of hemiparesis was corroborated with the presence of a lesion on the contralateral side on neuroimaging, as documented by pediatric radiologists in the medical record. A majority of patients (5/8) had lesions consistent with sequelae of prematurity such as intraventricular hemorrhage and periventricular leukomalacia.
Table 1.
Patient Characteristics
| ID | Sex | Age, y | Affected side | GMFCS | MRI Findings | Zancolli |
|---|---|---|---|---|---|---|
| 1 | M | 8 | R | 1 | Mass lesion | 1 |
| 2 | M | 6 | L | 1 | IVH/PVL | 0 |
| 3 | M | 5 | L | 1 | IVH/PVL | 0 |
| 4 | F | 7 | R | 1 | IVH/PVL | 1 |
| 5 | M | 7 | L | 1 | IVH/PVL | 0 |
| 6 | F | 6 | R | 1 | IVH/PVL | 1 |
| 7 | F | 8 | L | 1 | Mass lesion | 1 |
| 8 | M | 6 | R | 1 | ICH | 0 |
Abbreviations: GMFCS, Gross Motor Classification Scale; ICH, intracranial hemorrhage; IVH, intraventricular hemorrhage; MRI, magnetic resonance imaging; PVL, periventricular leukomalacia; Zancolli, Zancolli classification of wrist.
Procedure
Tactile stimulation approximating light touch was delivered by means of air puffs emanating from a 1-mm nozzle positioned 0.5 cm below the tip of the index finger of the affected or unaffected hand. To ensure consistent distance from the nozzle to the finger across trials and across participants, the finger was placed in a mold holder and secured with Velcro tape. A researcher seated next to the child confirmed that proper finger position was maintained throughout the procedure. During each trial the E-Prime stimulus control application (v. 2.0, PST, Inc., Pittsburgh, Pennsylvania) sent 1 of 2 serial commands identifying a real puff or sham puff to a microcontroller (Arduino Uno, Smart Projects Snc, Scarmagno, Italy). The microcontroller then generated a 20-ms transistor-transistor logic (TTL) pulse to the corresponding digital output channel, split into 2 lines for digital input to the EEG recording system or to solenoid-gated air valves. The opening of both valves was marked in real-time in the EEG data stream. The valve inputs had a constant pressure of 40 psi supplied via compressor. The valve outputs had 4 ft of soft plastic tubing carrying air to both nozzles. To calculate force exerted, we measured the nozzle diameters and nozzle psi with a manometer (6″ 0–60 psi, accuracy ±0.3 psi; Trerice, Oak Park, Michigan). Applying the formula F(N) = Pressure × Area, we found that the force exerted from a 1-mm radius nozzle at 6 psi yielded F(N) = 0.03 lb. For comparison, this is equivalent to the force exerted by monofilaments used to evaluate loss of light touch sensation in patients with diabetic neuropathy. Using an oscilloscope and a microphone we also compared TTL pulse onset to air nozzle puff onset. The pulse to puff latency for both real and sham was 12 ms and was adjusted for post recording.
For each hand, 60 puff stimuli were presented in random order interspersed with 60 sham trials (an air puff delivered via a separate nozzle pointed away from the finger). To prevent habituation, no more than 2 repetitions of a puff or sham could occur in a row, and intertrial interval varied randomly between 2000 and 2500 ms. Each sequence of 120 trials lasted between 4.5 and 5 minutes.
To ensure children’s cooperation, air puffs were described as bubbles blown by fish in a fish tank (a decorated box concealing the puffer apparatus). Children were asked to guess whether each bubble was delivered by a blue or a red fish, but no responses were required during or after the task.
Event-Related Potential Acquisition
A high-density array net of 128 Ag/AgCl electrodes embedded in soft sponges (Geodesic Sensor Net, EGI, Inc., Eugene, Oregon) was used to record event-related potentials. Electrode impedance levels were adjusted to below 40 kΩ. Data were sampled at 1000 Hz with filters set to 0.1 to 400 Hz. During data collection, all electrodes were referred to Cz (re-referenced offline to an average reference). Recording of the brainwaves was controlled by Net Station software (v. 4.2; EGI, Inc.).
Event-Related Potential Analysis
Individual event-related potentials were derived by filtering the recorded data with a 0.3- to 40-Hz band pass filter and segmenting the ongoing EEG on stimulus (puff or sham) onset to include a 200-ms prestimulus baseline and a 700-ms poststimulus interval. Resulting segments were screened for motor and ocular artifacts using computer algorithms included in NetStation and then followed by a manual review. The automated screening criteria were set as follows: for the eye channels, voltage in excess of 140 μV was interpreted as an eye blink and voltage above 55 μV was considered to reflect eye movements. Any channel with voltage exceeding 200 μV was considered of poor quality. If more than 15 channels were considered of poor quality, the entire trial was discarded. Data from trials contaminated with eye blinks or eye movements were corrected using ocular artifact correction tool in NetStation. For motor and ocular artifact-free trials, data from poor quality channels were reconstructed using spherical spline interpolation procedures.
Next, event-related potentials were averaged, re-referenced to an average reference, and baseline-corrected. For a data set to be included in the statistical analyses, individual condition averages had to be based on a minimum of 10 trials. Trial retention rates were similar across stimulus conditions (affected hand: M puff = 23.13 ± 11.93, M sham = 28.25 ± 12.50; unaffected hand: M puff = 25.38 ± 11.60, M sham = 29.25 ± 10.65). There were no significant differences in the number of usable trials for puff vs sham or affected vs unaffected stimulation conditions.
In line with prior studies, only data from electrodes overlapping C3/C4, F3/F4, and F7/F8 locations (Figure 1) were included the statistical analyses. Using the NetStation statistical extraction tool, we obtained mean amplitude and peak latency measures for P50 (30–80 ms), N70 (50–100 ms), P100 (80–150 ms), N140 (130–230 ms), and P2 (250–350 ms) peaks. These data were derived for each selected electrode and then averaged within each cluster. Latency windows were determined based on the intervals used in prior studies and on the examination of the grand-averaged waveform. Separate repeated-measures analyses of variance with Stimulus (2: puff, sham) × Stimulation Side (2: affected, unaffected) × Electrode (3: C3/4, F3/4, F7/8) × Hemisphere (2: ipsilateral, contralateral to stimulation) within-subject factors and Huynh-Feldt correction were conducted for mean amplitude and latency measures.
Figure 1.

Distribution of scalp electrodes and selected regions of interest. F, frontal; C, central.
Because of experimenter error, data for the unaffected hand of 1 participant were sampled at 250 Hz instead of 1000 Hz and therefore are treated as missing data in the analyses described below. Including these data in the analyses, however, did not alter the findings.
Neurobehavioral Testing
The Quality of Upper Extremity Skills Test is a criterion-referenced quantitative measure of the quality of upper extremity movements completed by an occupational therapist and scored in domains of dissociated movement, grasp, protective extension, and weight bearing.18 Two-point discrimination was performed according to the methods validated by Klingels et al19 on the index finger of each hand and scored in millimeters, also reporting the difference between the affected and unaffected hand. Stereognosis was tested in the affected extremity using 6 object-pairs within the child’s familiar repertoire. Grip strength was tested using a calibrated Jamar dynamometer (Fabrication Enterprises, Inc., White Plains, New York). With the child sitting, arm adducted and elbow flexed at 90°, the mean of 3 voluntary contractions was recorded in each hand. The ratio of affected to unaffected hand was calculated to normalize for age.19
Results
Validation of the Puff vs Sham Model
The sham is an air puff directed away from the subject’s hand, allowing the sound of the air puff to be perceived. Auditory stimuli elicit cortical responses prior to 100 ms, consistent with the results of our paradigm. As can be seen in Figure 2, the sham trials produced low-amplitude responses under all conditions, and any effects were visible by 100 ms after stimulus onset. Specifically, analysis of P50 peak amplitude showed that there is a measurable difference between sham and air puff (Stimulus × Electrode × Hemisphere, F2,12 = 7.850, P = .010, partial η2 = 0.558). In particular, hemisphere differences were elicited by puff trials at central electrodes (ipsilateral < contralateral); (t6 = 3.710, P = .010), whereas there were no hemisphere differences for the sham trials. Similarly, hemisphere differences in N70 amplitude were present for puff trials at central electrodes (t6 = 4.322, P = .005), whereas there were no hemisphere differences for the sham trials. Furthermore, the amplitude of the N70 peak was greater for puff trials than sham trials over the central electrodes ipsilateral to stimulation, t6 = 2.522, P = .045 (Stimulus × Electrode × Hemisphere, F2,12 = 6.649, P = .011, partial η2 = 0.526). A main effect of air puff vs sham also demonstrated that P100 amplitude was more negative for puff than sham trials (Stimulus, F1,6 = 5.854, P = .052, partial η2 = 0.494). Finally, an interaction of Stimulus × Electrode (F2,12 = 9.663, P = .004, partial η2 = 0.617) indicated that a more negative N140 peak was recorded for puff than sham trials at central electrodes (t6 = 3.989, P = .007), whereas the direction of stimulus differences was reversed at frontal (F3/4) locations (t6 = .3.927, P = .008). Therefore, puff and sham trials elicit different brain responses within the first 140 ms after stimulus onset.
Figure 2.
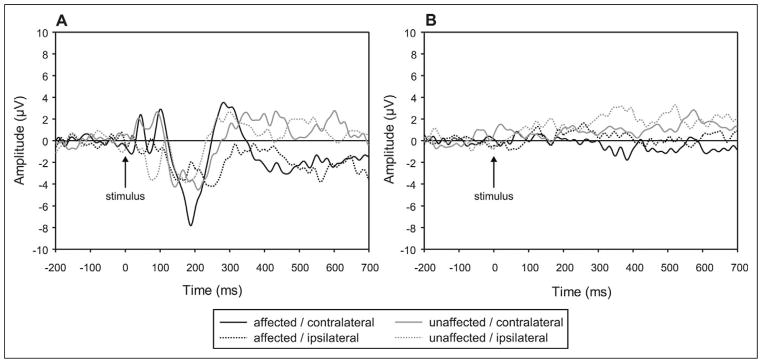
Comparison of cortical responses to air puff and sham control stimulation. (A) Air puff stimulation. (B) Sham control stimulation. All tracings represent grand averaged waveforms of all patients across all valid trials. Stimulus occurs at time 0 ms; background EEG shown before stimulus. Each tracing represents a specific hand (affected or unaffected) being stimulated and its corresponding response in the cortex (ipsilateral or contralateral to the stimulation).
Differences in Cortical Responses to Puff Trials Between Affected and Unaffected Hand
Early Response (P50, N70, P100 Peaks)
There were no significant main effects or interactions involving the side of stimulation for amplitude or latency measures for P50, N70, or P100 peaks, indicating no detectable cortical activity differences for puffs delivered to the affected and unaffected hand. However, as described above, the pattern of event-related potentials to puff stimuli varied across the 2 hemispheres. Compared with the contralateral hemiscalp sites, activity recorded over the hemisphere ipsilateral to the stimulated hand was associated with smaller P50 and larger N70 responses at central electrode locations. These patterns of the early cortical response to a somatosensory stimulus are consistent with documented responses to median nerve stimulation in normal subjects and could be attributed to activity in the primary sensory cortex18 (Figure 3).
Figure 3.

Characteristics of cortical responses to air puff stimulation. (A) Response on ipsilateral side to stimulation. (B) Response on side contralateral to stimulation. (C) Response to stimulation of affected hand. (D) Response to stimulation of unaffected hand. All tracings represent grand averaged waveforms of all patients across all valid trials. Stimulus occurs at time 0 ms; background EEG shown before stimulus.
Secondary Responses (N140 Peak)
N140 amplitude was larger (more negative) for stimulation of the affected than for the unaffected hand as reflected by the main effect of side in the analysis (F1,6 = 7.281, P = .036, partial η2 = 0.548). However, there were no significant main effects or interactions involving stimulation side for N140 latency.
Late Responses (P2) P2 Amplitude
Air puff stimulation of the affected hand resulted in larger contralateral than ipsilateral P2 peak (side, F1,6 = 5.688, P = .054, partial η2 = 0.487; t7 = 2.384, P = .049). There were no significant amplitude differences in the cortical signal on stimulation of the unaffected hand. Furthermore, the P2 elicited by stimulation of the affected hand was smaller than that of the unaffected hand in the ipsilateral hemisphere (t6 = 2.420, P = .052). The opposite direction of differences was observed for the contralateral hemisphere (t6 = 2.514, P = .046). In summary, the ipsilateral P2 is smaller for the affected than for the unaffected hand, whereas the contralateral P2 is larger for the affected hand than for the unaffected hand.
P2 latency
Stimulation of the affected hand results in longer latency for the ipsilateral than contralateral P200 response (Side × Hemisphere interaction, F1,6 = 18.997, P = .005, partial η2 = 0.760; t6 = 2.271, P = .064).
Correlations of Cortical Responses With Neurobehavioral and Neurosensory Functional Assessments
Table 2 illustrates the functional characteristics of the patient population as well as the significant correlations with event-related potential measures. The amplitude of the N140 peak on the contralateral side to stimulation correlated negatively with the difference in 2-point discrimination between affected and unaffected side (r = −0.818, P = .01). This indicated that as the difference in tactile perception between the affected and unaffected side increased, the N140 on the side contralateral to the stimulation increased (became more negative). Similarly as with grip, the more difference between the 2 hands, the larger the N140 peak (r = 0.826, P = .01): the grip ratio became smaller (more difference between the 2 hands) as the N140 peak became more negative (larger since the peak is in a negative direction). More complex neurobehavioral measures such as the QUEST and stereognosis correlated with findings in the P2 latency (r = −0.868 and r = −0.832 respectively, P = .01 for both), as better scores were associated with shorter latencies for the unaffected hand.
Table 2.
Correlations Between Event-Related Potential Measures and Neurobehavioral and Sensory Assessments
| Neurobehavioral Scores | Affected Extremity Stimulated, R
|
Unaffected Extremity Stimulated, R
|
|||
|---|---|---|---|---|---|
| N140 Ipsi | N140 Contra | P2 Ipsi | P2 Contra | ||
| QUESTa | 68.7 (12.3) | −0.868* | |||
| Stereognosis in affected handb | 4 (3–5) | −0.832* | |||
| 2 PD in unaffected handa | 2.4 (0.4) | −0.909** | |||
| 2 PD in affected handa | 3.6 (0.9) | −0.818* | |||
| 2 PD differencec | 1.1 | 0.885** | −0.823* | ||
| Grip in unaffected hand | 16.5 (8.1) | ||||
| Grip in affected hand | 3.9 (5.2) | 0.848** | |||
| Grip ratio | 0.05 | 0.826* | |||
Abbreviations: contra, contralateral; ipsi, ipsilateral; IQR, interquartile range; QUEST, Quality of Upper Extremity Skills Test; SD, standard deviation; 2 PD, 2-point discrimination.
Neurobehavioral score expressed as mean (SD).
Neurobehavioral score expressed as median (IQR).
Neurobehavioral score expressed as mean in mm.
P< .01.
P< .001.
Discussion
This study establishes the first standardized paradigm for measurement of cortical responses to light touch in children using current event-related potential technology. Our results are consistent with established literature on cortical responses to electrical or mechanical stimulation of fingers during a perceptual discrimination task.20–23 The 3 main time frames of the tactile cortical response described in adult studies can be observed in our pediatric population (see Table 3). The first processing stage, represented by P50 and N70 peaks, reflected activity in the primary sensory cortex.24 These responses typically do not require awareness of stimulation but may be modulated by gaze to or vision of stimulated limb or site.25–28 In our population of children with cerebral palsy, there were no observable differences between affected and unaffected hand in the responses attributable to the primary sensory cortex. As in other studies, the ipsilateral response is larger than the contralateral response.
Table 3.
Summary of Differences in Event-Related Potential Responses to Light Touch in Children With Hemiparetic Cerebral Palsy
| Functional Correspondence | Event-Related Potential Peaks | Characteristics of Response |
|---|---|---|
| Primary sensory cortex | P50 and N70 | No difference between affected and unaffected hand stimulation |
| Secondary sensory cortex | N140 | ↑ amplitude in affected compared with unaffected hand stimulation |
| Complex cognitive processing | P2 | ↓ amplitude ipsilateral and ↑ contralateral in affected compared with unaffected hand stimulation |
| ↑ latency ipsilateral in affected hand only compared with contralateral |
Our paradigm is also the first to compare a sham control to a tactile stimulus for P50 and N70. The importance of not requiring a discrimination task to obtain a stimulus-specific response in the primary somatosensory cortex lies in the application of the paradigm in noncooperative study populations. Additionally, the use of light touch instead of electrical or mechanical stimulation alleviates the methodological and ethical concerns of activating nociceptive receptors.29–31 Air puff vs sham puff stimulation can be comfortably and easily used across most pediatric populations, even in infants or other nonverbal vulnerable subjects.
A novel finding for children with hemiparetic cerebral palsy is that tactile stimulation of the hand on the affected side results in a larger N140 than on the unaffected side. The N140 peak reflects activity in the secondary sensory cortex.32,33 This response corresponds to conscious awareness of stimulation.34 Activity in the secondary sensory cortex may be modulated by attention to stimulation, with some studies suggesting associations with the frontoparietal attentional network.3 Our results suggest that young children with hemiparetic cerebral palsy may have similar generation of neural signals in the secondary sensory cortex as adults with stroke upon tactile stimulation of their affected extremities. It has been postulated that the N140 peak in patients with stroke is a larger, more discrete peak because spared neurons are relatively more synchronously and focally activated in response to tactile stimulation. Normal age-matched adult controls exhibited more diffuse, lower amplitude N140 peaks due to more widely distributed activation.36
The most interesting finding in children with cerebral palsy is that signals resulting from the stimulation of the affected hand take longer to produce a P2 peak on the ipsilateral than on the contralateral side. Furthermore, this ipsilateral P2 peak is smaller in amplitude than when the unaffected hand is stimulated. The P2 (also referred to as P3 or P300 in some studies) reflects early contributions of cognitive processes related to sensory stimulation. This peak is thought to reflect subjective attention to stimulation, possible involuntary orienting to strong stimuli.30,34 In concrete terms, whereas N140 corresponds to “something has touched me,” P2 reflects a more specific idea “an air puff touched my index finger.” The finding that children with cerebral palsy have differences in the laterality of their P2 in response to light touch suggests altered connectivity between ipsilateral and contralateral sides of the cortex involved in higher order sensory perception.
Finally, correlations between event-related potential measures and neurobehavioral and neurosensory functional assessments confirm this altered connectivity in sensory perception. Children with less asymmetry in their grip strength and less difference in 2-point discrimination between their 2 hands also showed smaller N140 peaks. This is again consistent with findings showing a more diffuse, smaller amplitude peak in normal subjects compared with stroke patients, especially if these stroke patients had received somatosensory training.36 In our study, better hand function in a child with a unilateral lesion also correlated with a smaller N140. More complex functions such as those tested in the QUEST and stereognosis tasks involve not only somatosensory perception but also motor and cognitive processes. It is therefore reassuring to note that better performance on these tests correlated well with decreased latency of the P2 peaks. Children with better function of their affected hand were those with faster complex processing of light touch in their affected extremity.
In summary, this study demonstrates that event-related potentials in response to light touch can be used to characterize cortical responses in children, in both affected and unaffected extremities, without the need for participation in uncomfortable or active discrimination paradigms. Our paradigm has the potential to be used by others in studies evaluating not only somatosensory perception but also rehabilitative interventions. We will use this paradigm to study the longer term effects of constraint-induced movement therapy on the tactile response in our study group. Future research using this tool can also incorporate participants from newborns to older children in multiple settings due to the portability of event-related potential technology and in combination with other established event-related potential paradigms.
Acknowledgments
Funding
The authors disclosed receipt of the following financial support for the research, authorship, and/or publication of this article: This study was supported in part by the Vanderbilt CTSA grant (UL1 RR024975-01) from NCRR/NIH and by National Institute of Child Health and Development Grant (P30HD15052) to the Vanderbilt Kennedy Center for Research on Human Development.
Footnotes
Author Contributions
NM formulated the hypothesis, designed the study and stimulus, enrolled the patients, calculated and entered the neurobehavioral data, and wrote all drafts of the manuscript. NM and AK performed the statistical analysis. AK designed the electrophysiology acquisition paradigm, obtained and processed all electrophysiology data, performed statistical analyses, and provided reference to established literature in the field. ZB designed the hardware and software connecting the stimulation apparatus to the recording computer and tested all setup parameters. AK and ZB contributed to the first draft and revisions of the manuscript.
Declaration of Conflicting Interests
The authors declared no potential conflicts of interest with respect to the research, authorship, and/or publication of this article.
Ethical Approval
All patients and parents were recruited according to Vanderbilt IRB approved protocols.
Reprints and permission: sagepub.com/journalsPermissions.nav
References
- 1.Greenough WT, Black JE, Wallace CS. Experience and brain development. Child Dev. 1987;58:539–559. [PubMed] [Google Scholar]
- 2.Grossman AW, Churchill JD, McKinney BC, Kodish IM, Otte SL, Greenough WT. Experience effects on brain development: possible contributions to psychopathology. J Child Psychol Psychiatry. 2003;44:33–63. doi: 10.1111/1469-7610.t01-1-00102. [DOI] [PubMed] [Google Scholar]
- 3.Markham JA, Greenough WT. Experience-driven brain plasticity: beyond the synapse. Neuron Glia Biol. 2004;1:351–363. doi: 10.1017/s1740925x05000219. [DOI] [PMC free article] [PubMed] [Google Scholar]
- 4.Philbin MK, Lickliter R, Graven SN. Sensory experience and the developing organism: a history of ideas and view to the future. J Perinatol. 2000;20:S2–S5. doi: 10.1038/sj.jp.7200434. [DOI] [PubMed] [Google Scholar]
- 5.Johnston MV, Ishida A, Ishida WN, Matsushita HB, Nishimura A, Tsuji M. Plasticity and injury in the developing brain. Brain Dev. 2009;31:1–10. doi: 10.1016/j.braindev.2008.03.014. [DOI] [PMC free article] [PubMed] [Google Scholar]
- 6.Lickliter R. Atypical perinatal sensory stimulation and early perceptual development: insights from developmental psychobiology. J Perinatol. 2000;20:S45–S54. doi: 10.1038/sj.jp.7200450. [DOI] [PubMed] [Google Scholar]
- 7.Lickliter R. The role of sensory stimulation in perinatal development: insights from comparative research for care of the high-risk infant. J Dev Behav Pediatr. 2000;21:437–447. [PubMed] [Google Scholar]
- 8.Schweizer R, Voit D, Frahm J. Finger representations in human primary somatosensory cortex as revealed by high-resolution functional MRI of tactile stimulation. Neuroimage. 2008;42:28–35. doi: 10.1016/j.neuroimage.2008.04.184. [DOI] [PubMed] [Google Scholar]
- 9.Staudt M. Reorganization after pre- and perinatal brain lesions. J Anat. 2010;217:469–474. doi: 10.1111/j.1469-7580.2010.01262.x. [DOI] [PMC free article] [PubMed] [Google Scholar]
- 10.Wang CL, Zhang L, Zhou Y, et al. Activity-dependent development of callosal projections in the somatosensory cortex. J Neurosci. 2007;27:11334–11342. doi: 10.1523/JNEUROSCI.3380-07.2007. [DOI] [PMC free article] [PubMed] [Google Scholar]
- 11.Hamzei F, Dettmers C, Rijntjes M, Weiller C. The effect of corticospinal tract damage on primary sensorimotor cortex activation after rehabilitation therapy. Exp Brain Res. 2008;190:329–336. doi: 10.1007/s00221-008-1474-x. [DOI] [PubMed] [Google Scholar]
- 12.Hamzei F, Liepert J, Dettmers C, Weiller C, Rijntjes M. Two different reorganization patterns after rehabilitative therapy: an exploratory study with fMRI and TMS. Neuroimage. 2006;31:710–720. doi: 10.1016/j.neuroimage.2005.12.035. [DOI] [PubMed] [Google Scholar]
- 13.Key AP, Dove GO, Maguire MJ. Linking brainwaves to the brain: an ERP primer. Dev Neuropsychol. 2005;27:183–215. doi: 10.1207/s15326942dn2702_1. [DOI] [PubMed] [Google Scholar]
- 14.deRegnier RA. Neurophysiologic evaluation of early cognitive development in high-risk infants and toddlers. Ment Retard Dev Disabil Res Rev. 2005;11:317–324. doi: 10.1002/mrdd.20085. [DOI] [PubMed] [Google Scholar]
- 15.Rosenbaum P, Paneth N, Leviton A, et al. A report: the definition and classification of cerebral palsy April 2006. Dev Med Child Neurol Suppl. 2007;109:8–14. [PubMed] [Google Scholar]
- 16.Palisano RJ, Rosenbaum P, Bartlett D, Livingston MH. Content validity of the expanded and revised Gross Motor Function Classification System. Dev Med Child Neurol. 2008;50:744–750. doi: 10.1111/j.1469-8749.2008.03089.x. [DOI] [PubMed] [Google Scholar]
- 17.Zancolli EA, Zancolli ER., Jr Surgical management of the hemiplegic spastic hand in cerebral palsy. Surg Clin North Am. 1981;61:395–406. doi: 10.1016/s0039-6109(16)42389-3. [DOI] [PubMed] [Google Scholar]
- 18.Thorley M, Lannin N, Cusick A, Novak I, Boyd R. Reliability of the quality of upper extremity skills test for children with cerebral palsy aged 2 to 12 years. Phys Occup Ther Pediatr. doi: 10.3109/01942638.2011.602389. [published online ahead ofprint August 15, 2011] [DOI] [PubMed] [Google Scholar]
- 19.Klingels K, De Cock P, Molenaers G, et al. Upper limb motor and sensory impairments in children with hemiplegic cerebral palsy: can they be measured reliably? Disabil Rehabil. 2010;32:409–416. doi: 10.3109/09638280903171469. [DOI] [PubMed] [Google Scholar]
- 20.Boor R, Goebel B, Taylor MJ. Subcortical somatosensory evoked potentials after median nerve stimulation in children. Eur J Paediatr Neurol. 1998;2:137–143. doi: 10.1016/s1090-3798(98)80029-9. [DOI] [PubMed] [Google Scholar]
- 21.Majnemer A, Rosenblatt B, Riley P, Laureau E, O’Gorman AM. Somatosensory evoked response abnormalities in high-risk newborns. Pediatr Neurol. 1987;3:350–355. doi: 10.1016/0887-8994(87)90006-3. [DOI] [PubMed] [Google Scholar]
- 22.Majnemer A, Rosenblatt B, Willis D, Lavallee J. The effect of gestational age at birth on somatosensory-evoked potentials performed at term. J Child Neurol. 1990;5:329–335. doi: 10.1177/088307389000500412. [DOI] [PubMed] [Google Scholar]
- 23.Restuccia D, Zanini S, Cazzagon M, Del Piero I, Martucci L, Della Marca G. Somatosensory mismatch negativity in healthy children. Dev Med Child Neurol. 2009;51:991–998. doi: 10.1111/j.1469-8749.2009.03367.x. [DOI] [PubMed] [Google Scholar]
- 24.Hamalainen H, Kekoni J, Sams M, Reinikainen K, Naatanen R. Human somatosensory evoked potentials to mechanical pulses and vibration: contributions of SI and SII somatosensory cortices to P50 and P100 components. Electroencephalogr Clin Neurophysiol. 1990;75:13–21. doi: 10.1016/0013-4694(90)90148-d. [DOI] [PubMed] [Google Scholar]
- 25.Forster B, Eimer M. Vision and gaze direction modulate tactile processing in somatosensory cortex: evidence from event-related brain potentials. Exp Brain Res. 2005;165:8–18. doi: 10.1007/s00221-005-2274-1. [DOI] [PubMed] [Google Scholar]
- 26.Gotz T, Huonker R, Miltner WH, Witte OW, Dettner K, Weiss T. Task requirements change signal strength of the primary somatosensory M50: oddball vs. one-back tasks. Psychophysiology. 2011;48:569–577. doi: 10.1111/j.1469-8986.2010.01116.x. [DOI] [PubMed] [Google Scholar]
- 27.Iguchi Y, Hoshi Y, Tanosaki M, Taira M, Hashimoto I. Selective attention regulates spatial and intensity information processing in the human primary somatosensory cortex. Neuroreport. 2002;13:2335–2339. doi: 10.1097/00001756-200212030-00033. [DOI] [PubMed] [Google Scholar]
- 28.Iguchi Y, Hoshi Y, Tanosaki M, Taira M, Hashimoto I. Attention induces reciprocal activity in the human somatosensory cortex enhancing relevant- and suppressing irrelevant inputs from fingers. Clin Neurophysiol. 2005;116:1077–1087. doi: 10.1016/j.clinph.2004.12.005. [DOI] [PubMed] [Google Scholar]
- 29.Anand KJ, Scalzo FM. Can adverse neonatal experiences alter brain development and subsequent behavior? Biol Neonate. 2000;77:69–82. doi: 10.1159/000014197. [DOI] [PubMed] [Google Scholar]
- 30.Fabrizi L, Slater R, Worley A, et al. A shift in sensory processing that enables the developing human brain to discriminate touch from pain. Curr Biol. 2011;21:1552–1558. doi: 10.1016/j.cub.2011.08.010. [DOI] [PMC free article] [PubMed] [Google Scholar]
- 31.Nakanishi T, Shimada Y, Toyokura Y. Somatosensory evoked responses to mechanical stimulation in normal subjects and in patients with neurological disorders. J Neurol Sci. 1974;21:289–298. doi: 10.1016/0022-510x(74)90173-7. [DOI] [PubMed] [Google Scholar]
- 32.Iguchi Y, Hoshi Y, Nemoto M, Taira M, Hashimoto I. Co-activation of the secondary somatosensory and auditory cortices facilitates frequency discrimination of vibrotactile stimuli. Neuroscience. 2007;148:461–472. doi: 10.1016/j.neuroscience.2007.06.004. [DOI] [PubMed] [Google Scholar]
- 33.Schubert R, Blankenburg F, Lemm S, Villringer A, Curio G. Now you feel it—now you don’t: ERP correlates of somatosensory awareness. Psychophysiology. 2006;43:31–40. doi: 10.1111/j.1469-8986.2006.00379.x. [DOI] [PubMed] [Google Scholar]
- 34.Tamura Y, Hoshiyama M, Inui K, et al. Cognitive processes in two-point discrimination: an ERP study. Clin Neurophysiol. 2004;115:1875–1884. doi: 10.1016/j.clinph.2004.03.018. [DOI] [PubMed] [Google Scholar]
- 35.Eimer M, Forster B. Modulations of early somatosensory ERP components by transient and sustained spatial attention. Exp Brain Res. 2003;151:24–31. doi: 10.1007/s00221-003-1437-1. [DOI] [PubMed] [Google Scholar]
- 36.Giaquinto S, Fraioli L. Enhancement of the somatosensory N140 component during attentional training after stroke. Clin Neurophysiol. 2003;114:329–335. doi: 10.1016/s1388-2457(02)00324-3. [DOI] [PubMed] [Google Scholar]