

Abstract
Objectives
Features of eosinophilic esophagitis (EoE) and gastroesophageal reflux disease (GERD) overlap. We aimed to determine whether staining for tissue biomarkers would differentiate EoE from GERD, suggesting utility for diagnosis of EoE.
Methods
In this case-control study, EoE patients defined by consensus guidelines were compared to GERD patients with eosinophils on esophageal biopsy. Immunohistochemistry was performed for major basic protein (MBP), eotaxin-3, leukotriene A4 hydrolase (LTA4H), and leukotriene C4 synthase (LTC4S). After masking, the maximum staining density (cells/mm2) was quantified for each marker and compared between groups. Receiver operator characteristic curves were constructed, and the area under the curve (AUC) calculated to assess the diagnostic utility of each of the biomarkers alone and in combination with eosinophil counts.
Results
There were 51 EoE cases (mean age 24; mean 143 eos/hpf) and 54 GERD controls (mean age 34; mean 20 eos/hpf). The MBP density was higher in EoE than in GERD (1479 vs 59 cells/mm2; p<0.001), as was the eotaxin-3 density (2219 vs 479; p<0.001). There were no differences for LTA4H and LTC4S. MBP density and eosinophil count correlated (R=0.81; p<0.001); correlation with eotaxin-3 was weaker (R=0.25; p=0.01). The AUC for diagnosis of EoE was 0.96 for MBP, 0.87 for eotaxin-3, 0.58 for LTA4H, 0.66 for LTC4S, and 0.99 for the combination of MBP, eotaxin-3, and eosinophil count.
Conclusions
Patients with EoE had substantially higher levels of MBP and eotaxin-3 staining than GERD patients. These markers may have utility as a diagnostic assay for EoE.
Keywords: eosinophilic esophagitis, diagnosis, major basic protein, eotaxin-3, leukotriene
Introduction
Eosinophilic esophagitis is a chronic immune-mediated disease characterized by symptoms of esophageal dysfunction and a marked esophageal epithelial eosinophilic infiltrate, in the absence of other potential causes of esophageal eosinophilia (1, 2). The clinical and histologic features of EoE are not specific (1), and may overlap substantially with features of gastroesophageal reflux disease (GERD) (1, 3, 4). Symptoms such as dysphagia and heartburn are common in both conditions (1, 2, 5–9), and esophageal eosinophilia, presumably the pathologic hallmark of EoE, is commonly seen on esophageal biopsies in GERD as well (10–12). Therefore, it is often a major clinical challenge to differentiate EoE and GERD.
Use of tissue biomarkers of eosinophil activation or inflammation may represent a more efficient and pathophysiologically-based means for diagnosis of EoE and distinguishing it from GERD (13, 14). The pathogenesis of EoE is felt to involve a Th2 response to allergen exposure in which esophageal epithelial cells are stimulated to produce eotaxin-3, which in turn leads to eosinophil activation and release of intracellular granules, including major basic protein (MBP) (15–17). Other allergic pro-inflammatory mediators, including enzymes in the arachidonic acid pathway such as leukotriene A4 hydrolase (LTA4H) and leukotriene C4 synthase (LTC4S) that metabolize leukotriene precursors, may also be involved (18, 19). While MBP and other eosinophil granule proteins have been shown to be more commonly found in EoE (20–26), transcription of eotaxin-3 is highly upregulated in EoE (27–31), and there is differential gene expression of LTA4H and LTCS4 (27), the diagnostic utility of these factors has not been established in EoE.
The aims of this study were to determine whether staining for MBP, eotaxin-3, LTA4H, and LTC4S in the esophageal epithelium differentiates EoE from GERD, and to assess the utility of these assays for diagnosis of EoE. We hypothesized that patients with EoE would have a greater number of cells staining for all of the selected tissue biomarkers, and that increasing numbers of positively staining cells would correctly predict EoE case status.
Methods
Study design and patients
We conducted a case-control study of subjects in the University of North Carolina (UNC) EoE Clinicopathologic database from 2000–2007. Details of the development of this database and selected patient characteristics have previously been described (7, 14, 32).
Cases were patients of any age who had a new diagnosis of EoE as defined by the 2007 consensus guidelines (2). Because the majority of the cases were evaluated prior to the publication of the guidelines, only those patients explicitly meeting all of the diagnostic criteria when applied retrospectively were included in this study. Specifically, cases were required to have at least one typical symptom of esophageal dysfunction (for example dysphagia, food impaction, heartburn, or feeding intolerance); at least 15 eosinophils per high-power field (eos/hpf) on esophageal biopsy; and had other causes of esophageal eosinophilia, including reflux disease, excluded. GERD was excluded by documenting persistent esophageal eosinophilia and symptoms despite high-dose acid suppression at the time of biopsy (n = 32), by documenting persistent esophageal eosinophilia despite prior symptoms refractory to high-dose acid-suppression (n = 15), or with negative pH monitoring (n = 4). Of note, these cases have previously been extensively characterized with confirmation of the diagnosis of EoE (9, 14).
Controls were GERD patients of any age who underwent esophagogastroduodenoscopy (EGD) and biopsy during the same time frame as the cases. GERD patients were defined by having at least one typical symptom, including heartburn, regurgitation, pain, or, in children, failure to thrive, which responded to anti-secretory therapy with either a proton pump inhibitor (PPI) or a H2 receptor blocker. In addition, inflammation, including at least 1 eos/hpf, was required on biopsy, and other competing causes of the presentation were excluded by the clinical evaluation. We required some degree of eosinophilia in our GERD control population to generate a clinically ambiguous group in whom EoE might be misdiagnosed, and where the diagnostic challenge to the clinician was present. This group was felt to have the most potential to benefit from an assay differentiating GERD from EoE.
Clinical data were extracted from the electronic medical record and endoscopy reports. Factors of interest included: demographics (age at diagnosis, gender, race); symptoms; co-existing atopic disease (allergic rhinitis or sinusitis, asthma, or documented food allergy demonstrated by either symptomatic evidence of allergy with reintroduction of a food or by testing directed by an Allergist; and endoscopic findings (rings, linear furrows, white plaques or exudates, erosive esophagitis, and hiatal hernia).
Histology and immunohistochemistry
For histologic assessment, archived pathology slides were re-reviewed by the study pathologists to determine eosinophil counts using a previously validated protocol (33). To summarize, slides were masked as to case and control status and the maximum eosinophil density (eosinophils/mm2 [eos/mm2]) was determined after examination of five microscopy fields. For purposes of comparison to previous studies, eosinophil density was then converted to eos/hpf for an assumed hpf size of 0.24 mm2, the size of an average field as reported in the literature (7).
For immunohistochemistry (IHC), formalin-fixed paraffin-embedded tissue blocks were masked to case and control status, sectioned (5 microns thick), and randomly sorted. Using a high volume automated system (Dako Autostainer; Dako, Carpinteria, CA), IHC was performed according to the following protocol. Slides were deparaffinized with xylene, steam-treated for antigen retrieval (Target Retrieval Solution; Dako), incubated with the primary antibodies of interest, incubated with a peroxidase-labelled anti-mouse polymer secondary antibody (Envision; Dako), stained with a diaminobenzidine chromogen (DAB; Innovex Biosciences, Richmond, CA), and then counterstained with hematoxylin. The primary antibodies included: anti-MBP (mouse, clone BMK 13, 1:40 dilution, AbD Serotec, Kidlington, UK and Raleigh, NC); anti-eotaxin-3 (mouse, #500-P156G, 1:50 dilution, PeproTech, Rocky Hill, NJ), anti-LTA4H (rabbit, #160250, 1:300 dilution, Cayman Chemical, Ann Arbor, MI); and anti-LTC4S (rabbit, #20108, 1:200 dilution, Santa Cruz Biotechnology, Santa Cruz, CA). Lung, skin, and esophageal tissue were used as controls, as per manufacturer recommendations. Positive control slides were incubated with primary antibody while only antibody diluent (Dako, Carpinteria, CA) was added to the negative control slides.
In a protocol that mirrored the one used for the eosinophil counts, the IHC glass slides were scanned and converted to digital slides, and viewed with Aperio ImageScope (Aperio Technologies, Vista, CA) (33). The maximum density of cells that stained positive for each antibody of interest in the esophageal epithelial layer was quantified (cells/mm2) in five microscopy fields using the Aperio Positive Pixel Count Algorithm (version 9.1, Aperio Technologies) (32).
Statistical analysis
Summary statistics were used to characterize the cases and controls. Bivariate analysis was performed with Chi-square for categorical variables, and t-tests or Wilcoxon-Rank-sum tests for continuous variables as appropriate. Correlations between eosinophil counts and positively staining cells for each of the four antibodies were calculated by Pearson’s Rho (R). Receiver operating characteristic (ROC) curves were constructed using EoE case status as defined by the consensus diagnostic guidelines as the gold standard. The area under the curve (AUC) was calculated and compared for seven different models predicting EoE case status: MBP alone; eotaxin-3 alone; LTA4H alone; LTC4S alone; eosinophil count alone; a combined model containing MBP and eotaxin-3; and a combined model containing MBP, eotaxin-3, and the eosinophil count.
To assess possible confounding and misclassification of controls, we performed two pre-planned sensitivity analyses. For the first, we limited the control group to only those with erosive esophagitis noted on endoscopy in order to provide a comparison group with documented pathologic acid exposure. For the second, we limited the control group to those with ≥15 eos/hpf on esophageal biopsy. This focused the analysis on the GERD patients with the highest levels of esophageal eosinophilia in whom the clinical diagnosis of EoE would be most difficult. We also compared this GERD sub-population to the EoE cases with fewer < 100 eos/hpf to further examine cases that might be clinically ambiguous. For these comparisons, we repeated the bivariate and ROC analyses. In addition to these sensitivity analyses we also repeated the main analyses after stratifying cases and control by age (adults ≥ 18 years vs children < 18 years), and for the subset of EoE cases without erosive esophagitis on initial endoscopy.
All analyses were performed using Stata version 9 (Statacorp, College Station, TX). This study was approved by the UNC Institutional Review Board.
Results
Patient characteristics
A total of 51 EoE cases and 54 GERD controls were included in this study (Table 1). EoE cases were younger than GERD controls (24 vs 34 years; p = 0.01), had more dysphagia (72% vs 31%; p < 0.001), and had more atopic diseases and food allergy. While the presence of a hiatal hernia was more common in the GERD group, the other typical endoscopic findings of EoE, including rings, furrows, and plaques, were more common in the EoE group. The maximum eosinophil count was higher in the EoE group as compared to the GERD group (143 vs 20 eos/hpf; p < 0.001), and EoE patients more commonly had eosinophil degranulation, eosinophil microabscesses, and spongiosis (94%, 92%, and 92%, respectively) compared with the GERD patients (43%, 11%, and 43%, respectively; p < 0.001 for all). As expected based on the control group definition, esophageal eosinophilia was prominent in the GERD patients, mimicking the clinical situation in which is it challenging to distinguish EoE and GERD.
Table 1.
Patient characteristics
| EoE (n = 51) |
GERD (n = 54) |
p value* | |
|---|---|---|---|
| Clinical characteristics | |||
| Mean age at biopsy (± SD) | 24.2 ± 17.9 | 34.4 ± 22.0 | 0.01 |
| Male subjects (n, %) | 35 (69) | 33 (61) | 0.65 |
| Caucasian subjects (n, %) | 43 (84) | 49 (91) | 0.39 |
| Symptoms (n, %)† | |||
| Dysphagia | 36 (72) | 15 (31) | < 0.001 |
| Food impaction | 12 (27) | 1 (2) | 0.001 |
| Heartburn | 16 (36) | 28 (57) | 0.04 |
| Abdominal pain | 12 (27) | 20 (43) | 0.09 |
| Failure to thrive | 8 (19) | 6 (13) | 0.50 |
| Atopic disease (n, %) | |||
| Allergic rhinitis/dermatitis | 15 (34) | 5 (11) | 0.008 |
| Food allergy | 5 (15) | 1 (2) | 0.034 |
| Asthma | 11 (24) | 3 (6) | 0.02 |
| Endoscopic characteristics | |||
| EGD findings (n, %)† | |||
| Normal | 7 (15) | 16 (30) | 0.07 |
| Rings | 17 (35) | 4 (7) | < 0.001 |
| Linear furrows | 12 (25) | 0 | < 0.001 |
| White plaques | 7 (15) | 0 | 0.004 |
| Erosive esophagitis | 16 (33) | 17 (31) | 0.84 |
| Hiatal hernia | 0 | 19 (35) | < 0.001 |
| Histologic characteristics | |||
| Max eosinophil density (eos/mm2) | |||
| Mean (± SD) | 597 ± 485 | 85 ± 93 | < 0.001 |
| Max eosinophil count‡ | |||
| Mean (± SD) | 143 ± 116 | 20 ± 22 | < 0.001 |
| Histologic findings (n, %) | |||
| Degranulation present | 47 (94) | 23 (43) | < 0.001 |
| Microabscess present | 36 (72) | 6 (11) | < 0.001 |
| Spongiosis present | 46 (92) | 23 (43) | < 0.001 |
p value calculated with t-test for continuous variables and chi-square for categorical variables.
Patients could have more than one symptom or endoscopic characteristic.
Determined from examination of 5 microscopy fields and calculated for a hpf area = 0.24 mm2.
MBP and eotaxin-3 staining in cases and controls
There was increased MBP and eotaxin-3 staining in EoE as compared to GERD (Figure 1A). This impression was documented in the quantitative analysis (Table 2). The maximum MBP staining density was significantly higher in the EoE group than in the GERD group (1479 vs 59 cells/mm2; p < 0.001), as was the maximum eotaxin-3 staining density (2219 vs 479 cells/mm2; p < 0.001). A graphic representation of the MBP and eotaxin-3 staining distributions (Figure 2A) demonstrates that the groups have substantially different distributions, with relatively little overlap. These results were unchanged after the sensitivity analysis limiting the GERD control group to only those with erosive reflux disease (n = 17; maximum eosinophil count 25 ± 19 eos/hpf) or to only those with an esophageal eosinophil count of ≥ 15 eos/hpf (n = 26; maximum eosinophil count 36 ± 23; data not shown). In the overall study population, while MBP density and eosinophil count strongly correlated (R = 0.81; p < 0.001), correlation with eotaxin-3 was weaker (R = 0.25; p = 0.01). These results also persisted after accounting for the different age distribution in the case and control groups.
Figure 1.
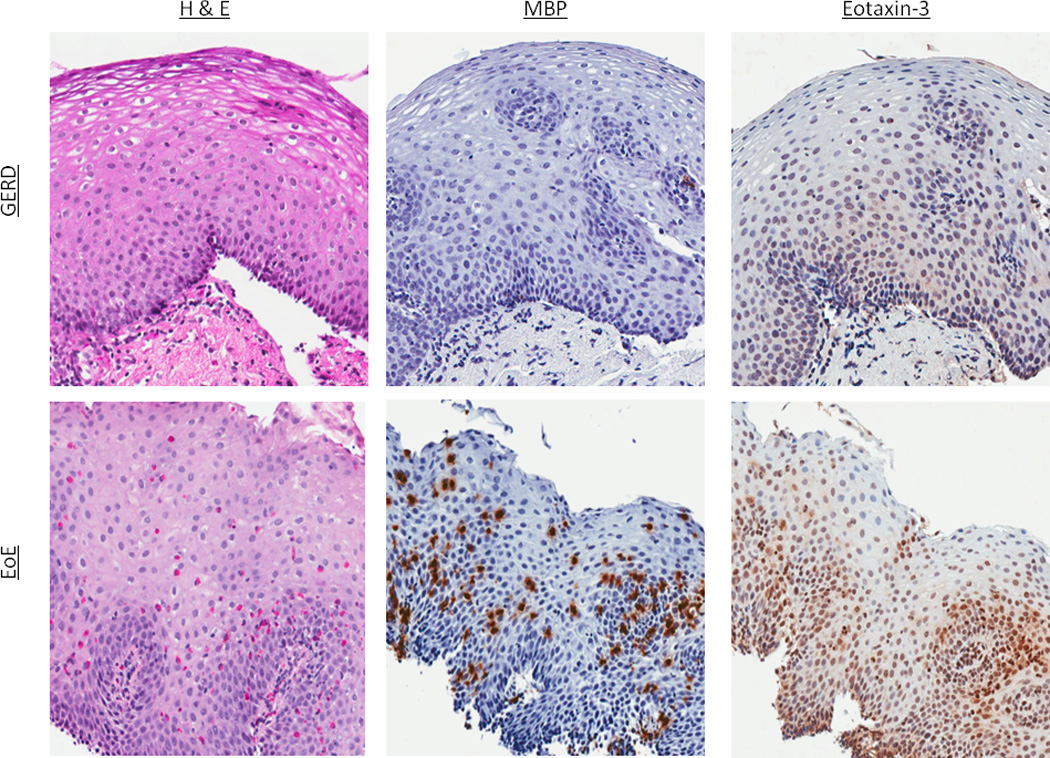
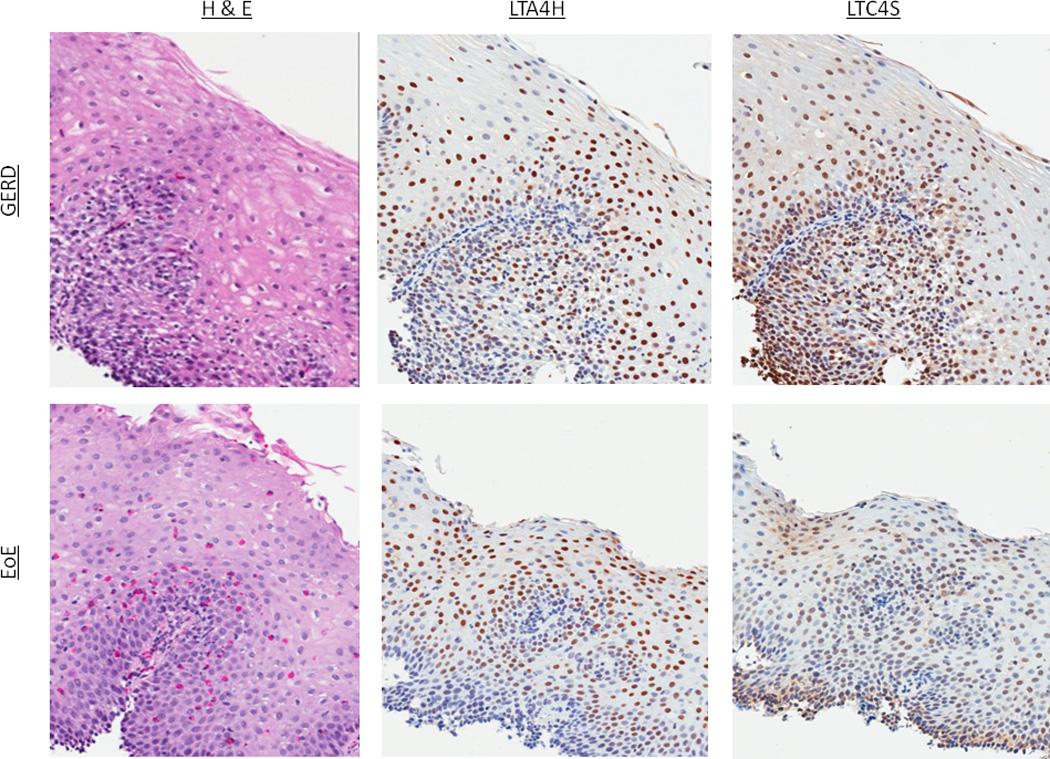
Representative examples of immunohistochemistry staining. (A) H&E, MBP, and eotaxin-3 staining in a GERD and EoE patient. For H&E staining in GERD, there is basal layer thickening, spongiosis, and an isolated eosinophil. In EoE, there is a brisk eosinophilia. For IHC for both MBP and eotaxin-3, increased staining in EoE compared to GERD can be appreciated (B) H&E, LTA4H, and LTC4S staining in a GERD and EoE patient. In this instance, there are no qualitative differences in the IHC even though esophageal eosinophilia is present in the EoE patient.
Table 2.
Immunohistochemistry characteristics
| EoE | GERD | p value* | |
|---|---|---|---|
| Max major basic protein staining | |||
| Mean cells/mm2 ± SD | 1,479 ± 1,290 | 59 ± 103 | < 0.001 |
| Median cells/mm2 (IQR) | 1,076 (577–1959) | 18 (4–58) | < 0.001 |
| Max eotaxin-3 staining | |||
| Mean cells/mm2 ± SD | 2,219 ± 1,782 | 479 ± 777 | < 0.001 |
| Median cells/mm2 (IQR) | 1,880 (709–3466) | 295 (151–576) | < 0.001 |
| Max LTA4H staining | |||
| Mean cells/mm2 ± SD | 575 ± 351 | 483 ± 353 | 0.16 |
| Median cells/mm2 (IQR) | 579 (255–805) | 426 (223–645) | 0.16 |
| Max LTC4S staining | |||
| Mean cells/mm2 ± SD | 201 ± 187 | 388 ± 322 | 0.001 |
| Median cells/mm2 (IQR) | 140 (77–278) | 228 (116–584) | 0.003 |
p value calculated with t-test for means and Wilcoxon rank sum for medians
Figure 2.
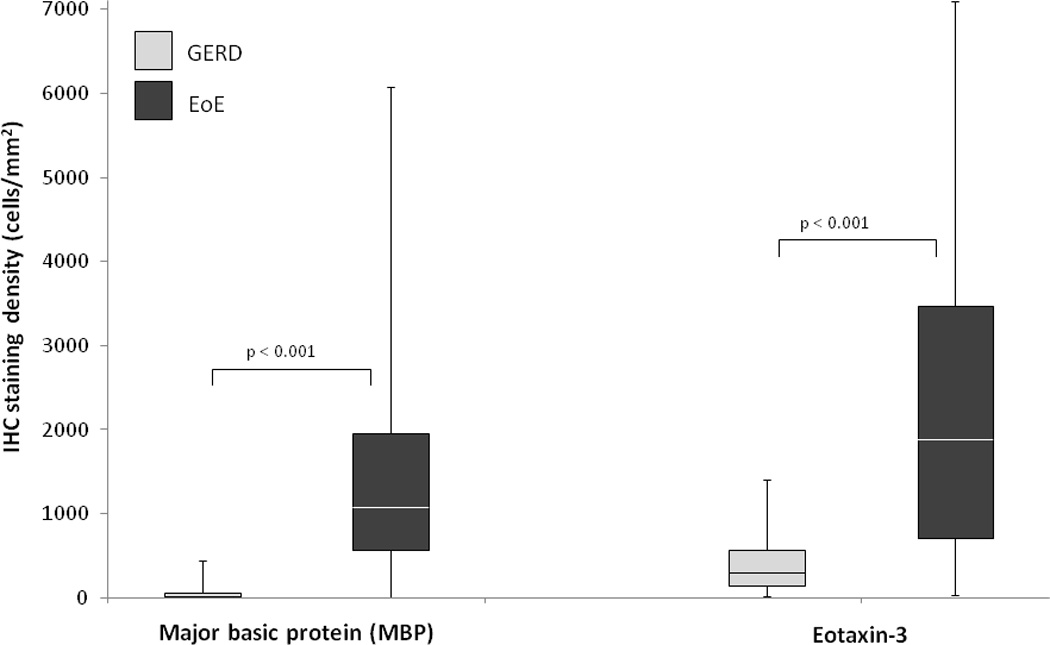
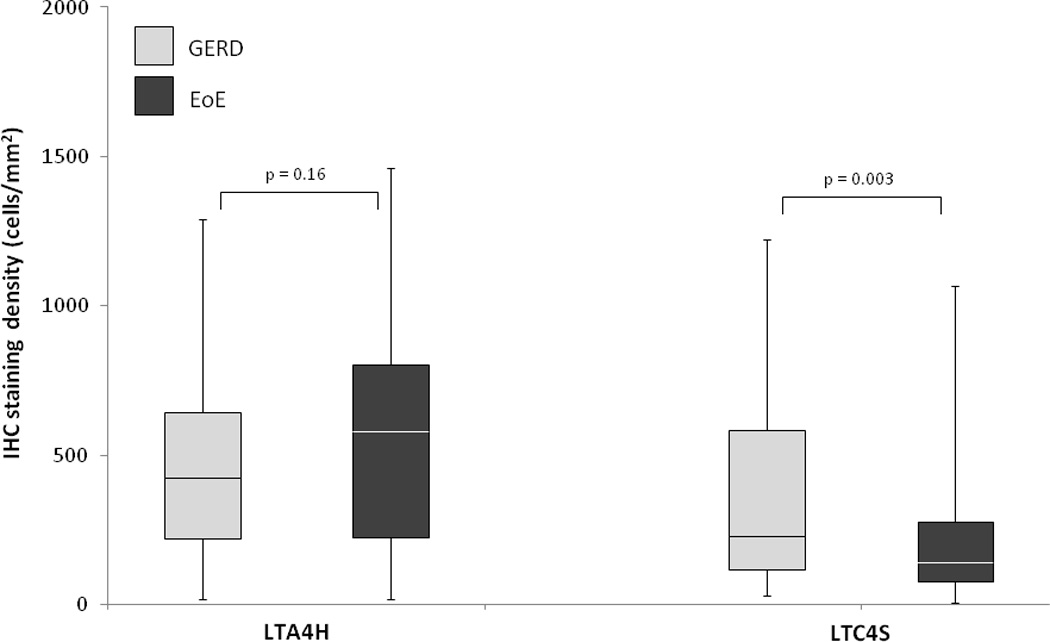
Box and whiskers plots of staining density (mast cells/mm2) in the EoE and GERD groups for (A) MBP and eotaxin-3, and (B) LTA4H and LTC4H. The median value for each group is noted with the white line, the boxes represent the range of values from the 25th percentile to the 75th percentile, the ends of the whiskers represent the 10th and 90th percentile of values, and the dots are the maximum and minimum values.
LTA4H and LTC4S staining in cases and controls
In contrast, there were few appreciable qualitative differences in LTA4H and LTC4S staining between the EoE and GERD groups (Figure 1B). On quantitative analysis (Table 2), there was no difference in LTA4H staining density in the EoE and GERD groups (575 vs 483 cells/mm2; p = 0.16), and LTC4S staining was somewhat lower in EoE as compared with GERD (201 vs 388 cells/mm2; p = 0.001). When plotted, the case and controls had substantial overlap in the staining distributions of both of these markers (Figure 2B). There was poor to weak correlation between the eosinophil count and LTA4H (R = −0.02; p = 0.85) and LTC4S (R = −0.24; p = 0.02). These results were also unchanged after sensitivity analysis (data not shown).
Tissue biomarkers for diagnosis of EoE
To investigate the utility of each of the four tissue biomarkers for diagnosis of EoE, ROC curves were constructed (Figure 3). When MBP staining alone was used as the only parameter in the model, it yielded an AUC of 0.96 for diagnosis of EoE as compared to consensus guidelines as the gold standard. Using eotaxin-3 alone, the AUC was 0.87. The AUCs for LTA4H and LTC4S were 0.58 and 0.66, respectively. For comparison, the AUC for the eosinophil count alone was 0.89. The AUC for a combined model of MBP and eotaxin-3 was 0.96. When MBP, eotaxin-3, and eosinophil count were combined in one model, the AUC was 0.99. The AUC for MBP staining alone was significantly higher than both those for eotaxin-3 alone (p = 0.006) and the eosinophil count alone (p = 0.03). The combined MBP/eotaxin-3/eosinophil count AUC was significantly higher than the AUC for the eosinophil count alone (p = 0.007), but not for MBP staining alone (p = 0.19; Figure 3). On sensitivity analysis, the same results were noted after limiting the control group to only those with erosive reflux disease or to only those with an esophageal eosinophil count of ≥ 15 eos/hpf (data not shown). In addition, repeating this sensitivity analysis after excluding cases of EoE with ≥ 100 eos/hpf who might be less likely to present a diagnostic challenge, did not significantly changes the results (data not shown). Finally, the results were also similar after stratifying patients by age (adult vs child) and after limiting the EoE cases to those without erosive esophagitis (data not shown).
Figure 3.
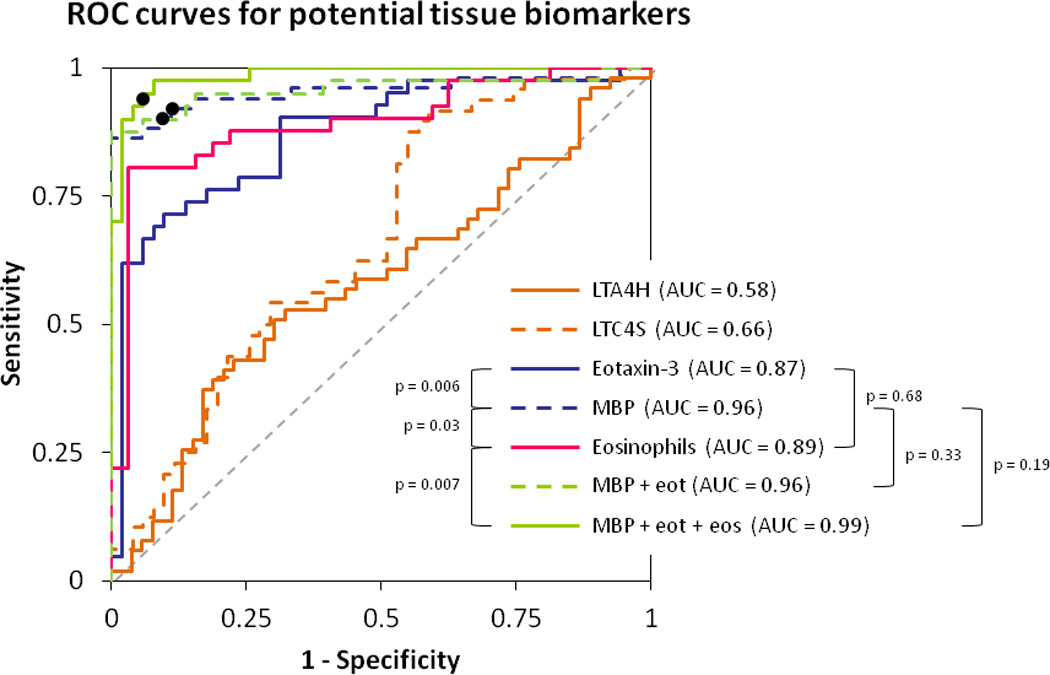
Receiver operating characteristic (ROC) curves for diagnosis of EoE using consensus guidelines as the gold standard. The x-axis is 1-specificity and the y axis is sensitivity. The dotted gray line represents a test that performs no better than chance, which by definition has an area under the curve (AUC) of 0.5. A perfect test would have a curve with a line parallel to the y-axis (specificity of 100%) and a line parallel to the x-axis (sensitivity of 100%), with an AUC of 1.0. In this figure, the AUC was calculated for seven conditions: LTA4H staining alone; LTC4S staining alone; eotaxin-3 staining alone; MBP staining alone; the eosinophil count alone; the combination of MBP and eotaxin-3; and the combination of MBP, eotaxin-3, and the eosinophil count. Sensitivity and specificity are typically maximized in the upper left-most area of each ROC curve. For example, for the MBP staining alone ROC curve (dotted blue line), the maximum sensitivity and specificity are 90% and 91%, respectively, as noted with a black dot. For the ROC curve for the combination of MBP and eotaxin three (dotted green line), the black dot represents the maximum sensitivity and specificity of 90% and 94%, respectively. For the ROC curve for the combination of MBP, eotaxin-3, and the eosinophil count (solid green line), the black dot represents the maximum sensitivity and specificity of 95% and 94%, respectively. For these latter two curves, aensitivity and specificity are maximized on the curves when the MBP staining level is 300 cells/mm2 and the eotaxin-3 staining level is 600 cells/mm2.
Discussion
Eosinophilic esophagitis is a clinicopathologic condition; the correct clinical and histologic features are required to make the diagnosis, and the diagnostic guidelines emphasize the importance of excluding competing causes of esophageal eosinophilia (1, 2). Because clinical and histologic features of EoE and GERD overlap, in practical terms GERD is the most common cause of esophageal eosinophilia that must be distinguished from EoE. (3–12) This differentiation between EoE and GERD can be challenging but is crucial as management strategies for the two conditions are divergent (1, 12).
This study examined IHC staining of tissue biomarkers such as MBP, eotaxin-3, LTA4H, and LTC4S for diagnosis of EoE by comparing EoE cases to GERD controls. These biomarkers were selected specifically because they were felt to be pertinent to the pathophysiology of EoE and unlikely to be increased in GERD (15, 20–22, 25, 27–31). Moreover, the GERD controls were selected to have inflammation, including prominent eosinophilia, on their esophageal biopsies in order to mimic the clinical situation in which it can be difficult to distinguish EoE from GERD. We found that there was significantly higher MBP and eotaxin-3 staining in the esophageal epithelium in EoE patients compared with GERD patients, but that LTA4H and LTC4S staining was similar between the groups. This result held even after limiting the controls to those with the highest eosinophil counts. In addition, the correlation between the esophageal eosinophil count and MBP and eotaxin-3 staining was not high, suggesting that performing IHC could add diagnostic information to the eosinophil count alone. On ROC analysis, the presence of increased numbers of cells staining for MBP and eotaxin-3 was actually more predictive of EoE cases status than was the eosinophil count itself. This is especially remarkable when one considers that the eosinophil count is one of the components of the case definition of EoE. Moreover, the combination of MBP staining, eotaxin-3 staining, and the eosinophil count nearly perfectly distinguished EoE and GERD, but we acknowledge that by including the eosinophil count in the ROC analysis, the predictive power of the model could be increased since eosinophil count is also a component of the case definition.
These results are consistent with what is known about EoE pathogenesis. In an allergen-induced Th2 response, factors such as IL-13 stimulate esophageal epithelial cells to produce eotaxin-3, which in turn recruits eosinophils to the esophagus and leads to their activation (15–17, 31). Eotaxin-3 cytokine levels (29, 31), tissue expression (27, 30), and blood levels (28) are higher in EoE cases than in GERD controls or normal subjects. When eosinophils are activated, they release intracellular granules, including MBP. MBP has been used to immunolocalize eosinophils and characterize eosinophil degranulation on a qualitative basis (20). Increased MBP staining and degranulation has been reported in EoE as compared to GERD (21, 22). However, no prior study has explicitly examined the diagnostic utility of MBP and eotaxin-3 in EoE with ROC analysis. Our results support the hypothesis that performing IHC on esophageal biopsies for these biomarkers improves diagnostic accuracy.
In contrast, the role of leukotrienes in EoE is less well established. LTA4H and LTC4S are key synthesis enzymes in the arachidonic acid pathway that metabolize precursors to leukotriene effectors and are differentially expressed in EoE (27). There have been several case series that report a clinical benefit of leukotriene antagonist therapy in patients with EoE, (19, 34, 35) but there is debate as to whether this medication class is truly effective (36). In addition, a prior study showed that cysteinyl leukotrienes levels were similar in EoE patients and normal controls (18). Our results are consistent with these latter data, as LTA4H and LTC4S staining were not helpful for differentiating EoE from GERD.
When interpreting the results from this study, there are several potential limitations to consider. First, this was a retrospective study conducted at a single center with a highly selected patient population. However, features of our EoE case population reflect the typical characteristics of EoE populations reported from other centers and lend validity to the data (37–42). Second, it is possible that there could have been misclassification of cases and controls. However, because the EoE cases included in this study were extensively characterized and met consensus EoE diagnostic criteria with exclusion of esophageal eosinophilia (9, 14), misclassification of EoE patients is unlikely. Furthermore, had misclassification occurred, the bias would have been towards the null with the reported results representing an underestimation of the association between the biomarkers and the disease state. Finally, the single time point of the analysis which was at diagnosis, limits conclusions that can be drawn about the diagnostic utility of these staining modalities in a PPI-naïve patient population. Because this was a retrospective study that utilized samples obtained prior to the recognition of PPI-responsive esophageal eosinophilia, we are unable to comment on the utility of this staining approach in that population (1, 43, 44). The use of MBP and eotaxin-3 staining will need to be validated prospectively in each of these patient groups before it can be recommended for routine use, and efforts to do so are underway.
The strengths of this study include a large number of well characterized incident cases, masked histologic re-review of esophageal biopsy specimens, and quantitative IHC analysis. Because there is ongoing controversy concerning the relationships between EoE, GERD, and esophageal eosinophilia (5, 45, 46), and because correct study group definitions are a crucial feature of case-control studies, we also performed pre-planned sensitivity analyses. That MBP and eotaxin-3 remained elevated in EoE, even when the EoE patients with lower eosinophil counts were compared to GERD patients with high levels of esophageal eosinophilia, implies that the activated eosinophils in EoE can be exploited to potentially improve the diagnostic algorithm for EoE.
More generally, this study points to a novel diagnostic algorithm for EoE, which relies on the pathogenic basis of the disease, as opposed to an arbitrary cutoff number of cells per high powered field. In addition to being intuitively more appealing, such an approach has other potential benefits. For instance, currently many patients diagnosed with EoE must undergo two diagnostic upper endoscopies – an initial exam, often performed for dysphagia, and a second, confirmatory exam after a course of acid suppressive therapy, to re-assess eosinophil counts and to rule out PPI-responsive esophageal eosinophilia. An algorithm assessing pathologic eosinophil activity has the potential to allow diagnosis at a single endoscopy session. While the current work cannot substantiate this approach, future studies should assess this highly clinically relevant question.
In conclusion, patients with EoE had substantially higher levels of MBP and eotaxin-3 staining in the esophageal epithelium compared with GERD patients, but there was no difference between groups for LTA4H and LT4CS staining. Staining with MBP and eotaxin-3 provided added diagnostic value beyond eosinophil counts alone, and MBP staining in particular had the more prominent effect. Utilizing tissue biomarkers such as MBP and eotaxin-3 may improve upon the current diagnostic standards by adding a measure of eosinophil activity that is physiologically important, and could add a pathogenic basis to the diagnosis of EoE.
Study highlights.
What is current knowledge?
The clinical, endoscopic, and histologic features of eosinophilic esophagitis (EoE) and gastroesophageal reflux disease (GERD) overlap substantially, and differentiating the two can be challenging.
Use of tissue biomarkers of eosinophil activation or inflammation may represent a more efficient and pathophysiologically-based means for diagnosis of EoE.
The diagnostic utility of factors such as major basic protein (MBP), eotaxin-3, and leukotriene synthesis enzymes has not been established in EoE.
What is new here?
Patients with EoE had substantially higher levels of MBP and eotaxin-3 staining in the esophageal epithelium compared with GERD patients, but there was no difference for leukotriene synthesis enzyme staining.
The combination of MBP staining, eotaxin-3 staining, and the eosinophil count nearly perfectly predicted EoE case status without taking into account other clinical, endoscopic, or histologic features.
Staining for MBP and eotaxin-3 may improve upon current EoE diagnostic standards by adding a measure of eosinophil activity that is physiologically important.
Acknowledgments
Financial support:
Grant support: This research was conducted with support, in part, by NIH awards KL2RR025746 (ESD), K23DK090073 (ESD), and a Junior Faculty Development Award from the American College of Gastroenterology. It also utilized the Histology Core of the UNC Center for Gastrointestinal Biology and Disease which is funded by NIH P30DK034987, and the UNC Translational Pathology lab which is funded by NIH P30CA016086.
The study sponsors had no role in the study design, collection, analysis, or interpretation of the data.
Abbreviations
- AUC
area under the curve
- EGD
esophagogastroduodenoscopy
- EoE
eosinophilic esophagitis
- eos/hpf
eosinophils per high-power field
- GERD
gastroesophageal reflux disease
- IHC
immunohistochemistry
- mm2
square millimeters
- PPI
proton-pump inhibitor
- ROC
receive operator characteristic
- UNC
University of North Carolina
Footnotes
Guarantor of the article: Evan Dellon
Specific author contributions (all authors approved the final draft):
Dellon: project conception/design; data acquisition/analysis/interpretation; drafting of the article; critical revision
Chen: immunohistochemistry optimization and supervision; critical revision
Miller: immunohistochemistry optimization and supervision; critical revision
Woosley: pathology review and eosinophil recounts; and critical revision
Shaheen: project conception and design; supervision; data interpretation; critical revision
Potential competing interests:
There are no potential conflicts of interest for any of the authors pertaining to this study.
References
- 1.Liacouras CA, Furuta GT, Hirano I, et al. Eosinophilic esophagitis: Updated consensus recommendations for children and adults. J Allergy Clin Immunol. 2011;128:3.e6–20.e6. doi: 10.1016/j.jaci.2011.02.040. [DOI] [PubMed] [Google Scholar]
- 2.Furuta GT, Liacouras CA, Collins MH, et al. Eosinophilic esophagitis in children and adults: a systematic review and consensus recommendations for diagnosis and treatment. Gastroenterology. 2007;133:1342–1363. doi: 10.1053/j.gastro.2007.08.017. [DOI] [PubMed] [Google Scholar]
- 3.Dellon ES. Diagnosis of eosinophilic esophagitis: current approach and future directions. Curr Gastroenterol Rep. 2011;13:240–246. doi: 10.1007/s11894-011-0183-y. [DOI] [PubMed] [Google Scholar]
- 4.Hirano I. Eosinophilic esophagitis and gastroesophageal reflux disease: there and back again. Clin Gastroenterol Hepatol. 2011;9:99–101. doi: 10.1016/j.cgh.2010.11.001. [DOI] [PubMed] [Google Scholar]
- 5.Spechler SJ, Genta RM, Souza RF. Thoughts on the complex relationship between gastroesophageal reflux disease and eosinophilic esophagitis. Am J Gastroenterol. 2007;102:1301–1306. doi: 10.1111/j.1572-0241.2007.01179.x. [DOI] [PubMed] [Google Scholar]
- 6.Noel RJ, Tipnis NA. Eosinophilic esophagitis -- a mimic of GERD. Int J Pediatr Otorhinolaryngol. 2006;70:1147–1153. doi: 10.1016/j.ijporl.2006.01.012. [DOI] [PubMed] [Google Scholar]
- 7.Dellon ES, Aderoju A, Woosley JT, et al. Variability in diagnostic criteria for eosinophilic esophagitis: A systematic review. Am J Gastroenterol. 2007;102:2300–2313. doi: 10.1111/j.1572-0241.2007.01396.x. [DOI] [PubMed] [Google Scholar]
- 8.Molina-Infante J, Ferrando-Lamana L, Mateos-Rodriguez JM, et al. Overlap of reflux and eosinophilic esophagitis in two patients requiring different therapies: A review of the literature. World J Gastroenterol. 2008;14:1463–1466. doi: 10.3748/wjg.14.1463. [DOI] [PMC free article] [PubMed] [Google Scholar]
- 9.Dellon ES, Gibbs WB, Fritchie KJ, et al. Clinical, endoscopic, and histologic findings distinguish eosinophilic esophagitis from gastroesophageal reflux disease. Clin Gastroenterol Hepatol. 2009;7:1305–1313. doi: 10.1016/j.cgh.2009.08.030. [DOI] [PMC free article] [PubMed] [Google Scholar]
- 10.Ngo P, Furuta GT, Antonioli DA, et al. Eosinophils in the esophagus--peptic or allergic eosinophilic esophagitis? Case series of three patients with esophageal eosinophilia. Am J Gastroenterol. 2006;101:1666–1670. doi: 10.1111/j.1572-0241.2006.00562.x. [DOI] [PubMed] [Google Scholar]
- 11.Rodrigo S, Abboud G, Oh D, et al. High intraepithelial eosinophil counts in esophageal squamous epithelium are not specific for eosinophilic esophagitis in adults. Am J Gastroenterol. 2008;103:435–442. doi: 10.1111/j.1572-0241.2007.01594.x. [DOI] [PubMed] [Google Scholar]
- 12.Dellon ES, Farrell TM, Bozymski EM, et al. Diagnosis of eosinophilic esophagitis after fundoplication for 'refractory reflux': implications for preoperative evaluation. Dis Esophagus. 2010;23:191–195. doi: 10.1111/j.1442-2050.2009.01019.x. [DOI] [PubMed] [Google Scholar]
- 13.Gupta SK. Noninvasive markers of eosinophilic esophagitis. Gastrointest Endosc Clin N Am. 2008;18:157–167. xi. doi: 10.1016/j.giec.2007.09.004. [DOI] [PubMed] [Google Scholar]
- 14.Dellon ES, Chen X, Miller CR, et al. Tryptase staining of mast cells may differentiate eosinophilic esophagitis from gastroesophageal reflux disease. Am J Gastroenterol. 2011;106:264–271. doi: 10.1038/ajg.2010.412. [DOI] [PMC free article] [PubMed] [Google Scholar]
- 15.Rothenberg ME. Biology and treatment of eosinophilic esophagitis. Gastroenterology. 2009;137:1238–1249. doi: 10.1053/j.gastro.2009.07.007. [DOI] [PMC free article] [PubMed] [Google Scholar]
- 16.Rothenberg ME, Hogan SP. The eosinophil. Annu Rev Immunol. 2006;24:147–174. doi: 10.1146/annurev.immunol.24.021605.090720. [DOI] [PubMed] [Google Scholar]
- 17.Blanchard C, Stucke EM, Burwinkel K, et al. Coordinate interaction between IL-13 and epithelial differentiation cluster genes in eosinophilic esophagitis. J Immunol. 2010;184:4033–4041. doi: 10.4049/jimmunol.0903069. [DOI] [PMC free article] [PubMed] [Google Scholar]
- 18.Gupta SK, Peters-Golden M, Fitzgerald JF, et al. Cysteinyl leukotriene levels in esophageal mucosal biopsies of children with eosinophilic inflammation: are they all the same? Am J Gastroenterol. 2006;101:1125–1128. doi: 10.1111/j.1572-0241.2006.00557.x. [DOI] [PubMed] [Google Scholar]
- 19.Attwood SE, Lewis CJ, Bronder CS, et al. Eosinophilic oesophagitis: a novel treatment using Montelukast. Gut. 2003;52:181–185. doi: 10.1136/gut.52.2.181. [DOI] [PMC free article] [PubMed] [Google Scholar]
- 20.Mueller S, Aigner T, Neureiter D, et al. Eosinophil infiltration and degranulation in oesophageal mucosa from adult patients with eosinophilic oesophagitis: a retrospective and comparative study on pathological biopsy. J Clin Pathol. 2006;59:1175–1180. doi: 10.1136/jcp.2005.031922. [DOI] [PMC free article] [PubMed] [Google Scholar]
- 21.Lucendo AJ, Navarro M, Comas C, et al. Immunophenotypic characterization and quantification of the epithelial inflammatory infiltrate in eosinophilic esophagitis through stereology: an analysis of the cellular mechanisms of the disease and the immunologic capacity of the esophagus. Am J Surg Pathol. 2007;31:598–606. doi: 10.1097/01.pas.0000213392.49698.8c. [DOI] [PubMed] [Google Scholar]
- 22.Mueller S, Neureiter D, Aigner T, et al. Comparison of histological parameters for the diagnosis of eosinophilic oesophagitis versus gastro-oesophageal reflux disease on oesophageal biopsy material. Histopathology. 2008;53:676–684. doi: 10.1111/j.1365-2559.2008.03187.x. [DOI] [PubMed] [Google Scholar]
- 23.Protheroe C, Woodruff SA, de Petris G, et al. A novel histologic scoring system to evaluate mucosal biopsies from patients with eosinophilic esophagitis. Clin Gastroenterol Hepatol. 2009;7:749–755. e11. doi: 10.1016/j.cgh.2009.03.022. [DOI] [PMC free article] [PubMed] [Google Scholar]
- 24.Kephart GM, Alexander JA, Arora AS, et al. Marked deposition of eosinophil-derived neurotoxin in adult patients with eosinophilic esophagitis. Am J Gastroenterol. 2010;105:298–307. doi: 10.1038/ajg.2009.584. [DOI] [PMC free article] [PubMed] [Google Scholar]
- 25.Justinich CJ, Ricci A, Jr, Kalafus DA, et al. Activated eosinophils in esophagitis in children: a transmission electron microscopic study. J Pediatr Gastroenterol Nutr. 1997;25:194–198. doi: 10.1097/00005176-199708000-00011. [DOI] [PubMed] [Google Scholar]
- 26.Subbarao G, Rosenman MB, Ohnuki L, et al. Exploring potential noninvasive biomarkers in eosinophilic esophagitis in children. J Pediatr Gastroenterol Nutr. 2011;53:651–658. doi: 10.1097/MPG.0b013e318228cee6. [DOI] [PubMed] [Google Scholar]
- 27.Blanchard C, Wang N, Stringer KF, et al. Eotaxin-3 and a uniquely conserved gene-expression profile in eosinophilic esophagitis. J Clin Invest. 2006;116:536–547. doi: 10.1172/JCI26679. [DOI] [PMC free article] [PubMed] [Google Scholar]
- 28.Konikoff MR, Blanchard C, Kirby C, et al. Potential of blood eosinophils, eosinophil-derived neurotoxin, and eotaxin-3 as biomarkers of eosinophilic esophagitis. Clin Gastroenterol Hepatol. 2006;4:1328–1336. doi: 10.1016/j.cgh.2006.08.013. [DOI] [PubMed] [Google Scholar]
- 29.Gupta SK, Fitzgerald JF, Kondratyuk T, et al. Cytokine expression in normal and inflamed esophageal mucosa: a study into the pathogenesis of allergic eosinophilic esophagitis. J Pediatr Gastroenterol Nutr. 2006;42:22–26. doi: 10.1097/01.mpg.0000188740.38757.d2. [DOI] [PubMed] [Google Scholar]
- 30.Bhattacharya B, Carlsten J, Sabo E, et al. Increased expression of eotaxin-3 distinguishes between eosinophilic esophagitis and gastroesophageal reflux disease. Hum Pathol. 2007;38:1744–1753. doi: 10.1016/j.humpath.2007.05.008. [DOI] [PubMed] [Google Scholar]
- 31.Blanchard C, Stucke EM, Rodriguez-Jimenez B, et al. A striking local esophageal cytokine expression profile in eosinophilic esophagitis. J Allergy Clin Immunol. 2011;127:208–217. 217, e1–e7. doi: 10.1016/j.jaci.2010.10.039. [DOI] [PMC free article] [PubMed] [Google Scholar]
- 32.Dellon ES, Bower JJ, Keku TO, et al. Markers of tyrosine kinase activity in eosinophilic esophagitis: a pilot study of the FIP1L1-PDGFRalpha fusion gene, pERK 1/2, and pSTAT5. Dis Esophagus. 2011 doi: 10.1111/j.1442-2050.2011.01230.x. (Epub August 5;) [DOI] [PMC free article] [PubMed] [Google Scholar]
- 33.Dellon ES, Fritchie KJ, Rubinas TC, et al. Inter- and intraobserver reliability and validation of a new method for determination of eosinophil counts in patients with esophageal eosinophilia. Dig Dis Sci. 2010;55:1940–1949. doi: 10.1007/s10620-009-1005-z. [DOI] [PMC free article] [PubMed] [Google Scholar]
- 34.Vanderhoof JA, Young RJ, Hanner TL, et al. Montelukast: use in pediatric patients with eosinophilic gastrointestinal disease. J Pediatr Gastroenterol Nutr. 2003;36:293–294. doi: 10.1097/00005176-200302000-00027. [DOI] [PubMed] [Google Scholar]
- 35.Stumphy J, Al-Zubeidi D, Guerin L, et al. Observations on use of montelukast in pediatric eosinophilic esophagitis: insights for the future. Dis Esophagus. 2011;24:229–234. doi: 10.1111/j.1442-2050.2010.01134.x. [DOI] [PubMed] [Google Scholar]
- 36.Lucendo AJ, De Rezende LC, Jimenez-Contreras S, et al. Montelukast was inefficient in maintaining steroid-induced remission in adult eosinophilic esophagitis. Dig Dis Sci. 2011;56:3551–3558. doi: 10.1007/s10620-011-1775-y. [DOI] [PubMed] [Google Scholar]
- 37.Straumann A, Spichtin HP, Grize L, et al. Natural history of primary eosinophilic esophagitis: a follow-up of 30 adult patients for up to 11.5 years. Gastroenterology. 2003;125:1660–1669. doi: 10.1053/j.gastro.2003.09.024. [DOI] [PubMed] [Google Scholar]
- 38.Liacouras CA, Spergel JM, Ruchelli E, et al. Eosinophilic esophagitis: a 10-year experience in 381 children. Clin Gastroenterol Hepatol. 2005;3:1198–1206. doi: 10.1016/s1542-3565(05)00885-2. [DOI] [PubMed] [Google Scholar]
- 39.Gonsalves N, Policarpio-Nicolas M, Zhang Q, et al. Histopathologic variability and endoscopic correlates in adults with eosinophilic esophagitis. Gastrointest Endosc. 2006;64:313–319. doi: 10.1016/j.gie.2006.04.037. [DOI] [PubMed] [Google Scholar]
- 40.Prasad GA, Talley NJ, Romero Y, et al. Prevalence and Predictive Factors of Eosinophilic Esophagitis in Patients Presenting With Dysphagia: A Prospective Study. Am J Gastroenterol. 2007;102:2627–2632. doi: 10.1111/j.1572-0241.2007.01512.x. [DOI] [PubMed] [Google Scholar]
- 41.Veerappan GR, Perry JL, Duncan TJ, et al. Prevalence of Eosinophilic Esophagitis in an Adult Population Undergoing Upper Endoscopy: A Prospective Study. Clin Gastroenterol Hepatol. 2009;7:420–426. doi: 10.1016/j.cgh.2008.10.009. [DOI] [PubMed] [Google Scholar]
- 42.Spergel JM, Brown-Whitehorn TF, Beausoleil JL, et al. 14 years of eosinophilic esophagitis: clinical features and prognosis. J Pediatr Gastroenterol Nutr. 2009;48:30–36. doi: 10.1097/MPG.0b013e3181788282. [DOI] [PubMed] [Google Scholar]
- 43.Molina-Infante J, Ferrando-Lamana L, Ripoll C, et al. Esophageal Eosinophilic Infiltration Responds to Proton Pump Inhibition in Most Adults. Clin Gastroenterol Hepatol. 2011;9:110–117. doi: 10.1016/j.cgh.2010.09.019. [DOI] [PubMed] [Google Scholar]
- 44.Dohil R, Newbury RO, Aceves S. Transient PPI Responsive Esophageal Eosinophilia May Be a Clinical Sub-phenotype of Pediatric Eosinophilic Esophagitis. Dig Dis Sci. 2011 doi: 10.1007/s10620-011-1991-5. [DOI] [PubMed] [Google Scholar]
- 45.Merwat SN, Spechler SJ. Might the use of acid-suppressive medications predispose to the development of eosinophilic esophagitis? Am J Gastroenterol. 2009;104:1897–1902. doi: 10.1038/ajg.2009.87. [DOI] [PubMed] [Google Scholar]
- 46.Sridhara S, Ravi K, Smyrk TC, et al. Increased Numbers of Eosinophils, Rather than Only Etiology, Predict Histologic Changes in Patients with Esophageal Eosinophilia. Clin Gastroenterol Hepatol. 2012 doi: 10.1016/j.cgh.2012.01.008. epub Jan 27. [DOI] [PubMed] [Google Scholar]