Abstract
The highly collaborative research sponsored by the NSF-funded Assembling the Porifera Tree of Life (PorToL) project is providing insights into some of the most difficult questions in metazoan systematics. Our understanding of phylogenetic relationships within the phylum Porifera has changed considerably with increased taxon sampling and data from additional molecular markers. PorToL researchers have falsified earlier phylogenetic hypotheses, discovered novel phylogenetic alliances, found phylogenetic homes for enigmatic taxa, and provided a more precise understanding of the evolution of skeletal features, secondary metabolites, body organization, and symbioses. Some of these exciting new discoveries are shared in the papers that form this issue of Integrative and Comparative Biology. Our analyses of over 300 nearly complete 28S ribosomal subunit gene sequences provide specific case studies that illustrate how our dataset confirms new hypotheses of sponge evolution. We recovered monophyletic clades for all 4 classes of sponges, as well as the 4 major clades of Demospongiae (Keratosa, Myxospongiae, Haploscleromorpha, and Heteroscleromorpha), but our phylogeny differs in several aspects from traditional classifications. In most major clades of sponges, families within orders appear to be paraphyletic. Although additional sampling of genes and taxa are needed to establish whether this pattern results from a lack of phylogenetic resolution or from a paraphyletic classification system, many of our results are congruent with those obtained from 18S ribosomal subunit gene sequences and complete mitochondrial genomes. These data provide further support for a revision of the traditional classification of sponges.
Introduction
Sponges (phylum Porifera) are dominant members of benthic communities in tropical, temperate, and polar seas, and are globally distributed in freshwater habitats (Van Soest et al. 2012). Over the past decade, our knowledge of the biodiversity of sponges has expanded greatly, from the publication of a completely revised classification scheme (Systema Porifera; Hooper and Van Soest 2002) to the creation of multiple Internet-based databases (e.g., World Porifera Database [www.marinespecies.org/porifera], Sponge Barcoding Database [www.spongebarcoding.org]). Over 8000 accepted species of sponges are described, but at least 6000 additional species are thought to exist, based on surveys of museum collections (Hooper and Lévi 1994). More species are added to this biodiversity each year (e.g., Diaz et al. 2013, this issue). Since sponges play critical roles in a variety of ecosystem functions (Rützler 2012; Wulff 2012), improving our understanding of this biodiversity is critical for protecting marine habitats. Sponges also provide a vast reservoir of chemical compounds with biotechnological applications (Leal et al. 2012), but to tap into this important natural resource, we must place the taxonomy of the group into a robust phylogenetic context.
Currently, Porifera are distributed in four classes (Calcarea, Demospongiae, Hexactinellida, and Homoscleromorpha; Table 1), with Demospongiae further divided into four monophyletic subclasses (Keratosa, Myxospongiae, Haploscleromorpha, and Heteroscleromorpha) (Cárdenas et al. 2012). Borchiellini et al. (2000) reviewed the molecular systematics of sponges when only 75 partial sequences of the gene encoding the 28S nuclear ribosomal RNA (rRNA) subunit (hereafter referred to as 28S) were known; now, over 2400 28S sequences attributed to Porifera are present in GenBank, indicative of the great effort made to understand the phylogeny of Porifera based on molecular data in the past decade. Several recent reviews and manuscripts have proposed new hypotheses of sponge evolution, with new arrangements of families, orders, and subclasses in both traditional Linnean (Wörheide et al. 2012) and more recent Phylocode (Cárdenas et al. 2012) classification schemes (Hill et al. 2013). Despite this rapid progress, our public datasets remain incomplete, demonstrating many of the confounding issues recognized by Borchiellini et al. (2000). For example, different research groups use different genetic markers for routine characterization of specimens; even when the same marker is used, different investigators may sequence distinct fragments or partitions.
Table 1.
Distribution of currently accepted sponge taxa and 2000 bp 28S sequences among classes of Porifera and major clades of Demospongiae.
| Class or clade | Number (%) accepted species | Number (%) 28S sequences >2000 bp |
|---|---|---|
| Calcarea | 672 (8.0) | 59 (18.0) |
| Homoscleromorpha | 85 (1.0) | 2 (0.6) |
| Hexactinellida | 615 (7.3) | 1 (0.3) |
| Demospongiae | ||
| Keratosa | 533 (6.4) | 47 (14.3) |
| Myxospongiae | 132 (1.6) | 22 (6.7) |
| Haploscleromorpha | 1301 (15.5) | 28 (8.5) |
| Heteroscleromorpha | 5032 (60.1) | 168 (51.2) |
| Total | 8370 (100) | 327 (100) |
In 2008, the NSF Assembling the Tree of Life Program provided an opportunity to fill many of these data gaps through support of the Porifera Tree of Life (PorToL) Project (www.portol.org). PorToL funding was used to examine how genera of sponges are arranged into families, orders, and subclasses. To balance our research efforts, we faced a common trade-off of taxon sampling versus gene sampling. We attempted to locate specimens from over 140 families, over 700 genera, and 8000 specimens. For specimens representing each family, our goal was to sequence a set of seven nuclear housekeeping genes (Hill et al. 2013) and the 18S and 28S nuclear ribosomal subunits. For specimens representing each genus, we aimed to sequence 18S, 28S, and three mitochondrial genes; for each individual specimen, we attempted to sequence two DNA barcodes, the mitochondrial cox1 gene and a fragment (D3–D5) of 28S.
At the 2013 annual SICB meeting, the PorToL team presented a series of symposium papers and contributed talks to address progress toward these goals and to test hypotheses of relationships among sponges. In the current study, we focus on one aspect of our dataset, the use of nearly complete sequences of the 28S rRNA subunit to test phylogenetic hypotheses. We examined whether this marker would group sponges into families, orders, and subclasses defined by traditional morphological approaches, as well as whether we could find support for novel groupings. In this article, we use Linnean taxonomy to label the specimens on our phylogenies, but we also evaluate support for proposed Phylocode names (Cárdenas et al. 2012).
Methods
Sampling and DNA extraction
Collections of fresh specimens were made in 2009, 2010, 2011, and 2012 at the Smithsonian Tropical Research Institute’s Bocas del Toro Research Station, Bocas del Toro, Republic of Panama. Specimens were collecting by scuba diving or snorkeling and held in seawater until processed in the laboratory. Subsamples of each specimen were preserved in 95% ethanol, in RNAlater (Ambion, Inc.), and in paraformaldehyde (for histological sections). Specimens selected from the National Cancer Institute (NCI) collection, maintained by the National Museum of Natural History (NMNH), were preserved at the time of collection in 70–95% ethanol. Subsamples of specimens were used for preparing spicules and histological sections for morphological taxonomic verification and DNA extractions. Specimens were identified to the lowest possible taxonomic level using a variety of macroscopic and microscopic morphological characters, including the composition of spicules and the arrangement of the skeletal elements (Hooper and Van Soest 2002).
At the University of Alabama at Birmingham (UAB), DNA was extracted from subsamples following the procedures using the Wizard SV Genomic DNA Purification System (Promega), following the manufacturer’s protocol; a similar protocol was used at the University of Richmond for some specimens. Quality and quantity of extractions were assessed by measuring DNA concentrations and optical absorbance ratios using a NanoDrop-1000 UV-visible spectrophotometer (Thermo Scientific), as well as by visualizing an aliquot of the extraction on a 1% agarose gel with a 1000-bp ladder. Optimal DNA extractions contained concentrations of DNA ranging from 50 to 200 ng/µl and displayed A260:A280 ratios of 1.6 or higher and A260:A230 of 2.0 or higher.
At the NMNH, DNA extractions were performed using either an AutoGenPrep 965 high-throughput robotic DNA extraction system (AutoGen), in accordance with the manufacturer’s instructions for whole-blood extraction, or the BioSprint 96 workstation (QIAGEN) in conjunction with the BioSprint 96 DNA Blood Kit (QIAGEN). Extracted genomic DNA was visualized using agarose gel electrophoresis.
Polymerase chain reaction amplification
Each DNA extraction was tested for polymerase chain reaction (PCR) quality by amplifying approximately 600 bp of the gene encoding the 18S rRNA subunit using primers SP18cF and SP18dR (Supplementary Table S2). Total PCR volume was 50 µl, including 50 pmol of each primer, 0.2 mM of each dNTP, 1× MasterTaq PCR Buffer (5-PRIME), 1× TaqMaster additive (5-PRIME), 2 µl of DNA template, and 2 U of MasterTaq DNA polymerase (5-PRIME). The thermocycler program included initial denaturing time of 5 min at 85°C, then 30 cycles of 0.5 min at 94°C, 1 min at 60°C, and 1.5 min at 72°C, followed by a final extension of 10 min at 72°C. PCR products were visualized on a 1.5% agarose gel with a 100-bp ladder. Bright bands for this 18S fragment were good predictors of eventual success in obtaining 28S sequences.
We obtained nearly complete sequences of the gene encoding the 28S rRNA subunit by amplifying two overlapping fragments, using primer 28F63mod paired with 28R2077sq (at an annealing temperature of 55°C) and primer 28F1411 paired with 28RampRC (annealing at 64°C; Supplementary Table S2). Components of the PCR reaction were as stated above, while the thermocycler program included an initial denaturing time of 5 min at 85°C, then 30 cycles of 0.7 min at 94°C, 1 min at the appropriate annealing temperature, and 6 min at 72°C, followed by a final extension of 10 min at 72°C. The rate of temperature increase from annealing to extension was fixed at 1°C/s. PCR products were visualized on a 1.5% agarose gel. If these PCRs failed, they were repeated at an annealing temperature of 45°C. If this drastically lower annealing temperature failed to yield amplicons, three additional reactions were attempted using the following primer sets and annealing temperatures: (1) 28F63mod and 28R1072, 55°C; (2) 28F635sq and 28LR3KN, 55°C; and (3) 28F1411 and 28R2800, 64°C (Supplementary Table S2). For some species, it was necessary to amplify additional fragments using various combinations of the primers specified in Supplementary Table S2. PCR products were gel-purified and cleaned using the Wizard SV Gel Clean-Up System (Promega) prior to sequencing on an ABI 377 automated sequencer at the UAB Center for AIDS Research DNA Sequencing Core Facility. Additional sequencing was completed at Virginia Commonwealth University on an ABI 3730xl DNA Analyzer. Individual samples yielded sequencing reads of highly variable lengths, such that multiple sequencing primers were used to obtain overlapping fragments (Supplementary Table S2).
We quality scored individual sequencing reads and combined them into contigs using Aligner software (CodonCode). Contigs were compared to sequences in the GenBank databases by using the BLAST algorithm, as implemented by Geneious software (Biomatters Ltd.). If sequences did not BLAST to Porifera, a new piece of tissue was dissected. For these repeat dissections, we checked the sponge tissue under a compound microscope prior to DNA extraction to verify that pieces of other organisms (e.g., copepods, polychaetes, and molluscs) were not present.
Phylogenetic analysis
We used the MAFFT-Q-INS-i algorithm (Katoh and Toh 2008) to generate multiple sequence alignments based on the secondary structure of the 28S molecule. The use of partial sequences strongly biased the outcome of our alignment, whereby sequences were grouped according to their length. Improper folding of the secondary structure causes this artifact of the algorithm; that is, it is impossible to assign correct base pairing to a short sequence that lacks the appropriate matching bases. To avoid this problem, we limit the analyses shown here to sequences greater than 2000 bp in length. Similarly, we also included sequences from GenBank that were at least 2000 bp in length. During our study, Morrow et al. (2012) were published; thus, we also included specimens from Morrow et al. when at least 2000 bp of sequence was available.
Tsagkogeorga et al. (2009) demonstrated that the categorical general time-reversible (CAT-GTR) model of sequence evolution has a better fit than other models to ribosomal sequence data and determined that an a priori partitioning of ribosomal data into stem and loop regions is a vast oversimplification of evolutionary constraints. Therefore, we constructed phylogenetic trees from the structure-based multiple sequence alignment by implementing the CAT-GTR model under maximum likelihood (ML) and Bayesian inference (BI) criteria. ML methods were applied in RAxML (Stamatakis et al. 2008), using the CAT-GTR model of sequence evolution implemented by the phylobench web service (phylobench.vital-it.ch). BI methods were applied in PhyloBayes MPI 1.2f (Lartillot et al. 2009), executed at the Alabama Supercomputer Authority (asc.edu). PhyloBayes was run as four independent chains, implementing the CAT-GTR model of sequence evolution. We assessed the convergence of these chains using the tracecomp and bpcomp algorithms, with a maximum discrepancy <0.3 and a minimum effective size >50 indicating acceptable convergence.
Results and discussion
We compiled 327 28S sequences greater than 2000 bp in length (Table 1); of these, 65 were obtained from GenBank, 57 were obtained from Morrow et al. (2012), and 205 (63%) were newly sequenced by the PorToL team. The new sequences were deposited in GenBank under accession numbers KC869447 to KC869651; voucher specimens were deposited at the NMNH (Supplementary Table S1). Additional metadata for each specimen are available from the PorToL database (www.portol.org). Over 65% of the PorToL-generated sequences were derived from specimens in the NCI/NMNH collections, underscoring the importance to systematics of vouchered specimens that originate from other types of research. Sequences obtained from GenBank included 47 specimens of Calcarea from a study by Voigt et al. (2012). The taxonomic distribution of analyzed sequences was skewed (Table 1), with only one hexactinellid and two homoscleromorph sequences present.
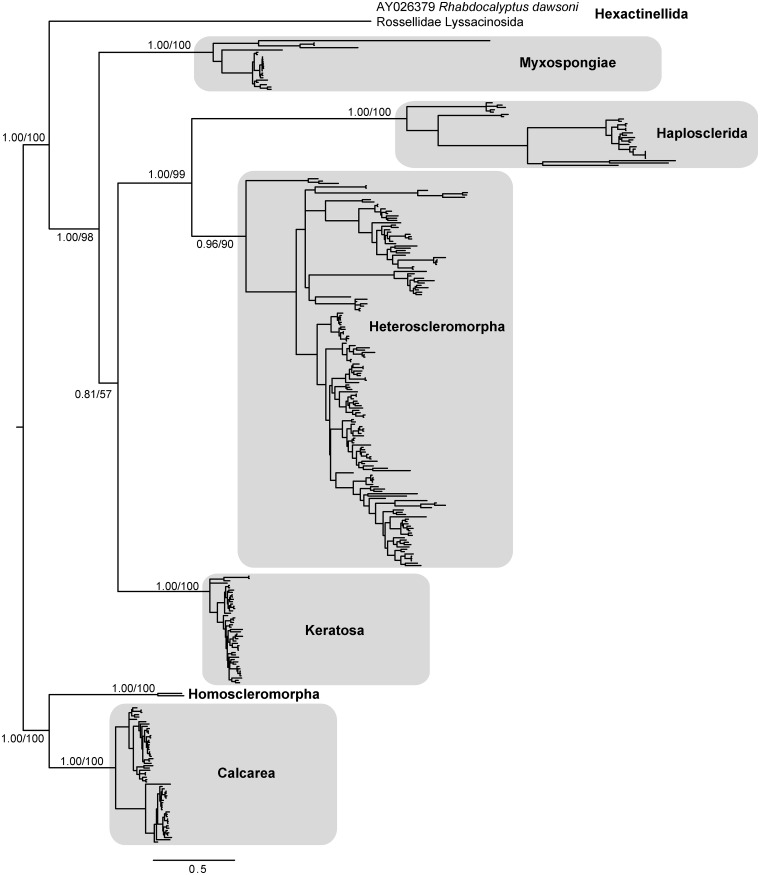
Individual sequences ranged from 2003 to 3824 bp in length and yielded an alignment of 5085 bp. Within the alignment, 2360 sites were parsimony-informative, whereas 2725 sites were not informative; 2035 of the noninformative sites were invariant. No positions were excluded from the alignment prior to phylogenetic reconstruction. The topologies obtained from Bayesian and ML approaches were identical at the class and major clade level (Fig. 1), with very strong support for 10 of 11 nodes, including Calcarea, Keratosa, Myxospongiae, Haploscleromorpha, and Heteroscleromorpha. Since only one hexactinellid and two homosleromorph sequences were included in the dataset, those two classes will not be discussed further. The high degree of support observed for these clades provides additional evidence confirming that these groupings reflect the major lineages of sponge evolution (Cárdenas et al. 2012; Wörheide et al. 2012). Below, we discuss the trends we recovered in each major lineage; these trends are further discussed in analyses of nearly complete 18S sequences by Redmond et al. (2013, this issue).
Fig. 1.
Bayesian topology of phylogenetic relationships among major groups of Porifera. Numbers at nodes correspond to posterior probabilities and ML bootstrap values (PP/ML). Scale bar indicates 0.5 substitutions per site.
Keratosa
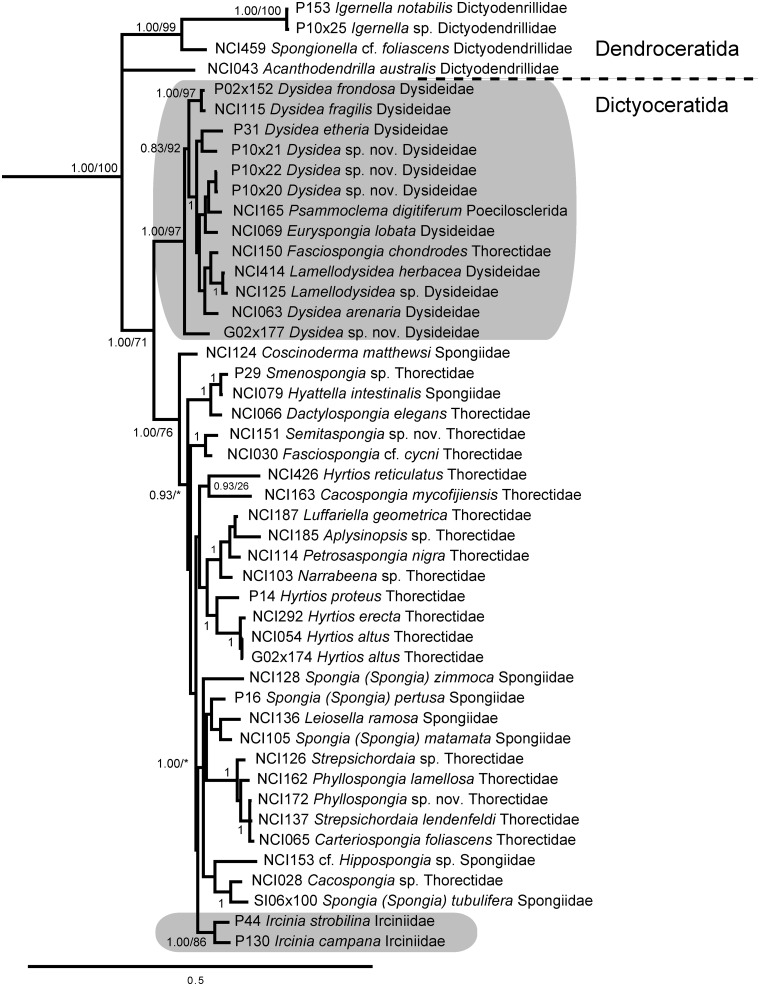
Within Keratosa (orders Dendroceratida and Dictyoceratida), we only analyzed four dendroceratid sequences from three genera; however, all these sequences grouped together, distinct from Dictyoceratida (Fig. 2). Enhanced sampling of Dendroceratida would certainly enhance phylogenies based on nearly complete 28S. Within Dictyoceratida, the family Dysideidae was well represented in our dataset and formed a monophyletic clade with strong support as has been observed in other recent analyses (Wörheide et al. 2012). We included two undescribed species of Dysidea in this dataset to confirm their taxonomic affinities. A thorectid sponge, Lendenfeldia chondrodes, was also included within the Dysideidae clade; interestingly, this sponge contains filamentous cyanobacterial symbionts similar to those present in the closely related Lamellodysidea spp. (Ridley et al. 2005), suggesting that the taxonomic description of this species must be revised. Likewise, Psammoclema digitiferum (Lendenfeld 1889) was originally described as Dysidea digitifera (Ridley 1884), and its current description should be revisited. The family Irciniidae was represented by only two sequences, which formed a monophyletic clade, but families Thorectidae and Spongiidae appeared polyphyletic. Although the subfamily Phyllospongiinae (represented by the genera Carteriospongia, Phyllospongia, and Strepsichordaia) was monophyletic, many genera were not, including Hyrtios, Phyllospongia, and Spongia. A low amount of signal differentiated many of the supported clades, suggesting that a faster-evolving genetic marker is needed to adequately resolve taxa within Dictyoceratida.
Fig. 2.
Bayesian topology of phylogenetic relationships within Keratosa, including orders Dendroceratida and Dictyoceratida. Gray boxes indicate monophyletic groupings of families Dysideidae and Irciniidae. Numbers at nodes correspond to PP and ML bootstrap values (PP/ML). A value of 1 indicates PP = 1.00 and ML > 90. Asterisks indicate nodes not present in the ML topology. Scale bar indicates 0.5 substitutions per site.
Myxospongiae
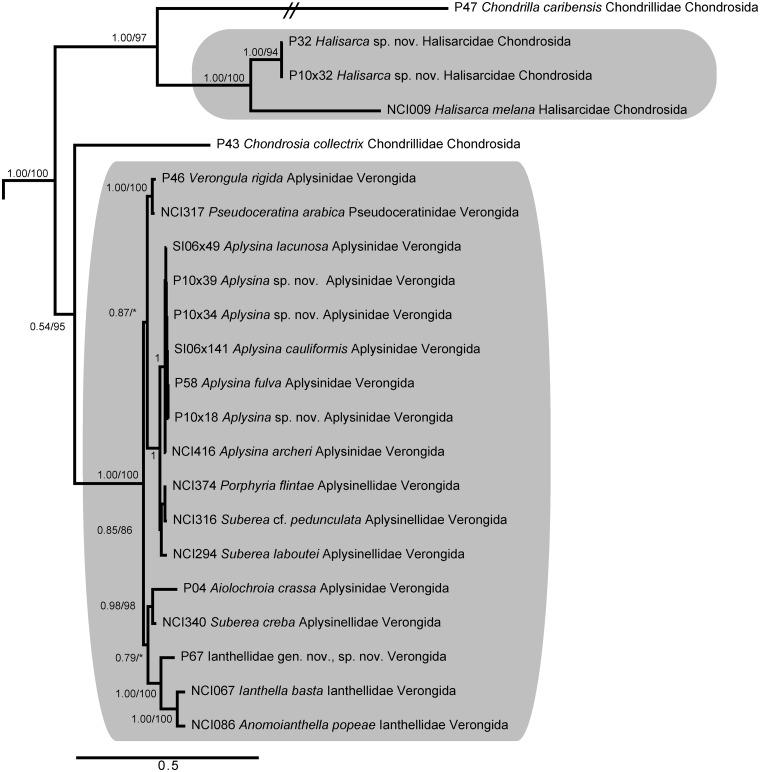
Our analyses provided strong support for a monophyletic order Verongida (Fig. 3), but suggested that order Chondrosida is paraphyletic as currently defined (Cárdenas et al. 2012), since Chondrosia collectrix was placed as the nearest sister taxon to Verongida. The monogeneric family Halisarcidae formed a monophyletic clade, supporting the view that it could be returned to ordinal status (Bergquist and Cook 2002) if order Chondrillida were constructed to hold Chondrilla; however, our analyses lacked representatives of Thymosia and Thymosiopsis, two additional genera within Chondrillidae that are absolutely needed to resolve this question. Although the family Ianthellidae was supported as a monophyletic clade within Verongida, including a new genus, described by Diaz et al. (2013, this issue), the families Aplysinidae and Aplysinellidae were paraphyletic. As seen for Keratosa, a low amount of differentiation among the representatives of verongid families indicates that a faster-evolving genetic marker is needed to provide adequate resolution of these taxa.
Fig. 3.
Bayesian topology of phylogenetic relationships within Myxospongiae, including orders Chondrosida and Verongida. Gray boxes indicate monophyletic groupings of family Halisarcidae and order Verongida. Numbers at nodes correspond to PP and ML bootstrap values (PP/ML). A value of 1 indicates PP = 1.00 and ML > 90. Asterisks indicate nodes not present in the ML topology. Scale bar indicates 0.5 substitutions per site.
Haploscleromorpha
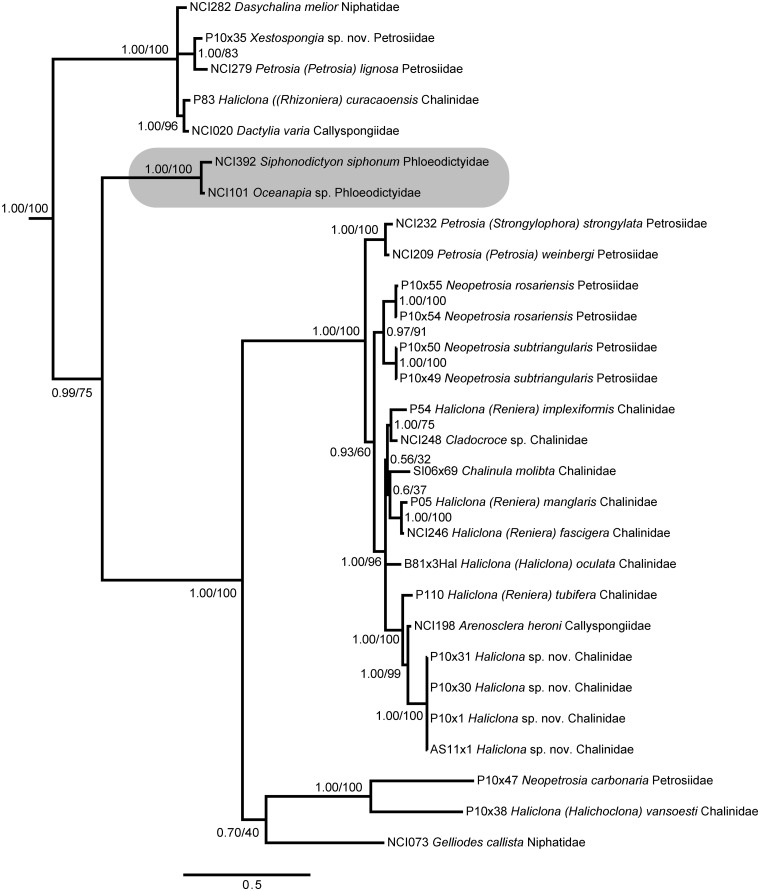
Our dataset included several representatives of marine Haplosclerida, which is composed of two suborders and six families (Haplosclerina: Chalinidae, Callyspongiidae, Niphatidae; Petrosina: Calcifibrospongiidae, Phloeodictyidae, Petrosiidae). Our dataset lacked specimens from family Calcifibrospongiidae. Only family Phloeodictyidae was supported as a monophyletic clade; the other families were all polyphyletic, with representatives grouped into deeply diverging, yet strongly supported clades (Fig. 4). The major clades we recovered were characterized by multiple unique insertions, ranging in size from 5 to 50 bp, similar to those previously observed in 18S sequences from Haplosclerida (Redmond and McCormack 2008). Within these clades, we embedded multiple duplicate specimens to serve as controls for our sequencing protocols; notably, these taxa demonstrated little variation within species (e.g., Haliclona sp. nov., Neopetrosia subtriangularis, and N. rosariensis).
Fig. 4.
Bayesian topology of phylogenetic relationships within Haploscleromorpha. A gray box indicates the only monophyletic family, Phloeodictyidae. Numbers at nodes correspond to PP and ML bootstrap values (PP/ML). A value of 1 indicates PP = 1.00 and ML > 90. Asterisks indicate nodes not present in the ML topology. Scale bar indicates 0.5 substitutions per site.
Heteroscleromorpha
The heteroscleromorpha clade represents the vast majority of poriferan and demosponge species, including over 50% of our dataset. Morrow et al. (2012) provided the most recent analysis of this group; we combined PorToL-derived 28S sequences with those of Morrow et al. (2012), as the two datasets were largely nonoverlapping in taxonomic coverage. In the current volume, Morrow et al. (2013, this issue) merge 28S and 18S datasets for a more extensive discussion of the issues raised here.
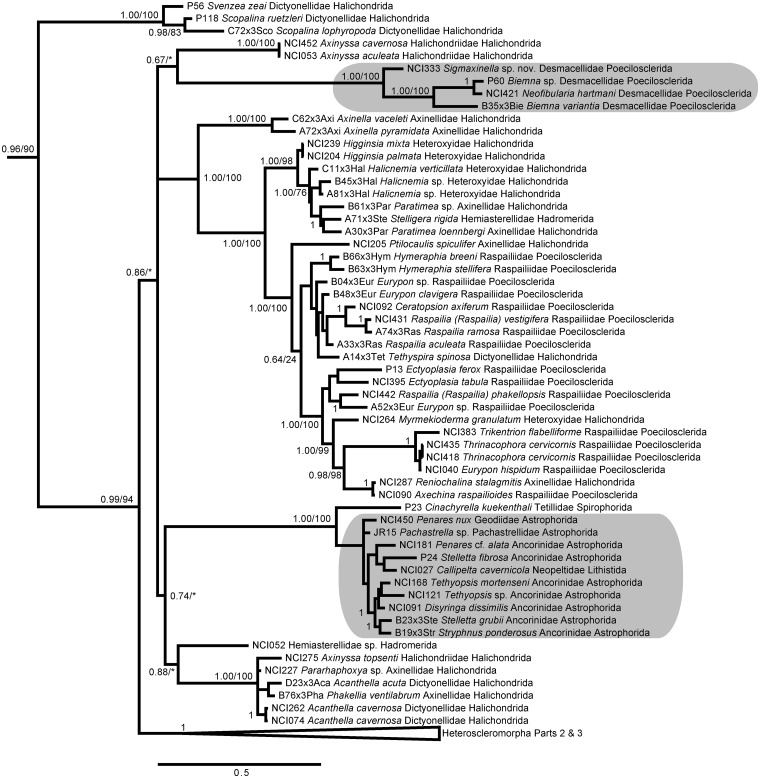
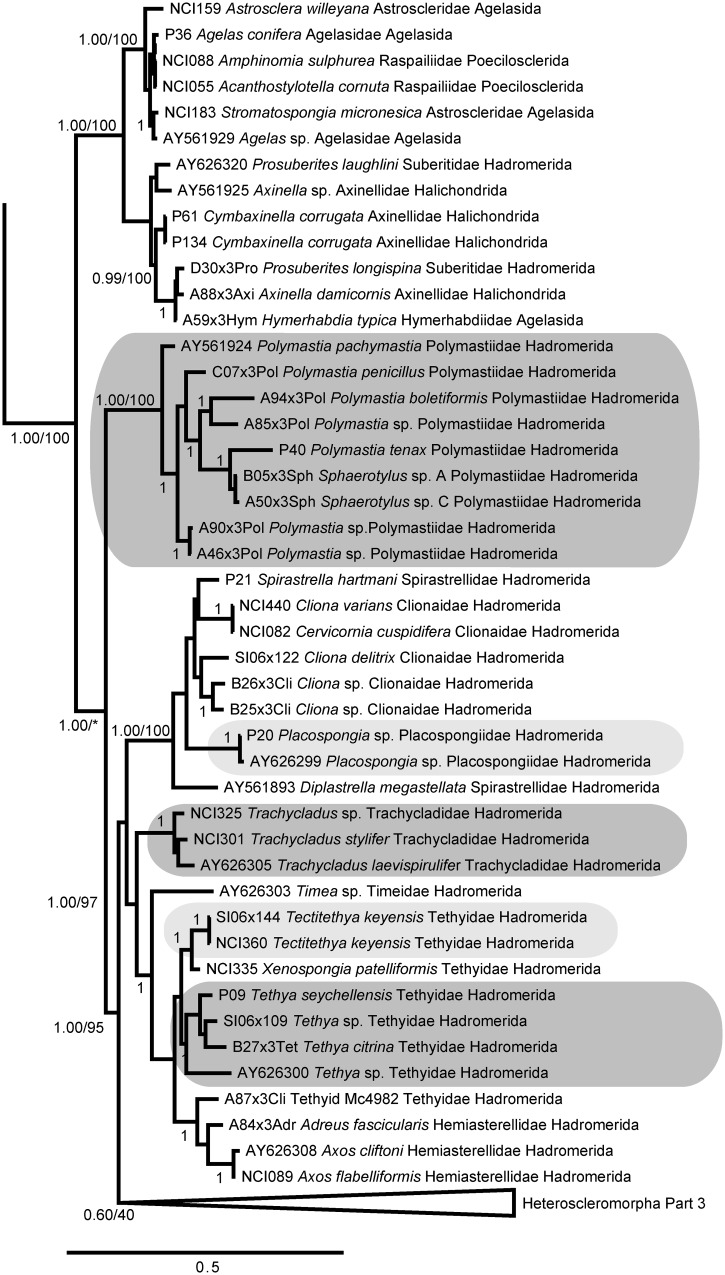
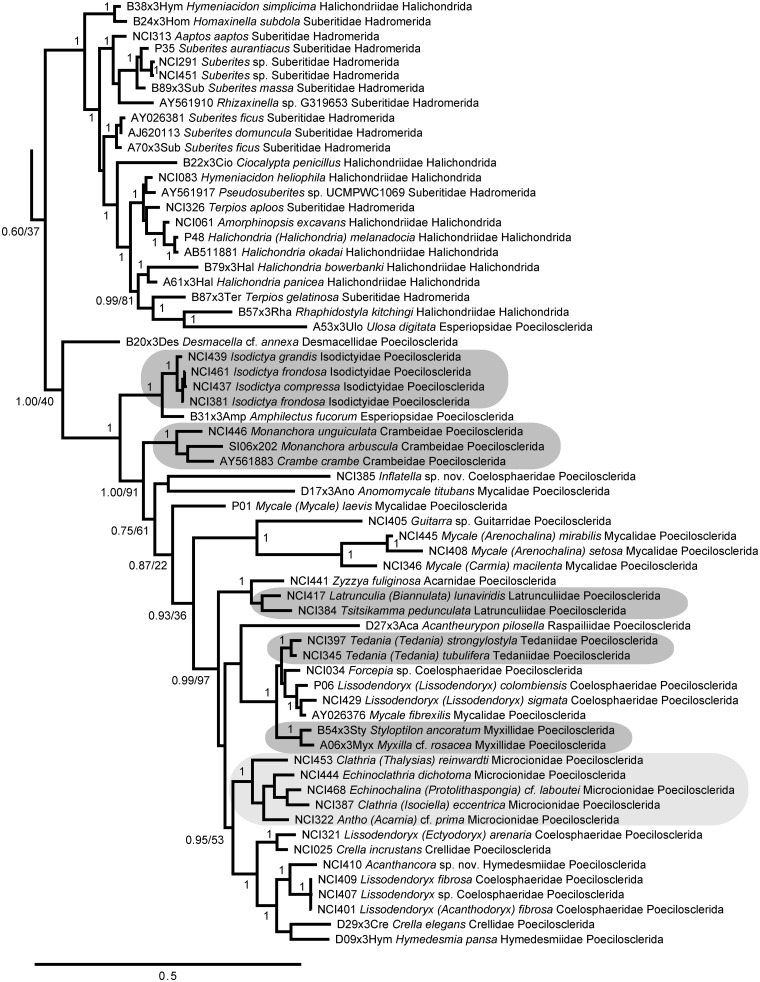
We recovered a monophyletic Heteroscleromorpha containing several nested subclades (Figs. 5–7), largely congruent with other recent analyses (Morrow et al. 2012, 2013). The taxon labels on our figures follow the most recent accepted names in the World Porifera Database (www.marinespecies.org/porifera) and demonstrate the polyphyletic nature of most orders and families in the currently accepted taxonomic classification of Heteroscleromorpha. However, we found strong support for the more recent revisions proposed by Morrow et al. (2012), recovering the revised concepts of Scopalinidae, Biemnidae (= Desmacellidae in Morrow et al. 2012), Axinellidae, Tetractinellida, Raspailiidae, and Dictyonellidae (Fig. 5; Morrow et al. 2013). We also found strong support for a revised Agelasida (including members of Hymerrhabdiidae and Agelasida), Polymastiidae, Clionaidae + Spirastrellidae + Placospongiidae, Trachycladidae, and Tethyidae + Hemiasterellidae (Fig. 6). The family Subertitidae was recovered as polyphyletic with Halichondriidae (Fig. 7), but the majority of Poecilosclerida was recovered as a monophyletic clade (Fig 7). In particular, the traditional concept of Poecilosclerida was recovered if families Raspailiidae and Biemnidae were removed from this order, as suggested by Morrow et al. (2012). Within Poecilosclerida, some genera with multiple specimens were represented as monophyletic clades (e.g., Tedania, Isodictya), while others were dispersed across the phylogeny (e.g., Mycale, Lissodendoryx, Clathria, Crella). Some of these discrepancies could be due to misidentifications (e.g., one of us, AGC, suggests that AY026376 [shown here and in GenBank as Mycale fibrexilis] is not correctly identified), but many must arise from the homoplasious nature of morphological features within this group (Morrow et al. 2013).
Fig. 5.
Bayesian topology of phylogenetic relationships within Heteroscleromorpha, Part 1, continuing onto Figs. 6 and 7. Gray boxes indicate monophyletic groupings of family Desmacellidae and order Astrophorida. Numbers at nodes correspond to PP and ML bootstrap values (PP/ML). A value of 1 indicates PP = 1.00 and ML > 90. Asterisks indicate nodes not present in the ML topology. Scale bar indicates 0.5 substitutions per site.
Fig. 6.
Bayesian topology of phylogenetic relationships within Heteroscleromorpha, Part 2, continuing onto Fig. 7. Gray boxes indicate monophyletic groupings of families Polymastiidae, Placospongiidae, and Trachycladidae and genera Tectitethya and Tethya. Numbers at nodes correspond to PP and ML bootstrap values (PP/ML). A value of 1 indicates PP = 1.00 and ML > 90. Asterisks indicate nodes not present in the ML topology. Scale bar indicates 0.5 substitutions per site.
Fig. 7.
Bayesian topology of phylogenetic relationships within Heteroscleromorpha, Part 3, continued from Fig. 6. Gray boxes indicate monophyletic groupings of families Isodictyidae, Crambeidae, Latrunculiidae, Tedaniidae, Myxillidae, and Microcionidae. Numbers at nodes correspond to PP and ML bootstrap values (PP/ML). A value of 1 indicates PP = 1.00 and ML > 90. Asterisks indicate nodes not present in the ML topology. Scale bar indicates 0.5 substitutions per site.
When examining orders within Heteroscleromorpha, we found that Hadromerida was polyphyletic. These data support the construction of new orders for (1) Polymastiidae; (2) the clade containing Clionaidae + Spirastrellidae + Placospongiidae; and (3) the clade containing Suberitidae + Halichondriidae. We propose that the name Hadromerida could be reserved for the most inclusive clade containing Trachycladidae, Tethyidae, Hemiasterellidae, and Timeidae. New orders are also needed to represent Dictyonellidae and Biemnidae (Morrow et al. 2013). We also found strong support for Cymbaxinellap, a recently proposed phylocode clade that includes Axinella damicornis, as a sister group to Agelas (Fig. 6) (Gazave et al. 2010; Cárdenas et al. 2012).
Our dataset provides the first genetic information for the genus Pararhaphoxya (Fig. 5). In the absence of molecular data, Morrow et al. (2012) maintained this genus in Axinellidae. However, Pararhaphoxya displays morphological affinities with Dictyonellidae, as it possesses megascleres that are sinuous strongyles, while microscleres are absent. These features are similar to those of the genus Acanthella, with which Pararhaphoxya forms a strongly supported clade (Fig. 5).
Calcarea
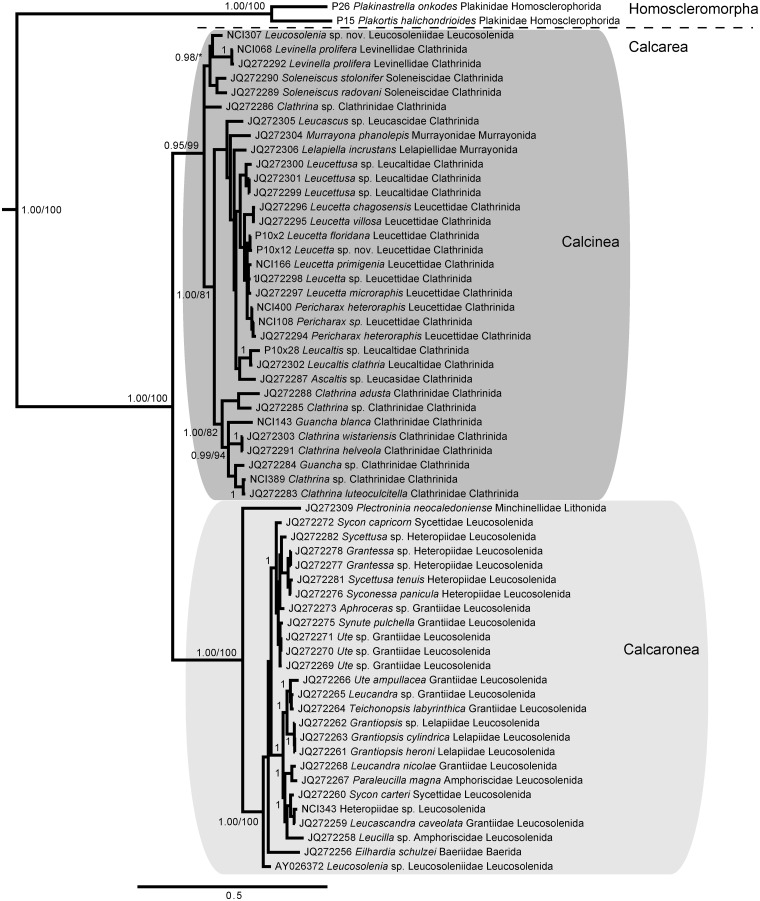
We recovered a monophyletic clade for Calcarea, as well as the subclasses Calcinea and Calcaronea (Fig. 8). Within these clades, our results were congruent with those of Voigt et al. (2012), as expected, given that 47 of the 59 calcarean sequences were from this previous study. Notably, our dataset added two taxa to the Soleneiscidae + Levinellidae clade obtained by Voigt et al. (2012), as well as three specimens to Leucetta, two species to Pericharax, and two species to Clathrinidae. We also added a specimen from family Heteropiidae that grouped with Sycon carteri, further supporting the divergent, polyphyletic pattern of Heteropiidae demonstrated by Voigt et al. (2012).
Fig. 8.
Bayesian topology of phylogenetic relationships within Homoscleromorpha and Calcarea. Gray boxes indicate the two monophyletic subclasses of Calcarea: Calcinea and Calcaronea. Numbers at nodes correspond to PP and ML bootstrap values (PP/ML). A value of 1 indicates PP = 1.00 and ML > 90. Asterisks indicate nodes not present in the ML topology. Scale bar indicates 0.5 substitutions per site.
Conclusions
One of our major goals for the PorToL project was to assess whether additional taxonomic and genetic sampling support the traditional definitions of major lineages of Porifera. Our dataset of nearly complete 28S gene sequences provides a relatively conservative evolutionary marker for this assessment, but recovers the four classes of Porifera and the four constituent clades of Demospongiae. Our current dataset can only address Calcarea, Keratosa, Myxospongiae, Haploscleromorpha, and Heteroscleromorpha, but within each of these major groups, we found multiple orders and families to be polyphyletic. These results force us to consider new ways to classify poriferan taxa, including the construction of new orders, the assignment of existing families to different orders and the need for new diagnostic definitions of groups containing homoplasic morphological characters (Morrow et al. 2013). However, this 28S dataset should not be considered in isolation; thus, Redmond et al. (2013) provide a congruent analysis of 18S gene sequences for a more heavily sampled set of demosponge clades, whereas Morrow et al. (2013) provide a congruent analysis of 18S, 28S, and cox1 gene sequences for a subset of taxa within Heteroscleromorpha.
As we continue to develop the 28S gene as a marker for poriferan phylogenetics, we must also determine the most appropriate computational methods to accurately add shorter “barcode” sequences into alignments of nearly complete sequences. We are currently investigating multiple techniques including the use of multiple data partitions, the use of full-length alignments as constraints for shorter alignments, and the use of methods based on super-trees. We are also developing methods to incorporate morphological data into these phylogenies by constructing an ontology of sponge anatomy (available at http://code.google.com/p/porifera-ontology/), based on the standardization of morphological terms edited by Boury-Esnault and Rützler (1997). By combining the relatively conservative 28S dataset with 18S sequences, faster-evolving markers, and morphological characters, we seek to construct a definitive phylogeny of sponge orders and families. The enhanced phylogenetic knowledge generated by this project will be a useful tool for investigations of the physiology, developmental biology, and ecology of sponges, and for improving conservation efforts in marine and freshwater ecosystems.
Supplementary Material
Acknowledgments
We are extremely grateful to David Newman for providing permission to access the NCI’s collection of sponges, housed at the NMNH, Smithsonian Institution. These specimens were originally collected by Dr Pat Colin and Lori B. Colin of the Coral Reef Research Foundation (CRRF), Koror, Palau; we thank CRRF for providing access to an immense amount of metadata for each specimen. We thank many undergraduate research students at the University of Alabama at Birmingham and the University of Richmond for their contributions to the laboratory research presented here. Dr Chris Freeman, Kenan Matterson, Dr Rachel Collin, and the staff of the Smithsonian Tropical Research Institute’s Bocas del Toro Research Station provided additional field assistance.
Funding
This work was supported by grants from the US National Science Foundation, Division of Environmental Biology [grant numbers 0829763, 0829783, 0829791, and 0829986]. This research was also supported by the University of Alabama at Birmingham (UAB) Center for AIDS Research, funded by the US National Institutes of Health [program P30 AI027767]. Additional support for the symposium, Assembling the Poriferan Tree of Life, held at the 2013 Annual Meeting of the Society for Integrative and Comparative Biology (SCIB), was provided by the American Microscopical Society, the SICB Division of Phylogenetics and Comparative Biology, and the SICB Division of Invertebrate Zoology.
Supplementary Data
Supplementary Data are available at ICB online.
References
- Bergquist PR, Cook SDC. Order Halisarcida Bergquist, 1996. In: Hooper JNA, Van Soest RWM, editors. Systema Porifera. New York, USA: Kluwer; 2002. p. 1077. [Google Scholar]
- Borchiellini C, Chombard C, Lafay B, Boury-Esnault N. Molecular systematics of sponges (Porifera) Hydrobiology. 2000;420:15–27. [Google Scholar]
- Boury-Esnault N, Rutzler K. Thesaurus of sponge morphology. Washington (DC): Smithsonian Institution Press; 1997. [Google Scholar]
- Cárdenas P, Pérez T, Boury-Esnault N. Sponge systematics facing new challenges. Adv Mar Biol. 2012;61:79–209. doi: 10.1016/B978-0-12-387787-1.00010-6. [DOI] [PubMed] [Google Scholar]
- Diaz MC, Thacker RW, Redmond NE, Matterson KO, Collins AG. Phylogenetic novelties and geographic anomalies among tropical Verongida. Integr Comp Biol. 2013;53:482–94. doi: 10.1093/icb/ict033. [DOI] [PubMed] [Google Scholar]
- Gazave E, Carteron S, Chenuil A, Richelle-Maurer E, Boury-Esnault N, Borchiellini C. Polyphyly of the genus Axinella and of the family Axinellidae (Porifera: Demospongiaep) Mol Phyl Evol. 2010;57:35–47. doi: 10.1016/j.ympev.2010.05.028. [DOI] [PubMed] [Google Scholar]
- Hill MS, Hill AL, Lopez J, Peterson KJ, Pomponi S, Diaz MC, Thacker RW, Adamska M, Boury-Esnault N, Cárdenas P, et al. Reconstruction of family-level phylogenetic relationships within Demospongiae (Porifera) using nuclear encoded housekeeping genes. PLoS ONE. 2013;8:e50437. doi: 10.1371/journal.pone.0050437. [DOI] [PMC free article] [PubMed] [Google Scholar]
- Hooper JNA, Lévi C. Biogeography of Indo-west Pacific sponges: Microcionidae, Raspailiidae, Axinellidae. In: Van Soest RWM, van Kempen ThMG, Braekman JC, editors. Sponges in time and space. Rotterdam, Netherlands: Balkema; 1994. pp. 191–212. [Google Scholar]
- Hooper JNA, Van Soest RWM, editors. Systema Porifera. New York, USA: Kluwer; 2002. [Google Scholar]
- Katoh K, Toh H. Improved accuracy of multiple ncRNA alignment by incorporating structural information into a MAFFT-based framework. BMC Bioinformatics. 2008;9:212. doi: 10.1186/1471-2105-9-212. [DOI] [PMC free article] [PubMed] [Google Scholar]
- Kober KM, Nichols SA. On the phylogenetic relationships of hadromerid and poecilosclerid sponges. J Mar Biol Ass UK. 2007;87:1585–98. [Google Scholar]
- Lartillot N, Lepage T, Blanquart S. PhyloBayes 3: a Bayesian software package for phylogenetic reconstruction and molecular dating. Bioinformatics. 2009;25:2286–8. doi: 10.1093/bioinformatics/btp368. [DOI] [PubMed] [Google Scholar]
- Leal MC, Puga J, Serôdio J, Gomes NCM, Calado R. Trends in the discovery of new marine natural products from invertebrates over the last two decades – where and what are we bioprospecting? PLoS ONE. 2012;7:e30580. doi: 10.1371/journal.pone.0030580. [DOI] [PMC free article] [PubMed] [Google Scholar]
- Medina M, Collins AG, Silberman JD, Sogin ML. Evaluating hypotheses of basal animal phylogeny using complete sequences of large and small subunit rRNA. Proc Natl Acad Sci USA. 2001;98:9707–12. doi: 10.1073/pnas.171316998. [DOI] [PMC free article] [PubMed] [Google Scholar]
- Morrow CC, Picton BE, Erpenbeck D, Boury-Esnault N, Maggs CA, Allcock AL. Congruence between nuclear and mitochondrial genes in Demospongiae: a new hypothesis for relationships within the G4 clade (Porifera: Demospongiae) Mol Phyl Evol. 2012;62:174–90. doi: 10.1016/j.ympev.2011.09.016. [DOI] [PubMed] [Google Scholar]
- Morrow CC, Redmond NE, Picton BE, Thacker RW, Collins AG, Maggs CA, Sigwart JD, Allcock AL. Molecular phylogenies support homoplasy of multiple morphological characters used in the taxonomy of Heteroscleromorpha (Porifera: Demospongiae) Integr Comp Biol. 2013;53:428–46. doi: 10.1093/icb/ict065. [DOI] [PMC free article] [PubMed] [Google Scholar]
- Nichols SA. An evaluation of support for order-level monophyly and interrelationships within the class Demospongiae using partial data from the large subunit rDNA and cytochrome oxidase subunit I. Mol Phyl Evol. 2005;34:81–96. doi: 10.1016/j.ympev.2004.08.019. [DOI] [PubMed] [Google Scholar]
- Olson PD, Cribb TH, Tkach VV, Bray RA, Littlewood DTJ. Phylogeny and classification of the Digenea (Platyhelminthes: Trematoda) Intl J Parasitol. 2003;33:733–55. doi: 10.1016/s0020-7519(03)00049-3. [DOI] [PubMed] [Google Scholar]
- Redmond NE, McCormack GP. Large expansion segments in 18S rDNA support a new sponge clade (Class Demospongiae, Order Haplosclerida) Mol Phylogenet Evol. 2008;47:1090–9. doi: 10.1016/j.ympev.2008.02.018. [DOI] [PubMed] [Google Scholar]
- Redmond NE, Morrow C, Thacker RW, Diaz MC, Boury-Esnault N, Cárdenas P, Hajdu E, Lobo Hajdu G, Picton B, et al. Phylogeny and systematics of Demospongiae in light of new small subunit ribosomal DNA sequences. Integr Comp Biol. 2013;53:388–415. doi: 10.1093/icb/ict078. [DOI] [PubMed] [Google Scholar]
- Ridley CP, Faulkner DJ, Haygood MG. Investigation of Oscillatoria spongeliae-dominated bacterial communities in four dictyoceratid sponges. Appl Env Microbiol. 2005;72:7366–75. doi: 10.1128/AEM.71.11.7366-7375.2005. [DOI] [PMC free article] [PubMed] [Google Scholar]
- Rützler K. The role of sponges in the Mesoamerican barrier-reef ecosystem, Belize. Adv Mar Biol. 2012;61:211–71. doi: 10.1016/B978-0-12-387787-1.00002-7. [DOI] [PubMed] [Google Scholar]
- Stamatakis A, Hoover P, Rougemont J. A rapid bootstrap algorithm for the RAxML web servers. Syst Biol. 2008;57:758–71. doi: 10.1080/10635150802429642. [DOI] [PubMed] [Google Scholar]
- Tsagkogeorga G, Turon X, Hopcroft RR, Tilak MK, Feldstein T, Shenkar N, Loya Y, Huchon D, Douzery EJP, Delsuc F. BMC Evol Biol. 2009;9:187. doi: 10.1186/1471-2148-9-187. [DOI] [PMC free article] [PubMed] [Google Scholar]
- Van Soest RWM, Boury-Esnault N, Vacelet J, Dohrmann M, Erpenbeck D, et al. Global Diversity of Sponges (Porifera) PLoS ONE. 2012;7:e35105. doi: 10.1371/journal.pone.0035105. [DOI] [PMC free article] [PubMed] [Google Scholar]
- Voigt O, Collins AG, Pearse VB, Pearse JS, Ender A, Heike H, Schierwater B. Placozoa – no longer a phylum of one. Curr Biol. 2004;14:R944–5. doi: 10.1016/j.cub.2004.10.036. [DOI] [PubMed] [Google Scholar]
- Voigt O, Wülfing E, Wörheide G. Molecular phylogenetic evaluation of classification and scenarios of character evolution in calcareous sponges (Porifera, Class Calcarea) PLoS ONE. 2012;7:e33417. doi: 10.1371/journal.pone.0033417. [DOI] [PMC free article] [PubMed] [Google Scholar]
- Wörheide G, Dohrmann M, Erpenbeck D, Larroux C, Maldonado M, Voigt O, Borchiellini C, Lavrov DV. Deep phylogeny and evolution of sponges (Phylum Porifera) Adv Mar Biol. 2012;61:1–78. doi: 10.1016/B978-0-12-387787-1.00007-6. [DOI] [PubMed] [Google Scholar]
- Wulff J. Ecological interactions and the distribution, abundance, and diversity of sponges. Adv Mar Biol. 2012;61:273–344. doi: 10.1016/B978-0-12-387787-1.00003-9. [DOI] [PubMed] [Google Scholar]
Associated Data
This section collects any data citations, data availability statements, or supplementary materials included in this article.


