Abstract
To develop a drug delivery system (DDS), it is critical to address challenging tasks such as the delivery of hydrophobic and amphiphilic compounds, cell uptake, and the metabolic fate of the drug delivery carrier. Low-density lipoprotein (LDL) has been acknowledged as the human serum transporter of natively abundant lipoparticles such as cholesterol, triacylglycerides, and lipids. Apolipoprotein B (apo B) is the only protein contained in LDL, and possesses a binding moiety for the LDL receptor that can be internalized and degraded naturally by the cell. Therefore, synthetic/reconstituting apoB lipoparticle (rABL) could be an excellent delivery carrier for hydrophobic or amphiphilic materials. Here, we synthesized rABL in vitro, using full-length apoB through a five-step solvent exchange method, and addressed its potential as a DDS. Our rABL exhibited good biocompatibility when evaluated with cytotoxicity and cell metabolic response assays, and was stable during storage in phosphate-buffered saline at 4 °C for several months. Furthermore, hydrophobic superparamagnetic iron oxide nanoparticles (SPIONPs) and the anticancer drug M4N (tetra-O-methyl nordihydroguaiaretic acid), used as an imaging enhancer and lipophilic drug model, respectively, were incorporated into the rABL, leading to the formation of SPIONPs- and M4N- containing rABL (SPIO@rABL and M4N@rABL, respectively). Fourier transform infrared spectroscopy suggested that rABL has a similar composition to that of LDL, and successfully incorporated SPIONPs or M4N. SPIO@rABL presented significant hepatic contrast enhancement in T2-weighted magnetic resonance imaging in BALB/c mice, suggesting its potential application as a medical imaging contrast agent. M4N@rABL could reduce the viability of the cancer cell line A549. Interestingly, we developed solution-phase high-resolution transmission electron microscopy to observe both LDL and SPIO@rABL in the liquid state. In summary, our LDL-based DDS, rABL, has significant potential as a novel DDS for hydrophobic and amphiphilic materials, with good cell internalization properties and metabolicity.
Keywords: protein reconstitution, apolipoprotein B, low-density lipoprotein, Fourier transform infrared spectroscopy, drug delivery, solution transmission electron microscopy imaging
Introduction
For hydrophobic drug delivery, it is important to consider the physicochemical properties of macromolecules, cell uptake, and the usage of the delivery system.1 In a previous study, a PEGylated graphene oxide-mediated protein delivery system was developed to protect the protein from cell degradation.2 However, the cell internalization and metabolism of this delivery cargo, graphene oxide, remains unknown. In order to avoid metabolic issues with the delivery system, liposomes were developed as indirect drug deposit cargo for cell function regulation.3 Therefore, a good hydrophobic drug delivery system (DDS) with native-like physicochemical properties and good cell permeability is highly desired. Modified natural transporter/protein would be an excellent candidate for DDS.4 In humans, low-density lipoprotein (LDL) is the major natural transporter of cholesterol (e.g., it transports two-thirds of plasma cholesterol) and phospholipids.5 LDL is a native nanoparticle and its size is approximately 18–25 nm.6 Plasma LDL can be cleared from circulation through LDL receptor (LDLR)-mediated endocytosis. This allows for the transfer of LDL into endosomes, where the pH drops, causing LDL to dissociate from the receptor.7 The receptor is then recycled to the surface of the cell, while LDL is transferred into the lysosomes for degradation.8 This pathway could be useful for drug delivery, and may then be directed toward tumors expressing LDLR. It has been demonstrated that LDLR is overexpressed in various human cancer cell lines.9,10 Glioblastoma multiforme (GBM) is a highly aggressive tumor that accounts for approximately 85% of primary brain tumors in adults. A study on seven GBM cell lines showed that these cells have high LDLR expression.10 However, studies on the distribution of LDLR in normal rat and monkey brain tissue suggest that normal brain tissue, particularly the gray matter of the cortex, has relatively low LDLR.11 Accordingly, a LDL-based hydrophobic/amphiphilic DDS can be internalized and degraded by regular cell metabolism, and these properties can be used in targeted therapies for cancer. Apolipoprotein (apo) B is the only protein contained in LDL12 and can be purified with high purity and yield simply by gradient centrifugation.13 We attempted to reconstitute/synthesize apoB-containing lipoparticles as hydrophobic/amphiphilic compound delivery vehicles. The reconstituted apoB lipoparticle (rABL) may be an ideal carrier for transporting hydrophobic and amphiphilic compounds. However, its extremely large mass (4563 amino acids) and hydrophobic properties are major obstacles to reconstituting apoB in vitro. Consequently, synthetic nanopaticles with a small fragment of apoB14 or LDL-dextran mixture15 were developed, but their composition, biocompatibility, and drug release profile remain unclear.
Transmission electron microscopy (TEM) is well recognized for its power in spatial resolution to the Å and sub-Å level. However, the lack of sensitivity in contrast and the radiation damage caused by its use are limiting factors for its employment in biological imaging. Biological electron microscopy (EM) has also been advanced by several major developments such as cryo-microscopy, which is aided by large-scale computational processing.16 However, this type of experiment is conducted in a dehydrated state. The removal of water as part of specimen preparation may result in undesirable structural and morphological changes. Currently, a custom-made sample holder connecting with a microflow cell is available for conventional TEM (Hummingbird Scientific liquid holder).17 Instead of the system-level environmental TEM, disposable micro wet cells fabricated with a micromachining process (MEMS) have been developed; their use has circumvented the structural modifications yielded by conventional TEM. This disposable device can be inserted into a TEM specimen holder and can be examined as a regular TEM sample.18 Moreover, this method provides less contamination and lower cost, both of which are benefits for routine biological experiments. Therefore, rABL and LDL were monitored and compared directly in the liquid state.
In this study, a rABL was developed in vitro through a five-step solvent exchange process using bile salt (BS) and this process was modified from our previously studies.19−24 This stepwise process can effectively prevent aggregation and precipitation by controlling the solvent environment.21,24 The protein/lipid composition and size of the rABL were determined by cholesterol/protein quantification assay, dynamic light scattering (DLS), and novel solution-phase high-resolution transmission electron microscopy (SP-HRTEM) technique.18 rABL is a biocompatible DDS and can be incorporated by cells through LDLR-mediated endocytosis. Moreover, superparamagnetic iron oxide nanoparticles (SPIONPs),25 which are not only high electron density enhancer, but also T2 contrast enhancers for magnetic resonance imaging (MRI), were incorporated during the apoB reconstitution process. Therefore, SPIONPs-containing rABL (SPIO@rABL) showed contrast enhancement ability in in vivo MRI. Furthermore, the lipophilic anticancer drug M4N [tetra-O-methyl nordihydroguaiaretic acid (NDGA)]26 embedded into rABL (M4N@rABL) could also induce cancer cell death. This study provided insights into the physicochemical properties of rABL and demonstrated that functional apoB can be reconstituted in vitro. Moreover, the particles could be used as carriers for heterologous hydrophobic/amphiphilic molecules.
Experimental Section
Materials
All chemicals, unless otherwise noted, were purchased from Merck (Rahway, NJ) and Sigma (St. Louis, MO). Human serum was obtained from a healthy volunteer using a protocol approved by the Mackey Memorial Hospital Institutional Review Board (IRB No. 10MMHIS082). Specific pathogen-free, 4–5-week-old BALB/c mice were purchased from the National Laboratory Animal Center (Taipei, Taiwan). All experiments were carried out in accordance with the Academia Sinica Animal Care and Use Committee guideline. Noncoating 2 nm SPIONPs25 were provided by Dr. Ming-Fong Tai as a gift. M4N was synthesized by our colleague as previously described.26 Anti-apoB (C1.4) sc-13538, anti-LDLR, anti-p53, and anti-Erk antibodies were purchased from Santa Cruz Biotechnology Inc. (Santa Cruz, CA); anti-apoB polyclonal antibody was purchased from Roche (Branford, CT); cy3-conjugated secondary antibody was purchased from Jackson Immuno Research Laboratories (West Grove, PA); anti-p-p53 (ser-15), anti-p-Erk, anti-p38, and anti-p-p38 antibodies were purchased from Cell Signaling Technology (Beverly, MA); anticaspase 3 antibody was purchased from Abcam (Cambridge, UK); Hoechst 33342 was purchased from Invitrogen (Carlsbad, CA); anti-3-hydroxy-3-methylglutaryl-coenzyme A reductase (HMGR) was purchased from Millipore Corporation (Billerica, MA); phalloidin-conjugated antiactin antibody was purchased from Molecular Probe, Life Technologies (New York); the cholesterol assay kit was purchased from Cayman Chemical Company (Ann Arbor, MI).
Isolation and Delipidation of Plasma apoB
LDL was purified from human serum using potassium bromide (KBr) density gradient ultracentrifugation as described in a previous study.13 LDL was delipidated by an ice-cold methanol/ether mixture, followed by thorough mixing. The protein samples were dried in a fume hood to remove any organic solvent residual.
Cholesterol and Protein Quantification
The Bradford method was used to determine the concentration of apoB protein.27 A standard calibration curve was obtained using bovine serum albumin (BSA) as a reference protein. In LDL, the percentage of cholesterol and apoB protein were kept constant (cholesterol is 60% of the total LDL).28 We used a cholesterol assay kit (Cayman Chemical Company, Ann Arbor, MI) to analyze the cholesterol and the total lipid content with a factor of 1.33-fold of cholesterol. The cholesterol standard curve was provided with the cholesterol assay kit.
rABL Reconstitution Procedure
The denaturation and reconstitution procedure of apoB was modified from previously reported methods.19−24 Two milligrams of delipidated apoB and 6.5 mg of lipids were dissolved in separate Eppendorf tubes containing 1 mL of denaturing buffer (6 M urea, 5% BS, 0.1% mannitol, 10 mM Tris, 0.1 mM Pefabloc, and 0.1 mM dithiothreitol [DTT], pH 11.0; Table 1), and mixed gently at 4 °C for 1 h until the protein/lipid solution became clear. The apoB/lipid mixture in the denaturing/unfolding buffer was transferred into a dialysis tube (molecular weight cutoff = 3500 Da), and dialyzed against a series of buffers (Table 1) at 4 °C. The reconstitution process was promoted by the addition of detergents according to the five-step solvent exchange method (0.5, 0.1, and 0.02% BS were added into buffers 1, 2, and 3, respectively).19−24 The final rABL product was dialyzed against PBS. To prevent the oxidation of apoB and lipids, we purged the dialysis buffers with nitrogen before carrying out the reconstitution experiments.
Table 1. Chemical Compositions of Denaturing and Refolding Buffers.
| Tris (mM) | pH | urea (M) | DTT (mM) | mannitol (%) | Pefabloc (μM) | Detergent (BS) (%) | |
|---|---|---|---|---|---|---|---|
| denaturing buffer | 10 | 11 | 6 | 100 | 0.1 | 1 | 5 |
| folding buffer 1 | 10 | 11 | 2 | 0.1 | 0.1 | 0.1 | 0.5 |
| folding buffer 2 | 10 | 11 | 1 | 0.1 | 0.1 | 0.1 | 0.1 |
| folding buffer 3 | 10 | 11 | 0.1 | 0.1 | 0.1 | 0.02 | |
| folding buffer 4 | 10 | 8.8 | 0.1 | 0.1 | 0.1 | ||
| folding buffer 5 | 10 | 8.8 | 0.1 | 0.1 |
Incorporation of SPIONPs and M4N into rABL: Synthesis of SPIO@rABL and M4N@rABL
SPIONPs (final concentration 100 μg/mL of iron ions in toluene) and M4N (final concentration 10 mM) were dissolved in denaturing buffer and mixed with the lipids dissolved in the denaturing buffer. The mixture was purged with nitrogen gas to avoid lipid oxidation. After the mixture was incubated with gentle shaking at 4 °C for 1 h, it was mixed with denatured apoB as described above in the reconstitution section.
Observation of rABL with Fluorescence Microscopy
ApoB polyclonal antibody (Roche, Branford, CT) was coated on a cover glass at 37 °C for 1 h. After blocking in PBS buffer containing 5% fat-free dry milk for 1 h, rABL and LDL were incubated and immobilized with the apoB antibody (Roche, Branford, CT) that coated the cover glass. The cover glass was incubated with monoclonal anti-apoB antibody (Santa Cruz Biotechnology Inc. Santa Cruz, CA) for 2 h and then incubated with Cy3-conjugated secondary body for 30 min to label apoB (Santa Cruz, CA) antibody. Furthermore, the cover glass was incubated with DiO (Invitrogen, Carlsbad, CA) for 40 min. The florescence of apoB protein and lipids was observed with florescence microscopy using BrightLin single-band filter sets (Semrock, Inc. Rochester, NY) to obtain the highest signal-to-noise ratio images. LDL and rABL imaging were performed using an iXon+ 897 electron multiplying charge-coupled device camera (Andor Technology PLC, Belfast BT127AL, UK) at −80 °C. Image analysis was performed using ImageJ software (National Institutes of Health, Bethesda, MD).
Analysis of rABL, SPIO@rABL, and M4N@rABL Particle Size by DLS
rABL, SPIO@rABL, and M4N@rABL were used for particle size measurement by DLS at a concentration of 0.2 mg/mL. DLS is an absolute measurement and it is a powerful tool for determining small changes in the size of particles.29 DLS measurements were performed using a goniometer obtained from Brookhaven Instruments Corp. (Holtsville, NY), equipped with a diode-pumped laser (Coherent, Santa Clara, CA) with a wavelength (λ) of 532.15 nm and a power of 10 mW. The scattered light was collected at 90°. The chamber temperature was kept at 20 °C with a water circulator. The autocorrelation function was computed using a digital correlator (BI 9000, Brookhaven Instruments Corp) and then analyzed using the non-negative least-squares (NNLS) method.30 The DLS assays were carried out on five batches.
Cellular Uptake, Cytotoxicity, and LDLR Competition Test of rABL
THP-1 and A549 cells were cultured in RPMI-1640 medium (Invitrogen, Carlsbad, CA) supplemented with 10% fetal bovine serum (FBS), 100 U/mL penicillin, and 10 μg/mL streptomycin.
For the cellular uptake assay, the cells were treated with LDL or rABL for 11 h, and harvested via centrifugation (10 min, 200 × g, room temperature). The cells were washed twice with PBS to remove free LDL and rABL. The cells were then fixed with 4% paraformaldehyde, and the cell membrane was permeabilized with 0.2% Triton X-100. ApoB, nuclei, and actin were stained with apoB antibody (Santa Cruz Biotechnology, Inc.), Hoechst 33342, and phalloidin-conjugated antiactin antibody, respectively.
For the cytotoxicity assay, THP-1 and A549 cells were cultured in serum-free medium for 16 h in a 24-well plate, and treated with rABL and LDL (5, 10, 20, 30, 50, and 100 μg/mL) for an additional 11 h to monitor the cytotoxicity. The trypan blue exclusion method was used to determine cell viability,31 wherein at least 400 cells were counted in each well.
For the LDLR competition test of rABL, cells were washed twice with PBS and incubated in serum-free medium for 16 h. Anti-LDLR antibody was dialyzed against PBS twice to remove sodium azide. Owing to the cytotoxicity caused by blocking LDLR,32 LDLR antibody (final concentration, 10 μg/mL) was added to the A549 cells and incubated for 1 h. LDL (or rABL) was added to the A549 cells (final concentration, 10 μg/mL) and incubated for an additional 5 h. The cells were washed twice with PBS to remove free LDL (or free rABL), and were then fixed with 4% paraformaldehyde. The cell membrane was permeabilized with 0.2% Triton X-100. ApoB and nuclei were stained with anti-apoB antibody (Santa Cruz Biotechnology Inc.) and Hoechst 33342, respectively.
Competition Test of LDL and M4N@rABL
A549 cells were cultured as described above, washed twice with PBS, and incubated in serum-free medium for 16 h. LDL (20 μg/mL), M4N (100 μM), M4N@rABL (20 μg/mL rABL with 100 μM M4N), and M4N@rABL (20 μg/mL rABL with 100 μM M4N) plus LDL (40 μg/mL) were added to the A549 cells and incubated for an additional 24 h. The cells were washed twice with PBS and incubated in serum-containing medium for an additional 48 h. The cell viability was determined by the trypan blue exclusion method.31
Western Blot Analysis of Cell Metabolic Responses
A549 and THP-1 cells were cultured as described above. The cells were washed twice with PBS and incubated in serum-free medium for 8 h. After the incubation, the cells were treated with LDL (final concentration, 20 μg/mL), rABL (final concentration, 20 μg/mL), and oxaliplatin (final concentration, 10 μM). After the cell lysates were prepared, the expression level of these proteins was detected by anti-HMGR, anti-p53, anti-p-p53 (ser-15), anti-Erk, anti-p-Erk, anti-p38, anti-p-p38, anticaspase 3, and antiactin antibodies by the conventional Western blot procedure.
Molecular Imaging of SPIO@rABL and LDL with SP-HRTEM
For SP-HRTEM imaging, SPIO@rABL and LDL samples were sealed in a self-aligned wet (SAW) cell.18 The morphology of the SPIO@rABL and LDL particles was observed using a field emission gun (FEG)-TEM (JEM-2010F, JEOL, Tokyo, Japan). In brief, 0.5 μL of LDL was first dropped into the out-frame (bottom part) of a SAW cell and then sealed with an in-frame (top cover) using vacuum grease and epoxy glue.18 The in- and out-frames had thin silicon nitride membranes (∼20 nm) as transparent windows for a 200-KeV electron beam. The sealed SAW cells (with a dimension of 2.4 mm × 2.4 mm and 400 μm in height) were placed into a standard TEM holder directly and observed as a regular TEM sample in the JEM-2010 (JEOL) instrument operated at an acceleration voltage of 200 kV.
Fourier Transform Infrared Spectroscopy (FTIR) Analysis
FTIR spectra of SPIONPs, LDL, rABL, M4N, M4N@rABL, and SPIO@rABL were obtained with a PerkinElmer Spectrum 100 FTIR spectrometer (PerkinElmer, Waltham, MA) using potassium bromide pellets. The spectra were averages of 32 scans recorded at a resolution of 4 cm–1 in the range of 4000–450 cm–1.
Zeta Potential Measurements
The zeta potentials of LDL, rABL, SPIO@rABL, and M4N@rABL were measured using a Delsa NanoC photon correlation spectrometer (Beckman Coulter Inc., Brea, CA). The concentrations of the samples were adjusted to 0.5 mg/mL, and their zeta potentials were calculated according to Smoluchowski’s equation.33 The zeta potential assays were carried out on five batches.
In Vivo MR Imaging Examination
Three hundred microliters of SPIO@rABL (250 μg/mL iron ions and 500 μg/mL LDL) were injected into specific pathogen-free, 4–5-week-old BALB/c mice via intravenous administration. All the animals received humane care in compliance with the institution’s guidelines for maintenance and use of laboratory animals in research. Sequential MRI acquisition was performed using a 9.4-T MR imager (Bruker BioSpec 94/20 USR) equipped with a high performance transmitter–receiver volume coil at a maximal gradient strength of 600 mT m–1). For image analysis, MR imaging signal intensities were measured using ParaVision 5.0 and Matlab 6.0 softwares for Windows. The signal-to-noise ratio (SNR) of the liver was calculated from the signal intensity of the liver and standard deviation (SD) of the background noise according to the following formula
| 1 |
For T2-weighted imaging, the mice were anesthetized using 2% isoflurane (Abbott Laboratories, Abbott Park, IL) mixed with 100% O2, which was delivered using a veterinary anesthesia delivery system (ADS 1000; Engler), and then subjected to SPIO@rABL particle (5.0 mg [Fe]/kg) injection. All the nanoparticles were dispersed in PBS buffer, and injected via the tail vein. The contrast signal was obtained using a TurboRARE T2 pulse sequence: TR/TE/FA, 3000 ms/28 ms/180°; MTX, 256 × 128 × 16; FOV, 80 × 40 × 1.0 mm3, and a NEX of 10.
Drug Release Profile Analysis
M4N@rABL and SPIO@rABL were transferred into a dialysis tube (molecular weight cutoff = 3500 Da) and dialyzed against PBS for 48 h. The released M4N was quantified using a Jasco V-550 (Jasco Ltd., Tokyo, Japan) spectrophotometer at 280 nm. For iron ion quantification, 100 μL of 12N HCl was added to 100 μL of sample. The mixture was first incubated at room temperature for 30 min, and then at 60 °C for 1 h. Two hundred microliters of 1% ammonium persulfate (APS) solution was added to the previous mixture. The mixture was added with 400 μL of 0.1 M potassium thiocyanate (KSCN) and incubated for 5 min. The concentration of iron ions was measured using a Jasco V-550 spectrophotometer at 495 nm.
Statistical Analysis
All the quantitative assays were carried out in 3–10 replicates and the data were expressed as mean ± standard error of the mean (SEM). A P value less than 0.05 was considered statistically significant.
Results and Discussion
ApoB (Figure 1a) was obtained through delipidation of LDL (d = 1.062–1.063 g/mL)13 in high purity. Additionally, the yield of apoB is approximately 20–40 mg/dL from human serum. According to a systematic testing procedure, the modified five-step solvent exchange process using BS described in the method section could reconstitute the apoB lipoparticle without aggregation.
Figure 1.
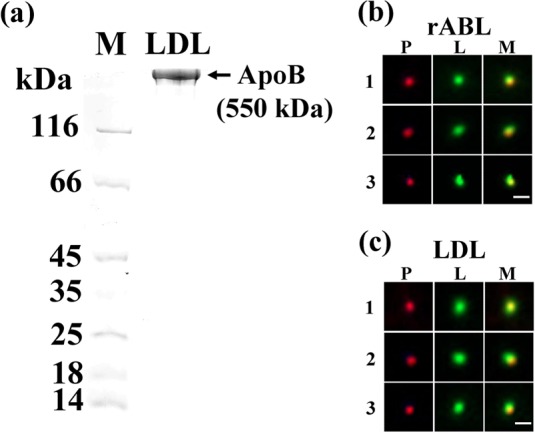
(a) SDS-PAGE analysis of LDL isolated from human plasma via density centrifugation. Fluorescence images of (b) rABL and (c) LDL. The P denotes the protein signal (apoB); L denotes the lipid signal; M denotes the merged image of apoB and lipid; 1, 2, and 3 denote that the image was obtained from three independent experiments. ApoB was identified by the corresponding antibody, and stained with the red fluorescence dye Cy3. The lipids were stained with the green fluorescent dye DiO. The scale bar is 1 μm.
The amount of lipids associated with the rABL was quantified semiempirically by immunostaining fluorescence microscopy (Figure 1b), and the data were expressed as the ratio of fluorescence intensity (Il/IapoB) between lipids (green) and apoB (red) using a calibrated cholesterol/protein quantification method. The Il/IapoB values of rABL (Figure 1b) and LDL (Figure 1c) are 2.00 ± 0.04 and 2.06 ± 0.14, respectively. Additionally, the real cholesterol/protein ratio of rABL was quantified with cholesterol/protein quantification method.27,34 The cholesterol/protein values for LDL and rABL were 1.978 ± 0.102 and 1.968 ± 0.073, respectively (Table 2), consistent with those reported previously.28 The rABL is stable, and can be stored at 4 °C for several months for usage in following studies.
Table 2. Cholesterol/Protein Quantification Assay of LDL and rABL.
| protein (apoB) unit (μg/mL) | cholesterol unit (μg/mL) | ratio | |
|---|---|---|---|
| LDL | 241.81 ± 12.17 | 478.41 ± 5.34 | 1.978 ± 0.102 |
| rABL | 242.66 ± 8.41 | 477.59 ± 6.31 | 1.968 ± 0.073 |
| ref (28) | 1.957 |
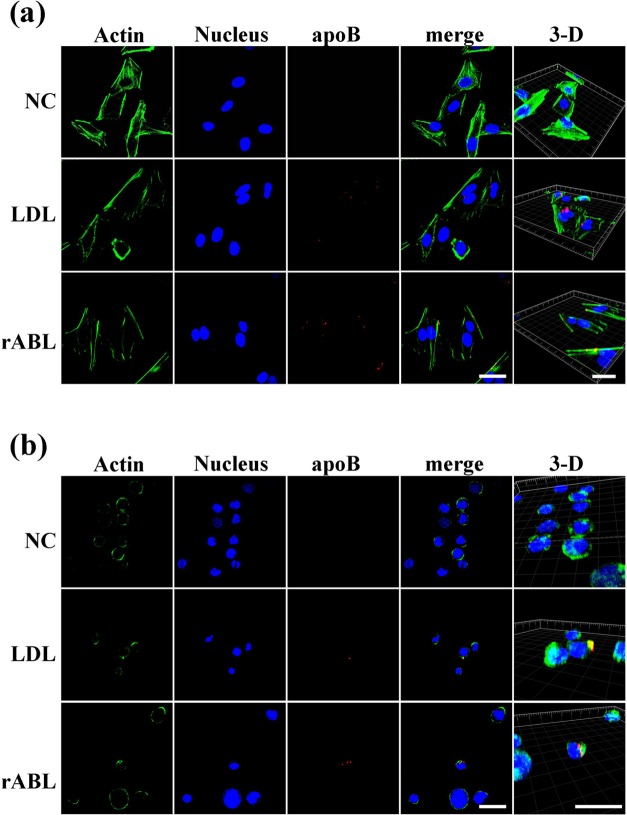
The capability of rABL to bind LDLR and elicit receptor-mediated endocytosis was tested using the solid tumor cell line A549 (Figure 2a),35 and leukemia THP-1 cells (Figure 2b).36 The cells were treated with PBS as a negative control, LDL, and rABL. Both A549 and THP-1 cells recognized rABL in a manner similar to that of LDL. To ascertain whether the uptake of rABL was mediated by LDLR and not by other receptors (such as scavenger receptors that are highly expressed in THP-1 cells37), we treated A549 cells devoid of scavenger receptor expression with LDLR antibody. The uptake of rABL (89.2 ± 10.1%) was similar to that of LDL (100 ± 12.4%) and was likewise decreased upon LDLR antibody treatment (39.5 ± 13.1 and 38.4 ± 11.9% for LDL and rABL, respectively; Figure 3a). These data suggested that the rABL was internalized into the cells through receptor-mediated endocytosis. Namely, rABL can be recognized by LDLR.
Figure 2.
(a) A549 and (b) THP-1 cells were treated with PBS (upper panel, negative control, NC), LDL (middle panel), and rABL (lower panel) to determine the biological functions of rABL. rABL was taken by A549 and THP-1 cells. Nuclei were stained with Hoechst 33342 (blue), and apoB was stained with Cy3-conjugated antibody (red). Actin was stained with phalloidin-conjugated antibody (green). 3-D denoted the three-dimensional image which was constructed from the confocal images. The scale bar is 30 μm.
Figure 3.
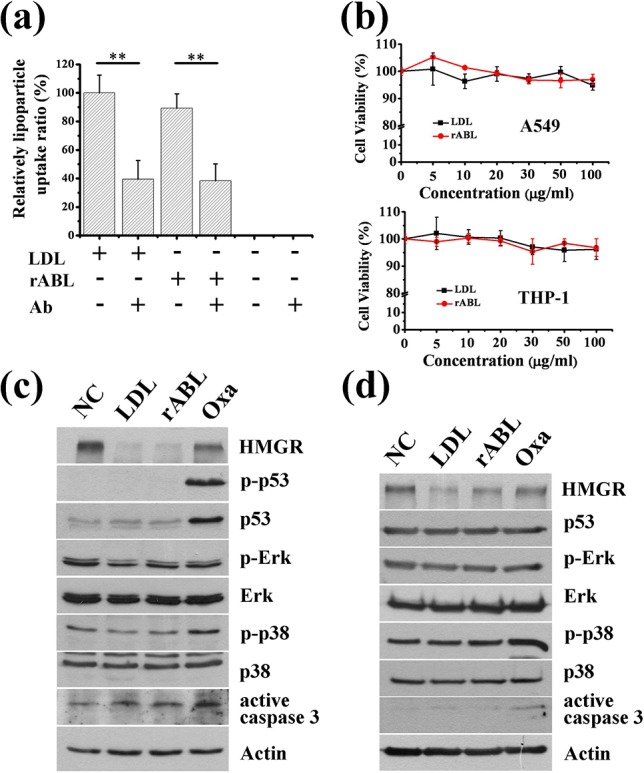
(a) LDLR competition test results of LDL and rABL. In this experiment, approximately 200 cells were collected for each condition, and LDL-stained cells were counted. PBS was used as additive control. **P < 0.01. (b) Cell viability assay of LDL- and rABL-treated A549 (upper) and THP-1 (lower) cancer cell lines at various concentrations. For clearly presenting these data, the X-axis of both figures are not in the linear scale. Western blot analysis of HMGR, and oxidative stress response proteins p53, p38, and Erk; and apoptosis response factor caspase 3 in (c) A549 and (d) THP-1 cells treated with LDL and rABL for 11 h (left panel). NC, untreated control; Oxa, oxaliplatin.
Moreover, no apparent alteration in viability occurred in A549 (Figure 3b, upper panel) or THP-1 (Figure 3b, lower panel) cells that absorbed rABL or LDL at various doses from 5 to 100 μg/mL. The levels of expression, phosphorylation, and cleavage of oxidative stress response proteins such as p-p53 (ser-15), p-p38, and p-Erk were unchanged compared to those that accompanied the treatment with LDL, and no change occurred in the expression of apoptosis marker proteins such as caspase 3 (Figure 3c, d). In these experiments, THP-1 cells expressing a mutant form of p53 (Figure 3d)38 were used as a negative control for p-p53 activity, whereas oxaliplatin was used as a positive control for oxidative stress and cell apoptosis. Downregulation of 3-hydroxy-3-methylglutaryl-CoA reductase (HMGR), a well-known phenomenon after the cellular uptake of LDL,39,40 was observed in A549 (Figure 3c) and THP-1 (Figure 3d) cells treated with rABL, providing further evidence of the functionality of rABL. Together, these results suggest that rABL is a functional, biocompatible LDL-like particle.
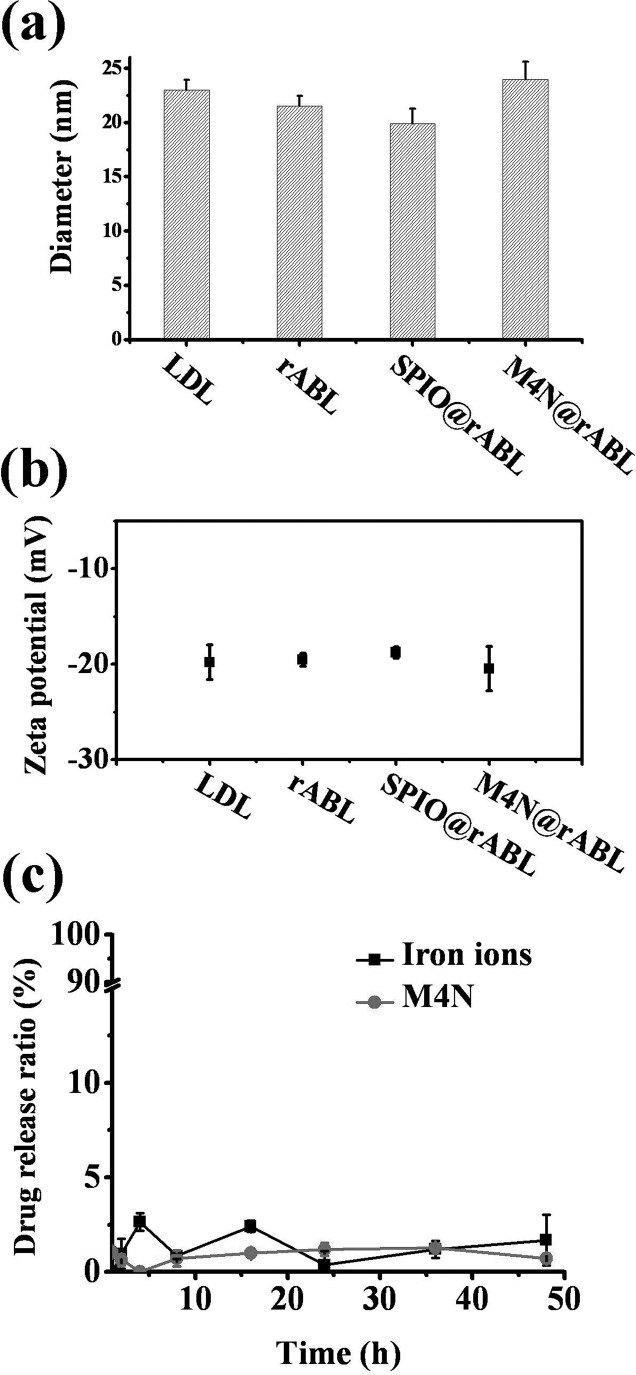
In addition, we tested the capability of rABL to serve as a carrier for heterologous hydrophobic molecules. With this achievement in mind, a hydrophobic molecule, SPIONPs, and a small lipophilic anticancer drug (358 Da), M4N, were tested for incorporation into rABL. Incorporation of SPIONPs and M4N into rABL was achieved when SPIONPs and M4N were added at the initial stage of the 5-step solvent exchange process. The sizes of rABL, SPIO@rABL, and M4N@rABL determined with DLS were 21.5 ± 0.93, 19.9 ± 1.33, and 23.9 ± 1.6 nm, respectively, with single distribution, similar to LDL (23.0 ± 0.95 nm; Figure 4a). The size range of rABL (19.9–23.9 nm) is consistent with that reported for LDL (18–25 nm).6 The surface charges of LDL, rABL, SPIO@rABL, and M4N@rABL determined through the zeta potential analysis were −19.8 ± 1.84, −19.5 ± 0.67, −18.79 ± 0.56, and −20.5 ± 2.32 mV, respectively (Figure 4b). These results suggested that the physicochemical properties of SPIO@rABL and M4N@rABL are similar to those of rABL and LDL. Additionally, the drug release profile analysis indicated that less than 3% of SPIONPs or M4N were released from SPIO@rABL or M4N@rABL in the PBS buffer over 48 h (Figure 4c). This result implies that the SPIONPs and M4N are stable in rABL.
Figure 4.
(a) Particle sizes of LDL, rABL, and SPIO@rABL measured by DLS. (b) Zeta potentials of LDL, rABL, and SPIO@rABL. (c) Drug release profile measurements of iron ions and M4N. The relative concentrations of released iron ions and M4N were compared with rABL-embedded iron ions and M4N (SPIO@rABL and M4N@rABL) at initial state.
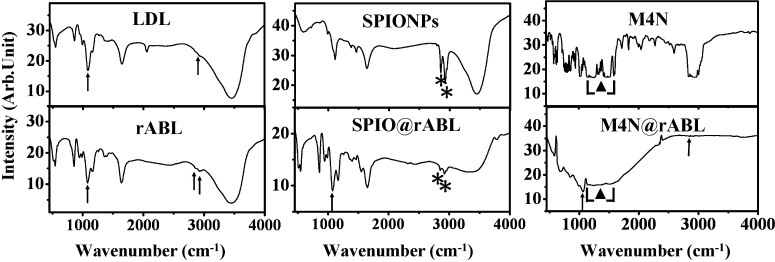
SPIO@rABL and M4N@rABL were further analyzed with FTIR (Figure 5, Table 3). FTIR indicated that the composition of rABL was consistent with the composition of LDL and that SPIONPs as well as M4N were incorporated into rABL.
Figure 5.
FTIR spectra of LDL, rABL, SPIONPs, SPIO@rABL, M4N, and M4N@rABL. Stars, arrows, and triangles indicate signals from SPIONPs, protein/lipid, and M4N, respectively. The Fe–O signal was observed at 621 cm–1, but overlapped with those of protein and lipids. 3-Aminopropyl triethoxysilane, a surface functional reagent for SPIONPs, was observed at 2857 and 2929 cm–1. The C–O signal for protein or phospholipids was observed at 1080 cm–1. The signal of the benzene of M4N appeared at 1200–1600 cm–1.
Table 3. Peaks Assignment of FTIR of SPIONPs, SPIO@rABL, M4N, M4N@rABL, rABL, and LDL.
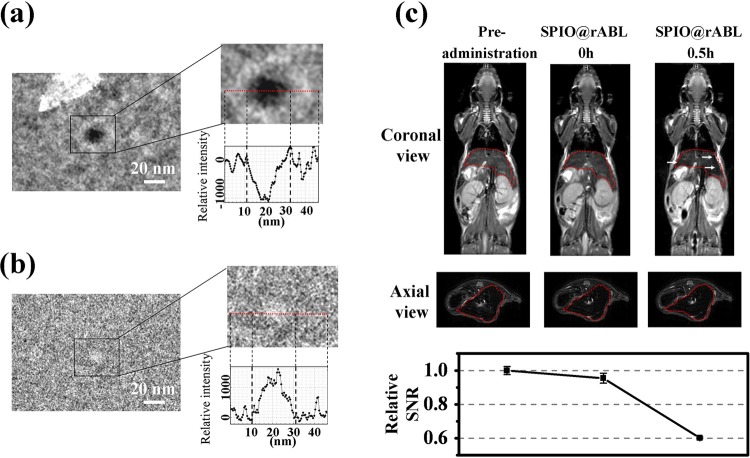
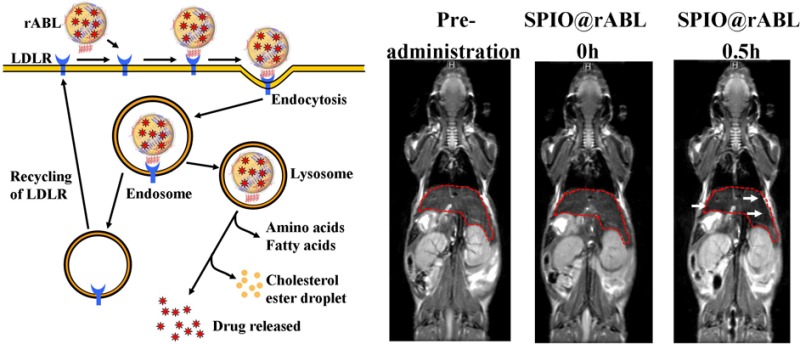
To observe SPIO@rABL at the single-molecular level, and to compare it with the LDL in native solution environment, the SP-HRTEM technique was used. As shown in Figure 6a, SPIO@rABL was visualized as high electron density particles. Unlike the image for SPIO@rABL, a low contrast solution image was observed for LDL (Figure 6b). The solution particle size of both SPIO@rABL (Figure 6a) and LDL (Figure 6b) was approximately 20 nm in diameter, consistent with the DLS results (Figure 4a) and previously reported data.6 This is the first TEM study of LDL and SPIO@rABL in solution. For further application, SPIO@rABL was injected into BALB/c mice and the T2-weighted MRI signal was observed. In the MR images, SNR reductions were observed in the liver at 0.5 h after administration (Figure 6c). Due to the binding of most of the LDL to hepatic LDLR,41 a reduction of the T2-weighted MRI signal of the liver was observed.
Figure 6.
(a) SP-HRTEM was used to identify SPIO@rABL. SPIO@rABL contains a high electron density (scale bar is 20 nm). (b) LDL particle observed as a control is indicated with a black dot circle (scale bar is 20 nm). The red lines of a and b denote the relative imaging intensity. (c) In vivo imagining pattern of coronal view (upper panel) and axial view (middle panel) of SPIO@rABL contrast enhanced MRI in mice liver. The SPIO@rABL 0.5-h MRI image compared mice in the preadministration state, whereas SPIO@rABL at 0 h showed signal reduction (arrows) in liver (red circle) after SPIO@rABL administration to mice. Relative SNR was determined by computer-assisted analysis of MR images (lower panel). For each mouse, 3 images were analyzed and mean of SNR was determined. The average SNR of preadministration mice was 16.96 ± 0.41.
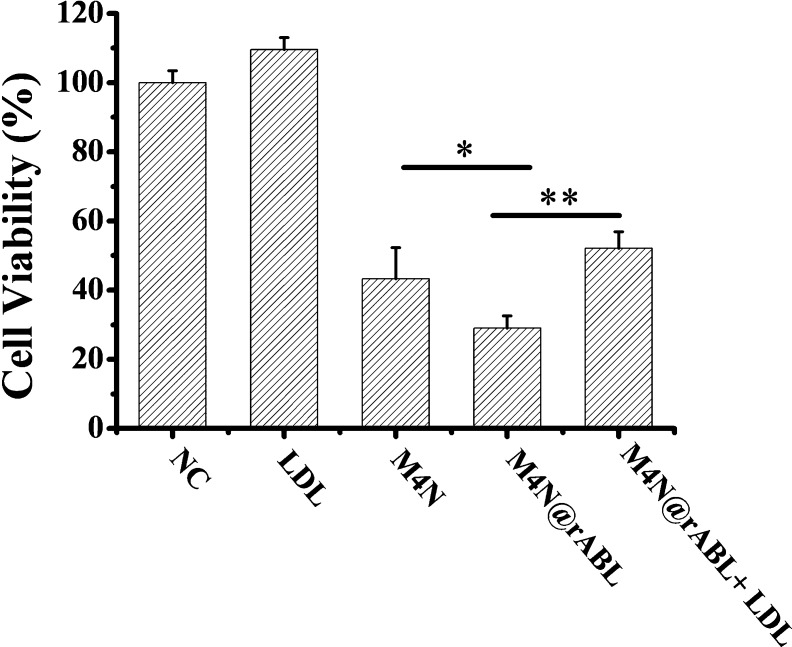
One additional application of rABL was also examined using M4N@rABL (Figure 7). According to the cell viability assay, and consistent with previous studies,42,43 M4N was observed to reduce cancer cell viability. Moreover, cell viability, upon M4N@rABL treatment, is lower than that with M4N treatment only. This finding indicates that the drug delivery efficiency of M4N@rABL is better than that of M4N alone. However, cell viability can be rescued by adding purified LDL (Figure 7). These results indicated that the M4N@rABL could be recognized and bound by the LDLR of the human lung cancer cell line A549. These results indicate the rABL is an excellent lipophilic anticancer drug carrier, and that it maintains its biological function. Therefore, the problem of cell uptake of DDS can be solved by using rABL.
Figure 7.
Cell viability and competition test of LDL- and M4N@rABL-treated A549 cancer cells. NC denoted the negative control represented by treatment with only PBS. *P < 0.05; **P < 0.01.
Conclusions
In summary, we have created a biocompatible and long-lasting LDL-like lipoparticle, rABL. rABL can be monitored directly with fluorescence microscopy. SPIONPs, hydrophobic molecules and high electron density particles, can be incorporated into rABL, and the resulting SPIO@rABL can be observed by SP-HRTEM and MRI. Moreover, M4N@rABL also shows that rABL possesses excellent lipophilic anticancer drug carrier and transporting abilities. Accordingly, we expect that this biocompatible, functional rABL can be used as a hydrophobic and amphiphilic nanomaterial delivery vehicle.
Acknowledgments
We thank Dr. P.C. Huang of Johns Hopkins University and Dr. Fenfei Leng of Florida International University for the critical reading of, and valuable comments on, this manuscript. This project was supported by grants from the National Science Council, Taiwan (NSC 100-2112-M-009-004-MY3 to CCC), and by grants from the Canadian Institutes of Health Research and Heart and Stroke Foundation on Canada (to Z.Y.)
Author Contributions
† Authors H.-L.C. and T.-M.C contributed equally.
The authors declare no competing financial interest.
References
- Morishita M.; Peppas N. A. Drug Discovery Today 2006, 11, 905–910. [DOI] [PubMed] [Google Scholar]
- Shen H.; Liu M.; He H.; Zhang L.; Huang J.; Chong Y.; Dai J.; Zhang Z. ACS Appl. Mater. Interfaces 2012, 4, 6317–6323. [DOI] [PubMed] [Google Scholar]
- Lynge M. E.; Baekgaard Laursen M.; Hosta-Rigau L.; Jensen B. E. B.; Ogaki R.; Smith A. A. A.; Zelikin A. N.; Städler B. ACS Appl. Mater. Interfaces 2013, 5, 2967–2975. [DOI] [PubMed] [Google Scholar]
- Chung N. S.; Wasan K. M. Adv. Drug Delivery Rev. 2004, 56, 1315–1334. [DOI] [PubMed] [Google Scholar]
- Oram J. F.; Heinecke J. W. Physiol. Rev. 2005, 85, 1343–1372. [DOI] [PubMed] [Google Scholar]
- Zheng G.; Chen J.; Li H.; Glickson J. D. Proc. Natl. Acad. Sci. U.S.A. 2005, 102, 17757–17762. [DOI] [PMC free article] [PubMed] [Google Scholar]
- Segrest J. P.; Jones M. K.; De Loof H.; Dashti N. J. Lipid Res. 2001, 42, 1346–1367. [PubMed] [Google Scholar]
- Goldstein J. L.; Brown M. S.; Anderson R. G. W.; Russell D. W.; Schneider W. J. Annu. Rev. Cell Biol. 1985, 1, 1–39. [DOI] [PubMed] [Google Scholar]
- Chen Y.; Hughes-Fulford M. Int. J. Cancer 2001, 91, 41–45. [DOI] [PubMed] [Google Scholar]
- Maletínská L.; Blakely E. A.; Bjornstad K. A.; Deen D. F.; Knoff L. J.; Forte T. M. Cancer Res. 2000, 60, 2300–2303. [PubMed] [Google Scholar]
- Pitas R. E.; Boyles J. K.; Lee S. H.; Hui D.; Weisgraber K. H. J. Biol. Chem. 1987, 262, 14352–60. [PubMed] [Google Scholar]
- Knott T. J.; Rall S. C. J.; Innerarity T. L.; Jacobson S. F.; Urdea M. S.; Levy-Wilson B.; Powell L. M.; Pease R. J.; Eddy R.; Nakai H.; Byers M.; Priestley L. M.; Robertson E.; Rall L. B.; Betsholtz C. S.; Thomas B.; Mahley R. W.; Scott J. Science 1985, 230, 37–43. [DOI] [PubMed] [Google Scholar]
- Imaizumi K.; Fainaru M.; Havel R. J. J. Lipid Res. 1978, 19, 712–22. [PubMed] [Google Scholar]
- Nikanjam M.; Blakely E. A.; Bjornstad K. A.; Shu X.; Budinger T. F.; Forte T. M. Int. J. Pharm. (Amsterdam, Neth.) 2007, 328, 86–94. [DOI] [PubMed] [Google Scholar]
- Huntosova V.; Buzova D.; Petrovajova D.; Kasak P.; Nadova Z.; Jancura D.; Sureau F.; Miskovsky P. Int. J. Pharm. (Amsterdam, Neth.) 2012, 436, 463–471. [DOI] [PubMed] [Google Scholar]
- Jiang W.; Baker M. L.; Jakana J.; Weigele P. R.; King J.; Chiu W. Nature 2008, 451, 1130–1134. [DOI] [PubMed] [Google Scholar]
- Ring E. A.; Jongea N. d. Microsc. Microanal. 2010, 16, 622–629. [DOI] [PubMed] [Google Scholar]
- Huang T.-W.; Liu S.-Y.; Chuang Y.-J.; Hsieh H.-Y.; Tsai C.-Y.; Huang Y.-T.; Mirsaidov U.; Matsudaira P.; Tseng F.-G.; Chang C.-S.; Chen F.-R. Lab Chip 2012, 12, 340–347. [DOI] [PubMed] [Google Scholar]
- Chang C. C.; Lin C. S.; Chen M. C.; Liu Y. C.; Huang Y. F.; Lin P. Y.; Chen Y. F.; Chang C. S.; Kan L. S. Biophys. Rev. Lett. 2006, 1, 45–56. [Google Scholar]
- Chang C.-C.; Lin P.-Y.; Yeh X.-C.; Deng K.-H.; Ho Y.-P.; Kan L.-S. Biochem. Biophys. Res. Commun. 2005, 328, 845–850. [DOI] [PubMed] [Google Scholar]
- Chang C.-C.; Yeh X.-C.; Lee H.-T.; Lin P.-Y.; Kan L.-S. Phys. Rev. E: Stat., Nonlinear, Soft Matter Phys. 2004, 70, 011904. [DOI] [PubMed] [Google Scholar]
- Liu Y.-L.; Lee H.-T.; Chang C.-C.; Kan L.-S. Biochem. Biophys. Res. Commun. 2003, 306, 59–63. [DOI] [PubMed] [Google Scholar]
- Chang C.-C.; Cheng M.-S.; Su Y.-C.; Kan L.-S. J. Biomol. Struct. Dyn. 2003, 21, 247–255. [DOI] [PubMed] [Google Scholar]
- Chang C.-C.; Su Y.-C.; Cheng M.-S.; Kan L.-S. Phys. Rev. E: Stat., Nonlinear, Soft Matter Phys. 2002, 66, 021903. [DOI] [PubMed] [Google Scholar]
- Yang C.-Y.; Hsiao J.-K.; Tai M.-F.; Chen S.-T.; Cheng H.-Y.; Wang J.-L.; Liu H.-M. Mol. Imaging Biol. 2011, 13, 443–451. [DOI] [PubMed] [Google Scholar]
- Hwu J. R.; Tseng W. N.; Gnabre J.; Giza P.; Huang R. C. C. J. Med. Chem. 1998, 41, 2994–3000. [DOI] [PubMed] [Google Scholar]
- Sniderman A. D.; Zhang Z.; Genest J.; Cianflone K. J. Lipid Res. 2003, 44, 527–532. [DOI] [PubMed] [Google Scholar]
- Teerlink T.; Scheffer P. G.; Bakker S. J. L.; Heine R. J. J. Lipid Res. 2004, 45, 954–966. [DOI] [PubMed] [Google Scholar]
- Dasary S. S. R.; Senapati D.; Singh A. K.; Anjaneyulu Y.; Yu H.; Ray P. C. ACS Appl. Mater. Interfaces 2010, 2, 3455–3460. [DOI] [PMC free article] [PubMed] [Google Scholar]
- Nicoli D. F.; Hasapidis K.; O’Hagan P.; McKenzie D. C.; Wu J. S.; Chang Y. J.; Schade B. E. H. In Particle Size Distribution III; Provder T., Ed.; American Chemical Society: Washington, D.C., 1998; Vol. 693, pp 52–76. [Google Scholar]
- Strober W. In Current Protocols in Immunology, Coligan J. E., Bierer B., Margulies D. H., Shevach E. M., Strober W., Coico R., Brown P., Donovan J. C., Kruisbeek A., Eds.; John Wiley & Sons: New York, 2001; Vol. 21, pp A.3B.1–A.3B.2. [Google Scholar]
- Guo D.; Reinitz F.; Youssef M.; Hong C.; Nathanson D.; Akhavan D.; Kuga D.; Amzajerdi A. N.; Soto H.; Zhu S.; Babic I.; Tanaka K.; Dang J.; Iwanami A.; Gini B.; DeJesus J.; Lisiero D. D.; Huang T. T.; Prins R. M.; Wen P. Y.; Robins H. I.; Prados M. D.; DeAngelis L. M.; Mellinghoff I. K.; Mehta M. P.; James C. D.; Chakravarti A.; Cloughesy T. F.; Tontonoz P.; Mischel P. S. Cancer Discovery 2011, 1, 442–456. [DOI] [PMC free article] [PubMed] [Google Scholar]
- Sze A.; Erickson D.; Ren L.; Li D. J. Colloid Interface Sci. 2003, 261, 402–410. [DOI] [PubMed] [Google Scholar]
- Kim K. W.; McCormick J.; Helmering J.; Véniant M. M.; Wang M. Anal. Biochem. 2008, 376, 268–274. [DOI] [PubMed] [Google Scholar]
- Gueddari N.; Favre G.; Hachem H.; Marek E.; Le Gaillard F.; Soula G. Biochimie 1993, 75, 811–819. [DOI] [PubMed] [Google Scholar]
- Ye Q.; Chen Y.; Lei H.; Liu Q.; Moorhead J.; Varghese Z.; Ruan X. Inflammation Res. 2009, 58, 809–818. [DOI] [PubMed] [Google Scholar]
- Bottalico L. A.; Wager R. E.; Agellon L. B.; Assoian R. K.; Tabas I. J. Biol. Chem. 1991, 266, 22866–22871. [PubMed] [Google Scholar]
- Manna S. K.; Gangadharan C.; Edupalli D.; Raviprakash N.; Navneetha T.; Mahali S.; Thoh M. J. Biol. Chem. 2011, 286, 7339–7347. [DOI] [PMC free article] [PubMed] [Google Scholar] [Retracted]
- Clendening J. W.; Pandyra A.; Boutros P. C.; Ghamrasni S. E.; Khosravi F.; Trentin G. A.; Martirosyan A.; Hakem A.; Hakem R.; Jurisica I.; Penn L. Z. Proc. Natl. Acad. Sci. U.S.A. 2010, 107, 15051–15056. [DOI] [PMC free article] [PubMed] [Google Scholar]
- Goldstein J. L.; Brown M. S. Arterioscler., Thromb., Vasc. Biol. 2009, 29, 431–438. [DOI] [PMC free article] [PubMed] [Google Scholar]
- Ren G.; Rudenko G.; Ludtke S. J.; Deisenhofer J.; Chiu W.; Pownall H. J. Proc. Natl. Acad. Sci. U.S.A. 2010, 107, 1059–1064. [DOI] [PMC free article] [PubMed] [Google Scholar]
- Chang C.-C.; Liang Y.-C.; Klutz A.; Hsu C.-I.; Lin C.-F.; Mold D.; Chou T.-C.; Lee Y.; Huang R. Cancer Chemother. Pharmacol. 2006, 58, 640–653. [DOI] [PubMed] [Google Scholar]
- Chang C.-C.; Heller J. D.; Kuo J.; Huang R. C. C. Proc. Natl. Acad. Sci. U.S.A. 2004, 101, 13239–13244. [DOI] [PMC free article] [PubMed] [Google Scholar]
- Rippel M. M.; Lee L.-T.; Leite C. A. P.; Galembeck F. J. Colloid Interface Sci. 2003, 268, 330–340. [DOI] [PubMed] [Google Scholar]
- Yao T.; Cui T.; Wu J.; Chen Q.; Yin X.; Cui F.; Sun K. Carbon 2012, 50, 2287–2295. [Google Scholar]
- Zhang J.; Mi C.; Wu H.; Huang H.; Mao C.; Xu S. Anal. Biochem. 2011, 421, 673–679. [DOI] [PMC free article] [PubMed] [Google Scholar]
- Feng B.; Hong R. Y.; Wang L. S.; Guo L.; Li H. Z.; Ding J.; Zheng Y.; Wei D. G. Colloids Surf., A 2008, 328, 52–59. [Google Scholar]
- Severcan F.; Toyran N.; Kaptan N.; Turan B. Talanta 2000, 53, 55–59. [DOI] [PubMed] [Google Scholar]
- García-Flores A. F.; Raniero L.; Canevari R. A.; Jalkanen K. J.; Bitar R. A.; Martinho H. S.; Martin A. A. Theor. Chem. Acc. 2011, 130, 1231–1238. [Google Scholar]
- Wu M. L.; Nie M. Q.; Wang X. C.; Su J. M.; Cao W. Spectrochim. Acta, Part A 2010, 75, 1047–1050. [DOI] [PubMed] [Google Scholar]


