

Abstract
The present study deals with the development of transferosomal gel containing insulin by reverse phase evaporation method for painless insulin delivery for use in the treatment of insulin dependent diabetes mellitus. The effect of independent process variables like ratio of lipids (soya lecithin:cholesterol), ratio of lipids and surfactants, and ratio of surfactants (Tween 80:sodium deoxycholate) on the in vitro permeation flux (μg/cm2/h) of formulated transferosomal gels containing insulin through porcine ear skin was optimized using 23 factorial design. The optimal permeation flux was achieved as 13.50 ± 0.22 μg/cm2/h with drug entrapment efficiency of 56.55 ± 0.37% and average vesicle diameter range, 625–815 nm. The in vitro insulin permeation through porcine ear skin from these transferosomal gel followed zero-order kinetics (R2 = 0.9232–0.9989) over a period of 24 h with case-II transport mechanism. The in vitro skin permeation of insulin from optimized transferosomal gel by iontophoretic influence (with 0.5 mA/cm2 current supply) also provided further enhancement of permeation flux to 17.60 ± 0.03 μg/cm2/h. The in vivo study of optimized transferosomal gel in alloxan-induced diabetic rat has demonstrated prolonged hypoglycemic effect in diabetic rats over 24 h after transdermal administration.
Keywords: Transferosome, Gel, Transdermal, Iontophoresis, Permeation flux, Insulin, Hypoglycemic effect
1. Introduction
Delivery of therapeutically active proteins and peptides has found an important position in therapeutics. Currently, most of the commercially available therapeutic proteins and peptides are administered parenterally, because oral administration of these candidates is limited due to their rapid hydrolytic and enzymatic degradations (Marschutz and Bernkop-Schnurch, 2000; Nayak, 2010). Among various therapeutically active proteins and peptides, insulin is widely used clinically for the treatment of insulin dependent diabetes mellitus (IDDM) or type-I diabetes (Tripathi, 1999). Insulin is a peptide hormone composed of 51 amino acid residues and has molecular weight about 5.7 kDa (Davis, 2005). The molecular structure of insulin composed of 2 peptide chains: A chain (21 amino acid residues) and B chain (30 amino acid residues) (Malakar et al., 2011). Although parenteral insulin is commercially available and generally used, but this is associated with some serious adverse effects like peripheral hyperinsulinemia, smooth muscles cell proliferation and a diabetic micro- and macro-angiopathy (Khafagy et al., 2007). In addition, the burden of daily injections, physiological stress, pain, inconvenience, cost, and the localized deposition of insulin leads to a local hypertrophy and fat deposition in the injection sites. To limit these drawbacks, transdermal route for insulin delivery as an alternative non-parenteral route of administration can be used to treat diabetic patients. During the past few years, various experimental methodologies have been successfully developed for facilitating transdermal delivery of insulin (Sen et al., 2002; Pillai et al., 2003; Amnon and Wormser, 2007; Cevc, 2003; King et al., 2002).
Recently, the vesicular drug-carrier system, transferosome have been reported to enhance the transdermal delivery of drugs, when applied onto the skin non-occlusively (Benson, 2006; Patel et al., 2009). Transferosomes are artificial vesicles, being several orders of magnitude more deformable than standard liposomes (Cevc and Blume, 2003; Jain et al., 2003). The deformability of liposomes for improved skin permeation of drug molecules can be achieved by using surfactants in appropriate ratio (Maghraby et al., 1999). Transferosomes have the ability to overcome the permeation difficulty by squeezing themselves along the inter-cellular sealing lipid of the stratum corneum (Pandey et al., 2009). The resulting flexibility of transferosomes membranes minimizes the risk of complete vesicle rupture in the skin and allows transferosomes to follow the natural water gradient across the epidermis, after application onto the skin (Fig. 1).
Figure 1.
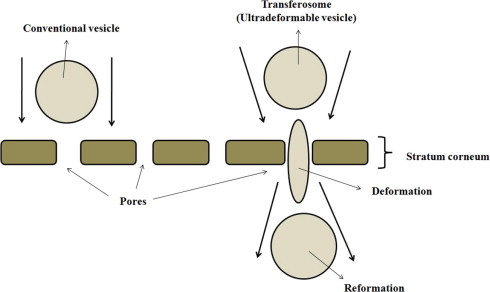
Schematic diagram describing interaction of the transferosome with skin tissue.
Pharmaceutical scientists often face the challenge of finding the appropriate combination of variables that will produce the product with optimum properties (Nayak and Pal, 2011). The optimization technique encompasses designing a set of experiment that will reliably measure the response variables, fitting a mathematical model to the data, conducting appropriate statistical test to assure that the best possible model is chosen, and determining the optimum value of independent variables that produce best response (Schwartz et al., 2007). In the present investigation, we attempted to develop and optimize transferosomal gel containing insulin for improved transdermal permeation using 23 factorial design. We also have studied the transdermal permeation of the optimized transferosomal gel by iontophoresis for further insulin permeation improvement. Finally, we have performed a short-term in vivo evaluation of optimized transferosomal gel containing insulin on alloxan-induced diabetic rats.
2. Experimental
2.1. Materials
Human insulin (Torrent Pharmaceutical Ltd., India), soya lecithin (l-α-phosphatidyl choline, Himedia Laboratories Pvt. Ltd., India), cholesterol (C24H46O; M.W. −386.67, purity ⩾99%, Merck Specialties Pvt. Ltd., India), sodium deoxycholate (C24H39O4Na; M.W.−414.56, Loba Chemie Pvt. Ltd., India), Tween 80 (Merck Specialties Pvt. Ltd., India), dimethyl sulfoxide (Merck Specialties Pvt. Ltd., India) and diethyl ether (Merck Specialties Pvt. Ltd., India) were used. Demineralized and double distilled water was used. All chemicals and reagents used were of analytical grade.
2.2. Preparation of transferosomes
Transferosomes were formulated by reverse phase evaporation method with some modifications as described in the literature (Yang et al., 2002). At first, soya lecithin and cholesterol were taken in a cleaned beaker as lipids. Then, Tween 80 as surfactant was poured in the same beaker and dissolved in a solvent mixture of diethyl ether and chloroform (3:1). The beaker was kept at the room temperature for 24 h until the thin film formed. Insulin solution (1.40 mg/ml in water) was poured onto the thin film and sonicated by a probe sonicator (FS-600. Frontline Electronics and Machinery Pvt. Ltd., India) at a frequency of 20 KhZ for 2 min. After that, the film was hydrated using edge deactivator, sodium deoxycholate in phosphate buffer saline (pH 7.4) and then further sonicated for 2 min to obtain transferosomal suspensions. In each suspensions, 2% v/v dimethyl sulfoxide (DMSO) was added as chemical permeation enhancer. Then various formulated transferosomal suspensions were passed through Whatman® filter paper (No. 40). Then, these transferosomal suspensions were transferred to 5% w/v methylcellulose gel and stored in cool and dark place.
2.3. Experimental design
A three-factor, two-level factorial design (23) were employed for optimization procedure with ratio of lipids (soya lecithin:cholesterol) (X1), ratio of lipids and surfactants (X2), and ratio of surfactants (Tween 80:sodium deoxycholate) (X3) as three prime selected independent variables, which were varied at two levels, low level (−1) and high level (+1). The values of two coded levels of three factors were assumed after preliminary trials and are shown in Table 1. The in vitro permeation flux (μg/cm2/h) of formulated transferosomal gels containing insulin through goat ear skin was measured as dependent variable. Design-Expert® DX 8 Software was used for the generation and evaluation of the statistical experimental design. The matrix of the design including response obtained as the permeation flux (μg/cm2/h) is shown in Table 2.
Table 1.
Composition of different coded values in 23 full factorial design.
| Coded values | Independent variables (actual values) |
|||
|---|---|---|---|---|
| Ratio of lipids (soya lecithin:cholesterol) (X1) | Ratio of lipids and surfactants (X2) | Ratio of surfactant (Tween 80:Na deoxycholate) (X3) | ||
| Levels | Low (−1) | 8:3 | 1:1 | 4:6 |
| High (+1) | 10:1 | 1.47:1 | 7:3 | |
Table 2.
23 full factorial design (coded values in bracket) with response; [(+1) = High level, (−1) = Low level].
| Formulation codes | Factors |
Response | ||
|---|---|---|---|---|
| Ratio of lipids (soyalecithin:cholesterol) (X1) | Ratio of lipids and surfactants (X2) | Ratio of surfactant (Tween 80:Na deoxycholate) (X3) | Flux, J (μg/cm2/h) (Mean ± SE, n = 3) | |
| F 1 | (+1) | (+1) | (+1) | 12.72 ± 0.21 |
| F 2 | (+1) | (+1) | (−1) | 9.72 ± 0.20 |
| F 3 | (+1) | (−1) | (+1) | 8.52 ± 0.12 |
| F 4 | (−1) | (+1) | (+1) | 14.38 ± 0.23 |
| F 5 | (+1) | (−1) | (−1) | 11.13 ± 0.20 |
| F 6 | (−1) | (+1) | (−1) | 13.39 ± 0.26 |
| F 7 | (−1) | (−1) | (+1) | 6.39 ± 0.11 |
| F 8 | (−1) | (−1) | (−1) | 11.50 ± 0.24 |
2.4. Determination of drug entrapment efficiency
Transferosomal suspensions (total mount) were ultracentrifuged at 20,000 rpm and 10 °C for 30 min. After centrifugation, 1 ml of supernatant was diluted with the addition of 9 ml phosphate saline buffer (pH 7.4) and then the absorbance was measured using UV–Vis spectrophotometer (Thermo Spectronic UV-1, USA) by measuring absorbance at 214 nm. The drug entrapment efficiency was calculated as below,
| (1) |
where, DEE is the drug entrapment efficiency, WT is the total amount of insulin in transferosomal suspensions: WF is the free amount of insulin that was found in the supernatants.
2.5. Preparation of skin for in vitro skin permeation study
All the permeation experiments were done using porcine ear skin, obtained from the slaughterhouse after sacrificing the animal within 1 h and prepared according to the literature (Malakar et al., 2011). Then the hair was removed from the upper portion of skin surface using an animal hair clipper and subsequently, full thickness of the skin was harvested. The fatty layer, adhering to the dermis side was removed by surgical scalpel. Finally, the skin was rinsed with deionized water and packed in an aluminum foil. The skin samples were stored at −20 °C and used within a week.
2.6. In vitro skin permeation study by Franz diffusion cell
In vitro skin permeation studies were carried out using Franz diffusion cell. The cell consists of two chambers, the donor and the receptor compartments with a diffusion area of 1.43 cm2. The donor compartment was open at the top and was exposed to atmosphere. The excised porcine ear skin was mounted between the compartments of the diffusion cell with stratum corneum facing the donor compartment and clamped into position. Magnetic stirrer bars were added to the receptor chambers and filled with the receptor phase. Phosphate buffer saline (PBS), pH 7.4 was used as receptor medium. The small concentration of sodium azide (0.0025% w/v) was added to prevent any microbial growth (Pillai and Panchagnula, 2004). The entire setup was placed over magnetic stirrer and the temperature was maintained at 37 ± 0.5 °C. The skin sections were initially left in the Franz cells for 2 h in order to facilitate hydration of the skin samples. After this period, 5 ml of the appropriate formulation was applied onto the surface of the skin. The transferosomal gels containing insulin of 2.24 mg were used for the in vitro skin permeation study. 0.5 ml of medium was collected from the receptor compartment at predetermined intervals over study period and replaced with the same amount of fresh buffer. The amount of permeated drug was measured using UV–Vis spectrophotometer (Thermo Spectronic UV-1, USA) by measuring absorbance at 214 nm.
2.7. Permeation data analysis
Amount of insulin from transferosomal gel was permeated through goat skin and was plotted against the function of time. The slope and intercept of the linear portion of plots were derived by regression. The flux (J, μg/cm2/h) was calculated as the slope is divided by the skin surface area (Nayak et al., 2010; Ratha Adhikari et al., 2010).
The data of in vitro insulin release from various transferosomal gels were evaluated kinetically using various mathematical models like zero-order, first-order, Higuchi and Koresmeyer–Peppas model equations.
where F represents the fraction of drug released in time t, and K0 is the zero-order release constant.
where F represents the fraction of drug released in time t, and K1 is the first-order release constant.
where F represents the fraction of drug released in time t, and KH is the Higuchi dissolution constant.
where F represents the fraction of drug released in time t, and Kp is the Koresmeyer–Peppas release rate constant and n is the diffusion exponent.
2.8. Vesicle size and zeta potential determination
One millilitre of transferosomal suspension was diluted by 10 ml of double distilled water and then vesicle size and zeta potential were determined by a laser scattering particle size analyzer (MALVERN ZETASIZER, MAL500999).
2.9. Iontophoresis experiment
Iontophoresis was performed using silver/silver chloride electrodes according to the literature (Pillai et al., 2003). Silver chloride electrodes were prepared as follows. Two silver wires (0.5 mm diameter) were connected to a 12 V battery source and immersed in 0.1 M hydrochloric acid. A gray silver chloride layer was gradually coated on one of the silver wires after 24 h. The silver wire representing the anode was immersed in the donor compartment; while, a silver chloride-coated cathode was inserted into the receptor compartment. Both electrodes were connected to a constant current circuit. A direct current of 0.5 mA/cm2 was applied throughout the study period. The iontophoresis by that system was cathodal. At predetermined time intervals, 1 ml of medium samples were withdrawn from the receptor and replaced with same amount of fresh buffer. The amount of permeated drug was measured using UV–VIS spectrophotometer (Thermo Spectronic UV-1, USA) by measuring absorbance at 214 nm.
2.10. In vivo study
In vivo studies were performed in alloxan-induced diabetic albino rats of either sex (weighing 240–362 g). The acclimatized rats were kept fasting for 24 h with water ad libitum. All experiments were performed between 8 am and 12 pm to minimize circadian influences. The experimental protocol was subjected to the scrutiny of the Institutional Animal Ethical Committee and was cleared before starting. The animals were handled as per the guidelines of committee for the purpose of control and supervision on experimental animals (CPCSEA), New Delhi.
Prior to any treatment, the blood glucose level of these rats was measured using a glucometer (ACCU CHECK) by the tail cut method. The rats were made diabetic by intraperitoneal administration of freshly prepared alloxan solution at a dose of 150 mg/kg dissolved in 2 mM citrate buffer (pH 3.0). After one week, alloxanized rats with fasting blood glucose of 300 mg/dl or more were considered diabetic and were employed in the study. All animals were kept in a normal diet and condition.
The optimized transferosomal gel containing 2.24 mg insulin was applied on the dorsal surface of each test animals by adhesive tape after the removal of hair using hair remover and the blood glucose level was measured after 24 h by the above stated method.
3. Results and discussion
The purpose of using a full 23 factorial experimental design was to conduct a comprehensive study of the effect of the process parameters like ratio of lipids (soya lecithin:cholesterol) (X1), ratio of lipids and surfactants (X2), ratio of surfactants (Tween 80:sodium deoxycholate) (X3) and their interactions using a suitable statistical tool (Design-Expert® DX 8 Software) by applying one-way ANOVA at 0.05 levels. A mathematical modeling was carried out by using Eq. (6) to obtain a first-order polynomial equation depending on significant influences among three factors (X1, X2 and X3) of the factorial design model.
where Y = the dependent variable, while b0 = the intercept, b1, b2, b3, b4, b5, b6 and b7 = regression coefficients; X1, X2 and X3 = main factors; X1X2, X2X3, and X1X3 = interactions between main factors.
The values of the insulin permeation flux (J, μg/cm2/h) data in 23 factorial design (Table 2) were fitted to a first-order polynomial model. From the ANOVA results (Table 3) of the model relating permeation flux (J, μg/cm2/h) as response, it can be noticed that all the coefficients of this model equation had statistic significance (p < 0.05) with the model F-value of 274.14 and R2 value of 0.9994. The model equation became:
Model simplification was carried out by eliminating non-significant terms (p > 0.05) in the polynomial equation resulting from the multiple regression analysis (Nayak et al., 2011), giving:
Table 3.
Summary of ANOVA for the response parameters.
| Source | Sum of square | d.f.a | Mean square | F value | p-value Prob > F |
|---|---|---|---|---|---|
| Model | 49.36 | 6 | 8.23 | 274.14 | 0.0462 |
| X1 | 1.59 | 1 | 1.59 | 53.08 | 0.0868 |
| X2 | 20.07 | 1 | 20.07 | 668.59 | 0.0246 |
| X3 | 1.74 | 1 | 1.74 | 57.95 | 0.0832 |
| X1X2 | 6.28 | 1 | 6.28 | 209.36 | 0.0439 |
| X1X3 | 2.57 | 1 | 2.57 | 84.72 | 0.0689 |
| X2X3 | 17.14 | 1 | 17.14 | 571.11 | 0.0266 |
X1, X2 and X3 = main factors; X1X2, X2X3, and X1X3 = interactions between main factors.
d.f. = Degree of freedom.
The influences of main effects (factors) on responses (here, permeation flux) were further elucidated by response surface methodology. Response surface methodology is a widely proficient approach in the development and optimization of drug delivery devices (Kim et al., 2007). The three-dimensional response surface graphs (Figs. 2a,3a,4a) and corresponding two-dimensional contour plots (Figs. 2b,3b,4b) were generated by the Design-Expert® DX 8 Software. The three-dimensional response surface graph is very useful in learning about the main and interaction effects of the independent variables (factors), whereas two-dimensional contour plot gives a visual representation of values of the response (Joshi et al., 2010). The three-dimensional response surface graphs relating permeation flux (J, μg/cm2/h) as response (Figs. 1a–3a) depicted the increase in permeation flux with the increasing of ratio of lipids and surfactants (X2), mainly. The two-dimensional contour plots relating to permeation flux (J, μg/cm2/h) indicated nonlinear relationships between the ratio of lipids and surfactants (X2) and other individual factors investigated in this study (ratio of lipids, X1 and ratio of surfactants, X3) (Figs. 2b,4b). However, almost linear relationship between and ratio of lipids, (X1) and ratio of surfactants was presented by the other two-dimensional contour plot (Fig. 3b) given by the software.
Figure 2.

Effect of ratio of lipids (soya lecithin: cholesterol) and ratio of lipids and surfactants on insulin permeation flux (μg/cm2/h) presented by response surface plot (a), and contour plot (b).
Figure 3.

Effect of ratio of lipids (soya lecithin: cholesterol) and ratio of surfactants (Tween 80: sodium deoxycholate) on insulin permeation flux (μg/cm2/h) presented by response surface plot (a), and contour plot (b).
Figure 4.

Effect of ratio of lipids and surfactants, ratio of surfactants (Tween 80: sodium deoxycholate) on insulin permeation flux (μg/cm2/h) presented by response surface plot (a), and contour plot (b).
A numerical optimization technique using the desirable approach was employed to develop the new formulation of desired response (desired quality). The desirable ranges of the independent variables (factors) were restricted to X1 = 6.34, X2 = 1, and X3 = 1.50. The optimal value of response was obtained by numerical analysis using the Design-Expert® DX 8 Software. In order to evaluate the optimization capability of model generated according to the results of the full 23 factorial design, optimized transferosomal gel containing insulin was prepared using the optimal process variable settings (Table 4) and the optimized gel was evaluated to determine the permeation flux (J, μg/cm2/h) through porcine ear skin. The in vitro permeation flux for the optimized gel was measured 13.50 ± 0.22 μg/cm2/h through porcine ear skin with small error-value (6.80%). This reveals that mathematical models obtained from the full 23 factorial design were well fitted. Cevc et al. reported that the transdermal permeation of drug was usually 10 times greater than conventional vesicles, when the deformable vesicles were applied topically (Cevc et al., 1998). This is due to the influence of hydration force caused by the difference in water concentration by deformable vesicles containing the sodium deoxycholate. Furthermore, it has been also reported that the membrane ripples were found after the addition of deoxycholate to phospholipids vesicles. These ripples further more serve as intermembrane attachment site for membrane fusion (Schubert et al., 2000). All these transferosomal suspensions showed drug entrapment efficiency of 56.55 ± 0.37 (F 9) to 60.23 ± 0.44% (F 4) (Table 5). The average vesicle diameter range of optimized transferosomal suspension was 625–815 nm (Fig. 5), whereas, zeta potential of that transferosomal suspension was – 14.30 mV. The skin has also slight negative charge. Therefore, the negative zeta potential of the optimized transferosomal gel containing insulin might cause little influence in improved drug permeation through porcine skin due to electrostatic repulsion between the same charge of the skin surface and the optimized gel.
Table 4.
Values of factors for the formulation of optimized transferosomal gel containing insulin (F 9).
| Formulation codes | Ratio of lipids (soyalecithin:cholesterol) (X1) | Ratio of lipids and surfactants (X2) | Ratio of surfactant (Tween 80:Na deoxycholate) (X3) | Flux, J (μg/cm2/h) |
|
|---|---|---|---|---|---|
| Observed (Mean ± SE, n = 3) | Predicted | ||||
| F 9 | 5:3 | 1:1 | 1:3 | 13.50 ± 0.22 | 12.64 |
| % Errora | |||||
| 6.80 | |||||
% Error = [Difference between predicted value and observed value/Predicted value] × 100.
Table 5.
Drug entrapment efficiencies of various transferosomal gels containing insulin.
| Formulation codes | Drug entrapment efficiency (%) (Mean ± SE, n = 3) |
|---|---|
| F 1 | 59.77 ± 0.56 |
| F 2 | 60.72 ± 0.48 |
| F 3 | 62.05 ± 0.56 |
| F 4 | 60.23 ± 0.44 |
| F 5 | 62.08 ± 0.57 |
| F 6 | 57.27 ± 0.31 |
| F 7 | 60.95 ± 0.44 |
| F 8 | 58.68 ± 0.48 |
| F 9 | 56.55 ± 0.37 |
Figure 5.

The vesicle size distribution curve of optimized transferosomal suspension (F 9) (before incorporation into gel).
We also studied the in vitro skin permeation of optimized transferosomal gel containing insulin by iontophoresis with 0.5 mA/cm2 current supply for the further improvement of insulin permeation and we found that in vitro permeation flux measured 17.60 ± 0.03 μg/cm2/h through porcine ear skin, which was higher than that of optimized gels without iontophoresis. It is reported that 0.5 mA/cm2 of current supply has produced maximum drug permeation through the layers of the skin (Pillai and Panchagnula, 2004). Therefore, in this iontophoresis experiment, we have used 0.5 mA/cm2 of current supply. Iontophoresis is one of the important electrically based transdermal drug permeation enhancement technique (Molokhia et al., 2008; Semalthy et al., 2007). Iontophoresis may be defined as the facilitation of ionizable drug permeation across the skin by an applied electrical potential, the driving force of which may be simply occurred as electrostatic repulsion (Kumar and Philip, 2007). This technique utilizes the application of small electric current to a drug reservoir on the skin, with the similarly charged electrodes (on the surface of the skin) placed together in the drug reservoir producing a repulsion effect that effetely drives the drug molecules away from the electrode and into the skin (Kumar and Philip, 2007).
Amount of insulin permeated through porcine skin over 24 h period was plotted against the function of time (Fig. 6) and this result showed that the high permeation profile of optimized transferosomal gel containing insulin (F 9) over 24 h. A comparative in vitro permeation profile of optimized transferosomal gel containing insulin (F 9) in normal condition and iontophortic condition with the influence of current supply, 0.5 mA/ cm2 was presented in Fig. 7. The in vitro permeation profile of optimized transferosomal gel containing insulin by iontophoresis showed higher permeation profile than of in normal condition, which was coincided well with permeation flux data.
Figure 6.

Cumulative amount of in vitro insulin permeated through porcine skin per unit area vs. time profile of various transferosomal gels (F 1–F 9). (Mean ± SE, n = 3).
Figure 7.

Cumulative amount of in vitro insulin permeated through porcine skin per unit area vs. time profile of optimized transferosomal gel (F 9) in normal condition and inontophoretic condition with the influence of current supply, 0.5 mA/cm2. (Mean ± SE, n = 3).
In order to predict and correlate the in vitro insulin permeation behavior from these transferosomal gels through porcine skin, it is necessary to fit into a suitable mathematical model. The in vitro drug permeation data from various transferosomal gels containing insulin through porcine skin were evaluated kinetically by various mathematical models like zero-order, first-order, Higuchi, and Korsmeyer-Peppas Model. The results of the curve fitting into these above mentioned mathematical models indicate the in vitro insulin permeation behavior of transferosomal gels (F 1–F 9) (Table 6). When respective correlation coefficients were compared, it was followed the zero-order kinetics (R2 = 0.9232–0.9989) over a period of 24 h. This indicates that the in vitro insulin permeation behavior from these transferosomal gels through porcine skin was in controlled release manner throughout the in vitro insulin permeation study.
Table 6.
Results of curve fitting of the in vitro skin permeation data of various transferosomal gels (F 1–F 9)
| R2 values | |||||
|---|---|---|---|---|---|
| Formulation codes | Zero order | First order | Higuchi Model | Korsmeyer-Peppas | Diffusional exponent (n) |
| F 1 | 0.9232 | 0.6056 | 0.9340 | 0.9242 | 1.1855 |
| F 2 | 0.9941 | 0.7915 | 0.8524 | 0.9973 | 0.9937 |
| F 3 | 0.9941 | 0.8225 | 0.6798 | 0.9895 | 0.9827 |
| F 4 | 0.9974 | 0.7614 | 0.7863 | 0.9901 | 0.9353 |
| F 5 | 0.9982 | 0.7094 | 0.7224 | 0.9866 | 1.1723 |
| F 6 | 0.9958 | 0.7606 | 0.7984 | 0.9978 | 0.9211 |
| F 7 | 0.9969 | 0.8625 | 0.7928 | 0.9759 | 1.0992 |
| F 8 | 0.9952 | 0.7574 | 0.7998 | 0.9926 | 0.9999 |
| F 9 | 0.9971 | 0.7966 | 0.6812 | 0.9850 | 1.1496 |
The Korsmeyer-Peppas model was employed in the in vitro insulin permeation behavior analysis of these formulations to distinguish between two competing release mechanisms: a Fickian (non-steady) diffusional release when n ⩽ 0.5 and a case-II transport (zero-order) when n ⩾ 1. When the value of n is between 0.5 and 1, this is indicative of non-Fickian, ‘anomalous’ release (Roberts et al., 1997). The determined values of diffusion exponent (n) ranged between 0.9211 and 1.1855 (Table 6), indicating the drug release from these transferosomal gels followed the case-II transport mechanism.
In vivo efficiencies of the optimized transferosomal gel containing insulin were performed in Albino rats and estimated by measuring the blood glucose level. The blood glucose level of rats before the study, in alloxan-induced diabetic Albino rats after 1 week of alloxanization, and after 24 h of transdermal application of optimized transferosomal gel containing 2.24 mg of insulin were measured as negative control, positive control and test, respectively (Fig. 8). The in vivo result showed that the measured blood glucose level for test was higher than that of negative control; whereas test and negative control were lower than that of positive control (before application of test gel in alloxan-induced diabetic rats). These results suggested that the tested transferosomal gel containing insulin could be able to reduce the increased blood glucose level through the transdermal route.
Figure 8.

In vivo blood glucose level (mg/dl) in alloxan-induced diabetic rats. (Mean ± SE, n = 6) Negative control: Before alloxanization; Positive control: After 3 days of alloxanization; Test: After 24 h of transdermal administration of optimized transferosomal gel containing insulin in alloxan induced diabetic rats.
4. Conclusion
For large peptide like insulin, it is very difficult to improve the transport efficiency by increasing the concentrations of the peptide due to the limitation in terms of cost and physical stability. The major problems of conventional insulin therapies possess several drawbacks like lower stability to different pH and enzymatic system. However, the tranferosomal (highly deformable vesicles) drug delivery system may be a better alternative for the conventional insulin therapy. The optimized transferosomal gel containing insulin was obtained based on 23 factorial design, which showed the good permeation result with in vitro permeation flux of 13.50 ± 0.22 μg/cm2/h through porcine ear skin. The iontophoretic influence on in vitro skin permeation of optimized transferosomal gel also provided further improvement of skin permeation flux of 17.60 ± 0.03 μg/cm2/h. The in vivo study of optimized transferosomal gel has demonstrated prolonged hypoglycemic effect in alloxan-induced diabetic rats over 24 h after transdermal administration. The developed and optimized transferosomal gel containing insulin can be transdermally administered in the treatment of insulin dependent diabetes mellitus with maintaining lower blood glucose level and improved patient compliance.
Declarations of interest
The authors report no declarations of interest.
References
- Amnon C.S., Wormser U. Topical iodine facilitates transdermal delivery of insulin. J. Control. Release. 2007;118(2):185–188. doi: 10.1016/j.jconrel.2006.12.006. [DOI] [PubMed] [Google Scholar]
- Benson H.A.E. Transfersomes for transdermal drug delivery. Exp. Opin. Drug Deliv. 2006;3(6):727–737. doi: 10.1517/17425247.3.6.727. [DOI] [PubMed] [Google Scholar]
- Cevc G., Blume G. Biological activity and characteristics of triamcinolone-acetonide formulated with the self-regulating drug carriers, Transferosomes®. Biochim. Biophys. Acta. 2003;1614:156–164. doi: 10.1016/s0005-2736(03)00172-x. [DOI] [PubMed] [Google Scholar]
- Cevc G., Gebauer D., Stieber J., Schatzlein A., Blume G. Ultraflexible vesicles, Transferosomes, have an extremelly pore penetration resistance and transport therapeutic amounts of insulin across the intact mammalian skin. Biochim. Biophys. Acta. 1998;1368:201–215. doi: 10.1016/s0005-2736(97)00177-6. [DOI] [PubMed] [Google Scholar]
- Cevc G. Transdermal drug delivery of insulin with ultradeformable carriers. Clin. Pharmacokinet. 2003;42:461–474. doi: 10.2165/00003088-200342050-00004. [DOI] [PubMed] [Google Scholar]
- Davis S.N. Insulin, oral hypoglycemic agents, and the pharmacology of endocrine pancreas. In: Brunton L.L., Lazo J.S., Parker K.L., editors. Goodman and Gilman’s The Pharmacological Basis of Therapeutics. 11thedition. McGraw-Hill; New York: 2005. 1613-1616. [Google Scholar]
- Jain S., Umamaheshwari R.B., Bhadra D., Tripathi P., Jain P., Jain N.K. Ultra deformable liposome: a recent tool for effective transdermal drug delivery. Indian J. Pharm. Sci. 2003;65:223–231. [Google Scholar]
- Joshi S.A., Chavan S.S., Sawant K.K. Rivastigmine-loaded PLGA and PBCA nanoparticles: Preparation, optimization, characterization, in vitro and pharmacodynamic studies. Eur. J. Pharm. Biopharm. 2010;76:189–199. doi: 10.1016/j.ejpb.2010.07.007. [DOI] [PubMed] [Google Scholar]
- Khafagy E.S., Morishita M., Onuki Y., Takayama K. Current challenges in non-invasive insulin delivery systems: a comparative review. Adv. Drug Deliv. Rev. 2007;59:1521–1546. doi: 10.1016/j.addr.2007.08.019. [DOI] [PubMed] [Google Scholar]
- Kim M.-S., Kim J.-S., You Y.-H., Park H.-J., Lee S., Park J.-S., Woo J.-S., Hwang S.-J. Development and optimization of a novel oral controlled delivery system for tamusulosin hydrochloride using response surface methodology. Int. J. Pharm. 2007;341:97–104. doi: 10.1016/j.ijpharm.2007.03.051. [DOI] [PubMed] [Google Scholar]
- King M.J., Badea I., Solomon J., Kumar P., Gaspar K.J., Foldvari M. Transdermal delivery of insulin from a novel biphasic lipid system in diabetic rats. Diabetes Technol. Ther. 2002;4:479–488. doi: 10.1089/152091502760306562. [DOI] [PubMed] [Google Scholar]
- Kumar R., Philip A. Modified transdermal technologies: Breaking the barriers of drug permeation via the skin. Trop. J. Pharm. Sci. 2007;6:633–644. [Google Scholar]
- Maghraby G.M.M., Williams A.C., Barry B.W. Skin delivery of oestradiol from deformable and traditional liposomes: mechanistic study. J. Pharm. Pharmacol. 1999;51:1123–1124. doi: 10.1211/0022357991776813. [DOI] [PubMed] [Google Scholar]
- Malakar J., Sen S.O., Nayak A.K., Sen K.K. Development and evaluation of microemulsion for transdermal delivery of insulin. ISRN Pharmaceutics. 2011 doi: 10.5402/2011/780150. Article ID 780150. [DOI] [PMC free article] [PubMed] [Google Scholar]
- Marschutz M.K., Bernkop-Schnurch A. Oral peptide drug delivery: polymer-inhibitor conjugates protecting insulin from enzymatic degradation in-vitro. Biomaterials. 2000;21:1499–1507. doi: 10.1016/s0142-9612(00)00039-9. [DOI] [PubMed] [Google Scholar]
- Molokhia S.A., Zhang Y., Higuchi W.I., Li S.K. Iontophoretic transport across a multiple membrane system. J. Pharm. Sci. 2008;97:490–505. doi: 10.1002/jps.21231. [DOI] [PMC free article] [PubMed] [Google Scholar]
- Nayak A.K. Advances in therapeutic protein production and delivery. Int. J. Pharm. Pharmaceut. Sci. 2010;2:1–5. [Google Scholar]
- Nayak A.K., Laha B., Sen K.K. Development of hydroxyapatite-ciprofloxacin bone-implants using “Quality by design“. Acta Pharm. 2011;61:25–36. doi: 10.2478/v10007-011-0002-x. [DOI] [PubMed] [Google Scholar]
- Nayak A.K., Mohanty B., Sen K.K. Comparative evaluation of in vitro diclofenac sodium permeability across excised mouse skin from different common pharmaceutical vehicles. Int. J. PharmTech Res. 2010;2:920–930. [Google Scholar]
- Nayak A.K., Pal D. Development of pH-sensitive tamarind seed polysaccharide–alginate composite beads for controlled diclofenac sodium delivery using response surface methodology. Int. J. Biol. Macromol. 2011;49:784–793. doi: 10.1016/j.ijbiomac.2011.07.013. [DOI] [PubMed] [Google Scholar]
- Pandey S., Manish G., Viral D., Jarina F. Transferosomes: A novel approach for transdermal drug delivery. Der Pharm. Lett. 2009;1:143–150. [Google Scholar]
- Patel R., Singh S.K., Singh S., Sheth N.R., Gendle R. Development and characterization of curcumin loaded transferosome for transdermal delivery. J. Pharm. Sci. Res. 2009;1:71–81. [Google Scholar]
- Pillai O., Borkute S.D., Sivaprashad N., Panchagnula R. Transdermal iontophoresis of insulin: II. Physicochemical consideration. Int. J. Pharm. 2003;254:271–280. doi: 10.1016/s0378-5173(03)00034-6. [DOI] [PubMed] [Google Scholar]
- Pillai O., Panchagnula R. Transdermal iontophoresis of insulin. VI. Influence of chemical enhancer. Int. J. Pharm. 2004;269:109–120. doi: 10.1016/j.ijpharm.2003.09.032. [DOI] [PubMed] [Google Scholar]
- Ratha Adhikari S.N., Nayak B.S., Nayak A.K., Mohanty B. Formulation and evaluation of buccal patches for delivery of atenolol. AAPS Pharm. Sci. Tech. 2010;11:1038–1044. doi: 10.1208/s12249-010-9459-z. [DOI] [PMC free article] [PubMed] [Google Scholar]
- Roberts M.S., Lai P.M., Cross S.E., Yoshida N.H. Mercel Dekker; New York: 1997. Mechanism of transdermal drug delivery. 291–249. [Google Scholar]
- Schubert R., Beyer K., Wolburg H. Liposomes as drug carrier. Int. J. Pharm. 2000;194:201–207. [Google Scholar]
- Schwartz J.B., O’connor R.E., Schnaare R.L. Optimization technique in pharmaceutical formulation and processing. In: Banker G.S., Rhodes C.T., editors. Modern Pharmaceutics. 4th edition. Marcel Dekker Inc; New York: 2007. pp. 607–627. [Google Scholar]
- Semalthy A., Semalthy M., Singh R., Saraf S.K., Saraf S. Iontophoretic drug delivery system- a review. Technol. Health Care. 2007;15:237–245. [PubMed] [Google Scholar]
- Sen A., Daly M.E., Hui S.W. Transdermal insulin delivery using lipid enhanced electroporation. Biochim. Biophys. Acta. 2002;1564:5–8. doi: 10.1016/s0005-2736(02)00453-4. [DOI] [PubMed] [Google Scholar]
- Tripathi K.D. Essentials of Medical Pharmacology. 4th edition, Chapter 18. Jaypee Brothers Medical Publishers (P) Ltd.; New Delhi, India: 1999. Insulin, oral hypoglycaemics and glucagon. 264-283. [Google Scholar]
- Yang T.J., Wang X.T., Yan X.Y., Zhang O. Phospholipids deformable vesicle for buccal delivery of insulin. Chem. Pharm. Bull. 2002;50:749–753. doi: 10.1248/cpb.50.749. [DOI] [PubMed] [Google Scholar]