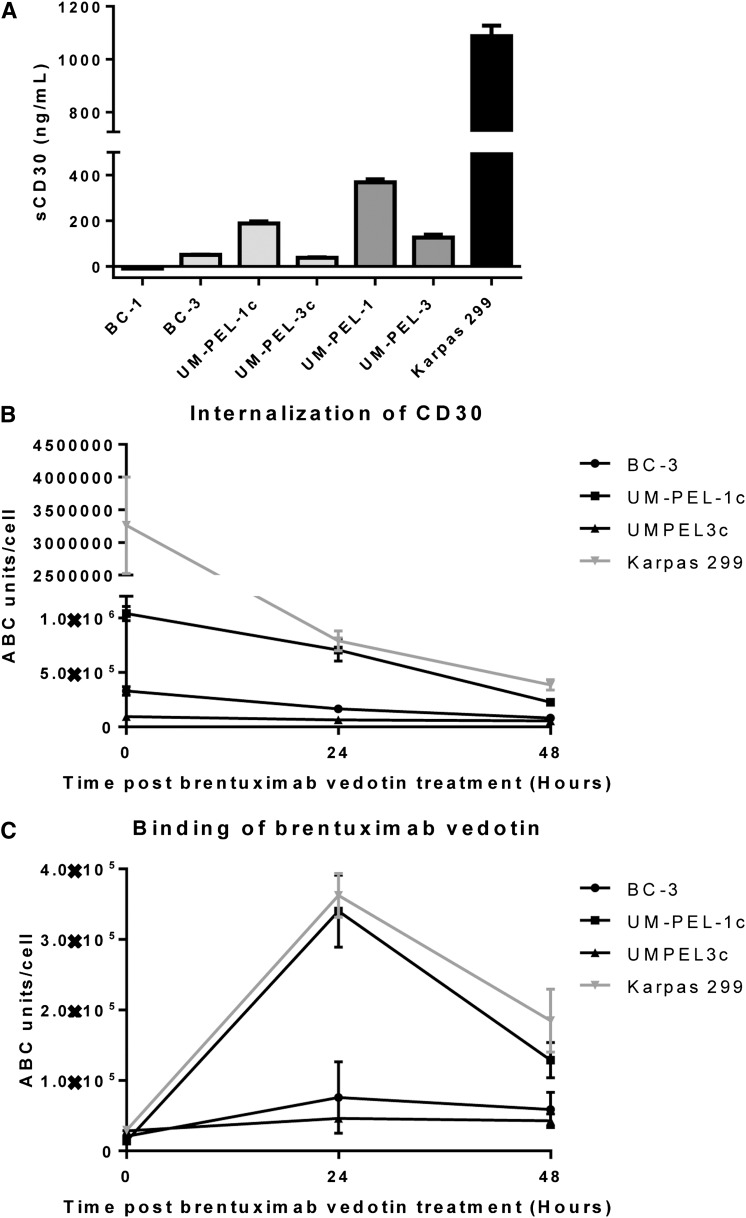
Figure 6.
sCD30 levels, CD30 internalization, and brentuximab vedotin cell surface binding. (A) sCD30 levels measured by ELISA in indicated cell lines and in cells directly derived from mice ascites. Error bar represents standard error of the mean between triplicate wells. (B) Cell surface CD30 expression and (C) cell surface brentuximab vedotin binding. BC-3, UM-PEL-1c, UM-PEL-3c, and Karpas 299 cells were incubated with 15 μg/mL brentuximab vedotin for 0, 24, and 48 hours followed by incubation with anti-CD30 (fluorescein isothiocyanate [FITC]) (B) or anti-hIgG (FITC) (C) to determine antigen-binding capacity values for CD30 (B) and of bound brentuximab vedotin (C), respectively. Microbeads coated with known quantities of mouse-IgG were incubated with saturating quantities of anti-CD30 (FITC) or anti-hIgG (FITC) antibodies to determine mean fluorescence intensity assessed by flow cytometry to obtain standard curves. Data are representative of 3 independent experiments and error bars correspond to the standard error of the mean.

