

Abstract
Fragment-based screening has typically relied on X-ray or NMR methods to identify low affinity ligands that bind to therapeutic targets. These techniques are expensive in terms of material and time, so it useful to have a higher-throughput method to reliably pre-screen a fragment library to identify a subset of compounds for structural analysis. Calorimetry provides a label-free method to assay binding and enzymatic activity that is unaffected by the spectroscopic properties of the sample. Conventional microcalorimetry is hampered by requiring large quantities of reagents and long measurement times. Nanocalorimeters can overcome these limitations of conventional ITC. Here we have used enthalpy arrays, which are arrays of nanocalorimeters, to perform an enzyme activity based fragment screen for competitive inhibitors of phosphodiesterase 4A (PDE4A). Several inhibitors with KI<2 mM were identified and moved to X-ray crystallization trials. Although the co-crystals did not yield high-resolution data, evidence of binding was observed and the chemical structures of the hits were consistent with motifs of known PDE4 inhibitors. This study shows how array calorimetry can be used as a pre-screening method for fragment-based lead discovery with enzyme targets, and it provides a list of candidate fragments for inhibition of PDE4A.
Keywords: nanocalorimetry, enzyme assay, label-free assay, fragment-based lead discovery, X-ray crystallography
Introduction
In fragment-based lead discovery (FBLD) small, low complexity chemical fragments of 6–15 heavy atoms are screened for inhibiting the target. Hits are then linked and/or elaborated into tightly binding ligands, ideally yielding early lead compounds for drug discovery1–3. Because of the simplicity of fragments, hit rates are high, typically 3–4%, so much smaller libraries are required than for HTS4. Since the average molecular weight of fragments is typically lower than for HTS, FBLD tends to identify weakly binding ligands with Kd in the ~100 μM to mM range. Because of this, ligand efficiency (LE5) is often used to assess the binding of fragments rather than the binding affinity per se. This normalizes binding strength with compound size and better quantifies the effectiveness of a fragment as a building block for synthesizing tightly binding compounds. Ligand efficiency is defined as LE=−ΔG0/# heavy atoms = −RTln(Kd)/# heavy atoms and is equivalent to the free energy of binding per heavy (i.e., non-hydrogen) atom. In practice, IC50 measurements are often used as an approximation for Kd. During fragment optimization, the expectation is that the ligand efficiency will be maintained, yielding a high-affinity yet sufficiently small lead compound. Generally, ligand efficiencies of LE >0.3 kcal/mole/heavy atom are considered favorable5.
Because hits arising from FBLD are usually low affinity, sensitive detection methods are required. A common approach to solving this problem has been to use X-ray6 or NMR7 as the assay. These techniques have led to the identification of numerous potent and specific inhibitors and several drug candidates in clinical trials8. However, these techniques are expensive in terms of protein required, the time and expense of preparing either crystals for X-ray analysis or labeled protein for 2D NMR, the time needed to collect the massive amount of data necessary for analysis and structure determination, and equipment cost. Hence, for fragment screening, it is useful to have a high-throughput assay that can reliably detect ligand binding in the μM to mM range to be used as a pre-screen for these more intensive methods.
Another approach, Tethering9, uses mass spectrometry to identify ligands that interact with a protein target at a specific site. The technique relies on the formation of a disulfide bond between the fragment and a cysteine residue (either native or engineered) in the region of interest of the target protein. The Tethering method provides some information about the binding mode of the fragment, but requires moderate quantities of protein (0.5–5 mg) and specially synthesized fragment libraries which contain a disulfide moiety2.
An alternative to the structure-based approaches is to use fragment screening methods based on high concentration screening using HTS assays10; 11. The advantages of this approach are low protein requirements, high throughput, and cost savings for instrumentation. The major limitations with this approach include the large number of false positives due to compound interference or aggregation and the lack of information on binding motif or geometry2. In addition, a functional assay is required to initiate a screen with this method.
More recently, the use of surface plasmon resonance (SPR) methods to screen fragment libraries has been described12; 13. These assays are label-free, so they do not suffer from the same limitations as standard HTS assays. Two limitations of the SPR method are that the assay is restricted to detection of binding, rather than activity-based measurements, and the binding affinity that can be detected is related to the MW of the target protein12. Specifically, binding of a small fragment to a large protein will produce a smaller signal than binding of the same fragment to a smaller protein. Practically, this means that the affinity limit for larger proteins is lower than from smaller proteins. When properly executed, SPR assays can identify compounds that aggregate or bind promiscuously so that they can be removed from the library14.
Isothermal titration calorimetry (ITC) directly measures the heat released or absorbed during a biomolecular reaction, and binding parameters determined by ITC are often referred to as the “gold standard” values15. Because the measurement is label-free and requires no immobilization of either the target or ligand, calorimetry can be used to perform a direct enzyme activity assay without modifying the substrate or using coupled reactions to produce the observed signal16. In addition, a calorimetric measurement is unaffected by spectroscopically opaque solutions that may occur with high concentrations of substrate, product, or fragments. Although the use of ITC to determine enzyme kinetics and inhibition has been described previously16–18, the measurements are performed one at a time and require quantities of reactants that are considered as quite large in biochemical studies, making high-throughput measurements or measurements with limited amounts of material unfeasible. Nanocalorimeters can in principle overcome these limitations of conventional ITC.
Enthalpy arrays are arrays of nanocalorimeters that allow scientists to measure thermodynamics and kinetics of molecular interactions using small sample volumes (250 nl) and short measurement times (typically 5–10 min)19. Previously, we demonstrated that enthalpy arrays can be used to determine the kinetic parameters for enzymatic reactions and the mechanism of action of inhibitors20.
In this study, we use enthalpy arrays in activity-based screening of fragments for discovery of inhibitors of phosphodiesterase 4A. Phosphodiesterase 4 (PDE4), which consists of four subfamilies (A–D), is a cAMP specific phosphodiesterase for which selective inhibitors have been studied as anti-inflammatory therapeutics for treatment of asthma, COPD, and rheumatoid arthritis21. Although an array of inflammatory diseases might be treated with PDE4 inhibitors, narrow therapeutic windows have limited their clinical use21. To determine the utility of nanocalorimetry as a pre-screening method in FBLD, we screened a 160 compound fragment library for competitive inhibitors of PDE4A.
Methods
PDE4A10 cloning, expression, and purification
The catalytic domain of PDE4A10 (EC 3.1.4.53) was expressed and purified as described by Wang et al22 with modification. Since all isoforms of PDE4A have the same sequence in the catalytic domain, we will refer to the enzyme as PDE4A from this point forward.
PDE4A was cloned into a proprietary vector containing an N-terminal 6Xhis tag, cleavable by TEV protease. Positively identified clones were expressed in BL21(DE3)RIL cells. Cells containing target plasmid were grown in LB containing selection antibiotics at 37°C until OD600 = 0.7–0.8. Cells were induced with 0.1mM IPTG at 15°C overnight. The cells were harvested and stored at −80°C. Cell pellets were lysed in 50mM Tris, pH8.0, 500mM NaCl, 0.1% (w/v) NP-40, and 10mM imidazole (lysis buffer). The suspension was sonicated on ice for 2min at 70% output with a 25% duty cycle. Clarified supernatant was loaded onto Ni2+ charged IMAC. Peak fractions containing target protein were cleaved overnight with TEV protease. Cleaved protein was isolated by running the sample over Ni2+ charged IMAC, collecting flow-through. Protein was characterized for relative oligomeric state by size exclusion chromatography in 20mM HEPES pH7.5, 150mM NaCl, and 5mM DTT. Monomeric PDE4A was concentrated to 34mg/mL.
Fragment library
Select compounds from a commercial fragment library, ActiveSight library 2, were used in this study. For the initial screen, individual compounds dissolved at 200 mM in DMSO and stored in 96-well plates were used. The average molecular weight of the compounds was 154.1 and the average number of heavy atoms was 10.4. Hits were verified by preparing fresh solutions from dry powder.
PDE4A calorimetric activity assay
Hydrolysis of 3′,5′-cAMP was measured at 21 °C in 100 mM Tris–HCl, pH 7.5, 10 mM MgCl2, 1 mM TCEP, 2% (v/v) DMSO. Each enthalpy array detector contains a sample region and a reference region, which are designated based on the material deposited on the region (see Figure 1 of Recht et al 2009)20. The sample region materials consisted of a drop of PDE4A (10 μM) and a drop of substrate solution (4 mM 3′,5′-cAMP). The reference region used a drop of BSA (0.02 mg/ml, 0.30 μM) and a drop of the same substrate solution (4 mM 3′,5′-cAMP) used in the sample region. The purpose of the small amount of BSA is to give the reference drops wetting behavior similar to the sample drops, especially after merging. Immediately after merging, the combined drops in the sample region contained 5 μM PDE4A and 2.0 mM 3′,5′-cAMP, and the combined drops in the reference region contained 0.15 μM BSA and 2.0 mM 3′,5′-cAMP. Reactions with compounds from the fragment library (2 mM in the combined drops, except as noted) were performed as above, except that a single compound (4 mM, except as noted) was included with the substrate (4 mM 3′,5′-cAMP). Adenosine 3′,5′-cyclic monophosphate, pentoxifylline, and 3-isobutyl-1-methylxanthine (IBMX) were obtained from Sigma–Aldrich and used without further purification. The concentration of the 3′,5′-cAMP stock solution (adjusted to pH 7 with dilute NaOH) was determined by measuring the absorbance at 258 nm and using an extinction coefficient of 14,650 M−1 cm−1 23.
We used an enzyme concentration that would result in a good signal-to-noise ratio at Vmax, and the substrate concentration was then adjusted to produce the length of reaction desired. Typically, three replicates of each measurement were performed and the average and standard error of the mean of the measurements are reported. Measurements with inhibitors had a corresponding set of control measurements without inhibitor performed at the same time.
The reactions were performed in Tris buffer to take advantage of the additional heat arising from protonation of the buffer by hydrogen ion release that accompanies hydrolysis of 3′,5′-cAMP to 5′-AMP (nH+≈0.86 per cAMP hydrolyzed at pH 7.324). The apparent enthalpy, ΔHapp, measured by calorimetry comprises the intrinsic enthalpy of the reaction (ΔHint) and ionization of the buffer (ΔHion)25 so that
| Eq. (1) |
In Tris buffer, nH+ ΔHion contributed an additional −9.75 kcal/mol, effectively increasing the signal 1.6-fold compared to the same reaction performed in phosphate buffer24.
Follow-up studies on the inhibition mechanism of compounds 104 and 152 were performed using a Microcal iTC200 (MicroCal/GE Healthcare, Piscataway, NJ). The reactions were performed at 25°C in 100 mM Tris–HCl, pH 7.5, 10 mM MgCl2, 1 mM TCEP, 2% (v/v) DMSO and contained 47 nM PDE4A, 560 μM 3′,5′-cAMP, and compound at concentrations between 233 μM and 3720 μM. Control reactions in the absence of inhibitor yielded kinetic parameters similar to the enthalpy array measurements.
Data analysis
For each measurement we recorded the differential temperature as a function of time. This information was converted into an enthalpy by deconvolving the rate of heat generation (Q(τ)), which is subsequently transformed into the reaction velocity as a function of substrate as described in Recht et al 200920.
One can determine kcat and KM for experiments with no inhibitor by fitting the data for Q/([E]ΔH) versus [S] to
| Eq. (2) |
In this equation, Q is the rate of heat generation, kcat is the turnover number, E0 is the total enzyme concentration, [S] is the substrate concentration, ΔH is the enthalpy per mole of substrate reacted, and β is the slope for Q versus [S] at [S] greater than KM20. The (1+β[S]) term modifies the general rate equation. As a practical matter, the modification becomes significant at [S] »KM for the data we present below, or in other words, (1/β) »KM. Thus, it is clearly distinguishable from the effect of KM. The general rate equation was used because the concentration of enzyme in the reaction was high relative to KM (E0/KM>0.1), and depletion of substrate from solution becomes significant under these conditions26; 27. We used the Matlab® function lsqcurvefit to perform a regression on Eq. (2), allowing for the possibility that the values of [S] may be off by a small constant in the regression, which helps to accommodate for noise near the [S]=0 limit of the data.
We also examined inhibited reactions. We were able to observe a change in the apparent KM caused by a competitive inhibitor, allowing us to determine KI. To understand the meaning of an increase in apparent KM, it is useful to examine the Michaelis-Menten equation modified for competitive inhibition (Fersht, eqn. 3.32)28:
| Eq. (3) |
in which [I] is the concentration of free inhibitor. The apparent KM is seen to be the true KM multiplied by (1+[I]/KI). At inhibitor concentrations [I]>KI, the shift in apparent KM becomes significant. When [I]≫E0 holds, as it does for all reactions with fragments here, the concentration of free inhibitor [I] is close to the total concentration of inhibitor I0, making it reasonable to use I0 in the above equation in place of [I], the standard practice in enzymology.
Protein crystallization, data collection and structure determination
For co-crystallization studies, PDE4A was incubated with 5 mM pentoxifylline on ice for 1 h. Crystals of PDE4 in complex with 5 mM pentoxifylline were obtained using the hanging-drop vapor-diffusion method by mixing 2 μl of 34 mg/ml protein solution (in HEPES pH7.5, 150mM NaCl, and 5mM DTT) with 2 μl of 1.5 M ammonium sulfate, 0.1 M Bis/Tris propane pH 7.0 at 20° C. Diffracting crystals appeared within 3–5 days and grew to 0.4 mm in length. Prior to data collection, crystals were transferred into a cryoprotectant solution consisting of 25% (v/v) glycerol in crystallization buffer and then flash-frozen in liquid nitrogen.
Diffraction image data were collected at the Advanced Photon Source on beam line 21ID. Image data for the crystal containing pentoxifylline was processed using HKL200029. The structure was solved by molecular replacement using MOLREP program from the CCP4 program suite30. The protein component of an isomorphous crystal structure of PDE4, entry 3I8V from the Protein Data Bank (Cheng RKY et al., PDB ID: 3I8V), was used as the molecular replacement search model. Minimal refitting with the MIFit program31 and refinement with the REFMAC5 program32 were required to bring this model into good agreement with the data (Table 1). Density corresponding to the pentoxifylline ligand was clearly visible in the PDE4A active site in protein copy A with a very evident ‘tail density’ indicating the binding orientation. A somewhat less well-defined density is also present in protein copy B but with sufficient indications of ‘tail density’ to show that the pentoxifylline molecule is bound in the same orientation as in protein copy A. In additional to visual examination, all structures were systematically and automatically checked throughout the refinement process for cis-peptides, various measures of covalent stereochemistry, close contacts, abnormal phi-psi angles, abnormal rotamers and mismatched density features via output from the MIFit refinement interface. The final structure does not contain any significant abnormalities (Table 1) and has been deposited with the Protein Data Bank as entry 3TVX.
Table 1.
Crystal and refinement parameters for PDE4A-Pentoxifylline
| Pentox | |
|---|---|
| Data Processing | |
| Wavelength (Å) | 0.979 |
| Unit cell parameters (Å) | a=b=104.94 c=163.65 |
| Space group | P41212 |
| Resolution range | 48.4-2.84 |
| No. observations | 214917 |
| No. unique reflections | 22313 |
| Data completeness | 100.0 (100.0) |
| Rmerge | 0.068 (0.578) |
| <I/σ(I)> | 34.4 (4.5) |
| Multiplicity | 9.6 (9.9) |
| Refinement | |
| Resolution range (Å) | 48.4-2.84 |
| No. reflections | 22253 |
| Rwork | 0.2205 |
| Rfree | 0.2895 |
| No. of protein copies | 2 |
| No. of atoms | 5437 |
| No. of waters | 0 |
| Mean B-factor (Å2) | 70.1 |
| R.m.s.d. bond lengths (Å) | 0.007 |
| R.m.s.d. bond angles (°) | 1.004 |
| No. of Ramachandran plot outliers | 1 |
Results
The calorimetric activity assay was validated using two known general phosphodiesterase inhibitors: 3-Isobutyl-1-methylxanthine (IBMX) and pentoxifylline. As shown in Figure 1, fitting the solid black points (no inhibitor) yielded kcat = 3.7 s−1 and KM = 24 μM, compared to kcat = 6.7 s−1 and KM = 5.1 μM for the catalytic domain of PDE4A using a radioactivity-based assay22. The open circles in Figure 1 show rate versus remaining substrate concentration for PDE4A hydrolysis of 3′,5′-cAMP in the presence of pentoxifylline (Fig. 1A) or IBMX (Fig. 1B). Both inhibitors display competitive inhibition of PDE4A, with KI values in good agreement with those expected based on IC50 values in the literature (Table 2; Pentoxifylline IC50 =168 ± 105 μM33; IBMX IC50 = 10.5 ± 0.3 μM34).
Figure 1.
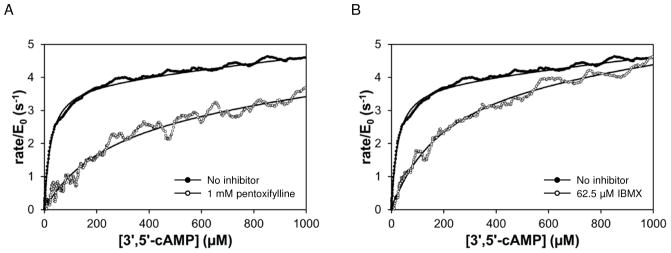
PDE4A hydrolysis of 3′,5′-cAMP in the absence (solid) and presence (open) of known general phosphodiesterase inhibitors. Reactions contained 5 μM PDE4A and 2 mM 3′,5′-cAMP. Solid curves are fit of data to Equation 2. (A) Rate versus remaining 3′,5′-cAMP concentration in absence and presence of 1 mM pentoxifylline. KI for the reaction shown is 110 μM. (B) Rate versus remaining 3′,5′-cAMP concentration in absence and presence of 62.5 μM IBMX. KI for the reaction shown is 8.5 μM.
Table 2.
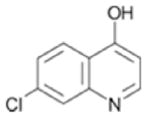
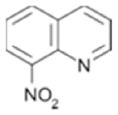
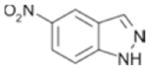
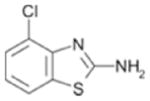
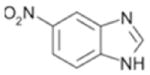
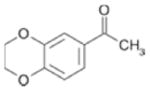
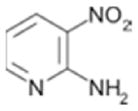
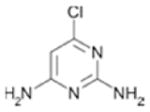
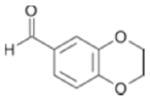
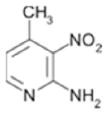
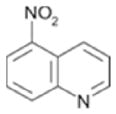
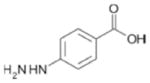
Inhibition constants and ligand efficiencies of compounds sorted based on KI. The KI and corresponding ligand efficiency based on measurements using freshly prepared stock solutions of compounds. Compound number corresponds to the position along the X axis in Figure 2.
| Compound | Structure | KI (μM) | Ligand Efficiency (kcal moL−1 HA−1) |
|---|---|---|---|
| IBMX(a) |
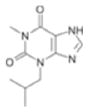
|
8.3 ±1.5 | 0.43 |
| Pentoxifylline(b) |
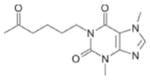
|
72 + 18 | 0.28 |
| 80(c) |
|
320 ± 27 | 0.39 |
| 73(b) |
|
370 ± 29 | 0.38 |
| 111 |
|
460 ± 63 | 0.35 |
| 88(c) |
|
560 ± 43 | 0.36 |
| 81(b) |
|
580 ± 72 | 0.40 |
| 96 |
|
710 ± 64 | 0.35 |
| 113 |
|
810 ± 130 | 0.32 |
| 109 |
|
1300± 160 | 0.39 |
| 49 |
|
1400+140 | 0.43 |
| 98 |
|
1600 ± 97 | 0.31 |
| 33 |
|
1800 ± 150 | 0.34 |
| 104(d) |
|
Kic=170 ± 10 Kiu =670 ± 30 |
NA |
| 152(e) |
|
kcat reduced ≈20% | NA |
Compounds were present at 2 mM in the final reaction, except as indicated:
62.5 μM,
0.5 mM,
1 mM,
0.233 mM, 0.465 mM, 0.930 mM,
0.930 mM, 1.86 mM, 3.72 mM.
Kic, competitive inhibition constant, Kiu, uncompetitive inhibition constant.
The activity based enthalpy array screen with the catalytic domain of PDE4A against a 160-compound fragment library was performed at a compound concentration of 2 mM. Corresponding control reactions in the absence of any inhibitor were performed for every 5 fragments tested and acted as the basis for comparison of KM values for those 5 fragments. Figure 2 displays the results of the fragment screen as the ratio of the KM in the presence of fragment (KM, app) to the KM of the corresponding control reaction (KM, control). Fourteen compounds produced a KM ratio ≥2. These were considered hits and 11 of 14 were confirmed to have KI ≤2 mM using fresh stocks of fragments and protein. The KI and ligand efficiencies for all compounds that produced a confirmed KM ratio greater than 2 are presented in Table 2.
Figure 2.
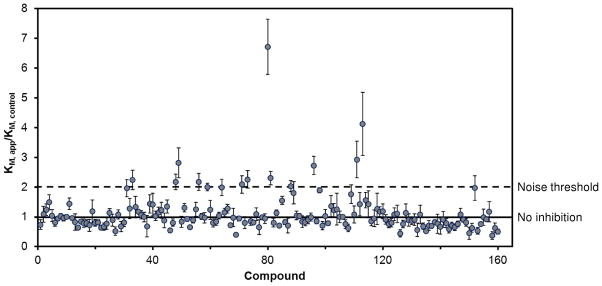
Results of the screen of 160 compounds with the calorimetric activity assay. The ratio of the KM in the presence of the fragment (KM, app) to the KM of an associated control reaction (KM, control) is shown. Compounds were tested at 2 mM concentration. For every 5 compounds, an associated control reaction (no inhibitor) was run and served as the KM, control for those compounds. The solid line indicates a KM ratio of 1, which means no effect compared to control. The dashed line indicates a KM ratio of 2, the noise threshold selected for a compound to be classified as a hit. The error bars indicate the standard error of the mean for the KM ratio.
We observed that two compounds, 104 and 152, caused inhibition that was not consistent with simple competitive inhibition. Compound 104 (at 2 mM) displayed mixed inhibition, reducing kcat by 25% and increasing KM by 2.7-fold. Compound 152 (at 2 mM) reduced kcat by 20% but did cause a significant change in KM. We investigated the inhibition mechanism of these two compounds using an ITC enzyme activity assay, which provides more sensitivity than the enthalpy array assay. Reactions were performed at several inhibitor concentrations and the competitive (Kic) and uncompetitive (Kiu) inhibition constants were obtained for compound 104 (Table 2 and supplementary figures S1–S3). A reduction in kcat was observed with compound 152, but the KI was much higher than the highest concentration of compound tested (3.72 mM, Table 2).
Examples of primary screening data are shown in Figure 3. Figure 3A shows the data for the strongest inhibitor (80), Figure 3B the weakest (33). Most compounds did not show any sign of competitive inhibition, as shown for compound 51 in Figure 3C.
Figure 3.
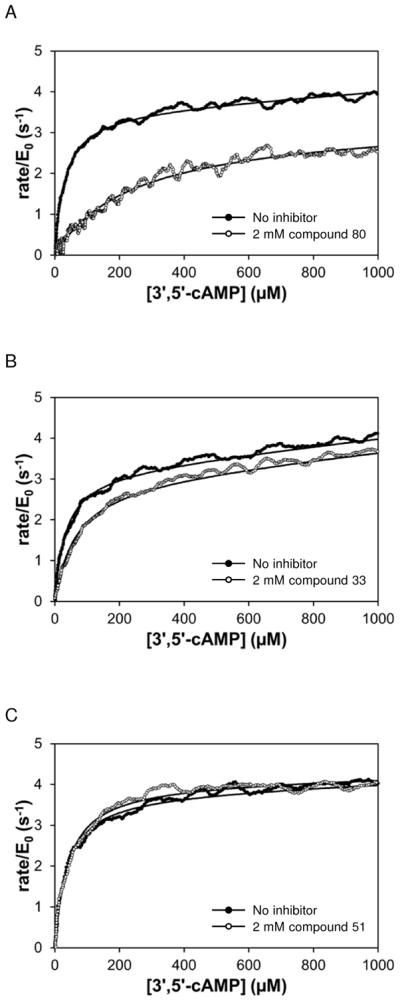
Rate versus remaining substrate concentration data for PDE4A hydrolysis of 3′,5′-cAMP in the absence (solid) and presence (open) of three compounds from the primary screen. Solid curves are fit of data to Equation 2. (A) Compound 447 (80); KI for this reaction is 280 μM. (B) Compound 429 (33); KI for this reaction is 1.9 mM. (C) Compound 51; KI for this reaction is >2 mM.
The 11 fragments listed in Table 2 were moved into X-ray crystallography studies. Initially, efforts were made to obtain high-quality apo-PDE4A crystals. Multiple crystal forms were observed and tested, but all diffracted only marginally > 3.0 Å and none were deemed suitable for high-throughput soaking experiments. Co-crystallization experiments followed. Although co-crystals could be obtained with the fragments in Table 2, the diffraction quality of crystals appeared to vary with the potency of the starting ligand. High-quality diffraction was obtained with one potent ligand, pentoxifylline.
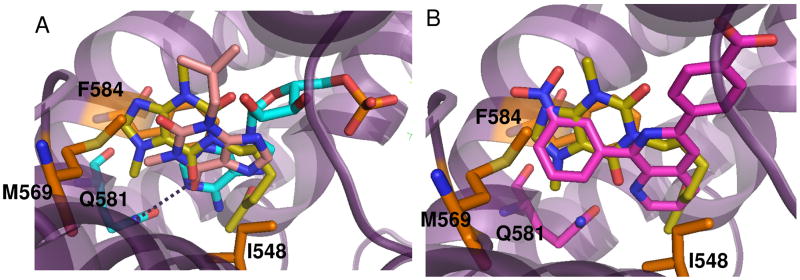
The crystal structure of PDE4A in complex with pentoxifylline is shown in Figure 4. As stated above (in Methods), the ligand was bound in the same orientation in both molecules of the asymmetric unit and was clearly defined in the electron density map, in particular for molecule A (Figure 4A). The purine ring of pentoxifylline is bound near the active site sandwiched between Phe 584 and Met 569 with the C18 methyl occupying a small sub-pocket. As shown in Figure 5A, the purine ring binds differently from that of adenosine mono-phosphate (AMP35) and the PDE inhibitor IBMX36. In AMP and IBMX, the purine ring is bound in the primary pocket and accepting a hydrogen bond from Asn 321 (PDE4A numbering) although the hydrogen bonding patterns are different. In AMP, the hetrocyclic N1 is accepting the hydrogen bond from Asn-NH2 and in IBMX, the exocylic 6-oxy group is accepting the hydrogen bond as the N1 group is methylated. In the pentoxifylline structure, the aliphatic tail is bound in the primary purine pocket and interacting with Ile 548 (Figure 4B, C). Although apparently not occupied by AMP, the area of the active site occupied by the pentoxifylline molecule does overlap with other small molecule inhibitors of PDE4A such as NVP22 shown in Figure 5B. Pentoxifylline is not within standard hydrogen bonding distance of any PDE4A residues but may be making a long hydrogen bond with Gln 581 (3.8Å).
Figure 4.

Crystal structure of PDE4A in complex with pentoxifylline. A. 2Fo−Fc electron density map for pentoxifylline (molecule A) at 2.8 Å resolution contoured at 1.0 sigma. B. Ligand binding plot for interactions of pentoxifylline with PDE4A. C. PDE4A molecular surface (purple) with side chains interacting with pentoxifylline shown in orange and the pentoxifylline ligand shown in yellow. D. Refined unbiased 2Fo−Fc electron density map contoured at 1σ showing a 4σ peak corresponding to binding of fragment 113. Although the volume of the density corresponded to the size of the ligand, the low resolution of the map did not provide enough details to properly orient the ligand.
Figure 5.
Overlay of pentoxifylline with published PDE4 crystal structures. Amino acid numbering corresponds to PDE4A. A. Overlay of pentoxifylline (yellow) with AMP (teal) and IBMX (light pink) showing that the purine ring of pentoxifylline does not overlay with the purine ring of AMP (PDE4D2; PDB 1PTW) or IBMX (PDE4D2; PDB 1ZKN). B. Overlay of pentoxifylline (yellow) with the published inhibitor NVP (pink, PDB 2QYK) showing binding of the nitroxy-phenyl with the purine ring of pentoxifylline.
Lower resolution maps for co-crystal structures with other fragments showed evidence of binding but were not completed due to poor definition of ligand orientation in the active site. Figure 4D shows an example of this low resolution data. Here, a tube of density at a peak height of 4σ consistent with fragment 113 was present in the unbiased electron density maps at 3 Å resolution. Because of the low resolution of the map, the compound was not included in the final structure.
Because a high-quality structure could be obtained in the presence of pentoxifylline, soak-out, soak-in experiments were completed to displace pentoxifylline with the fragment of interest. PDE4A-pentoxifylline crystals were soaked in the presence of fragment hits. However, surprisingly, the crystals were not stable to soaking times beyond ~5 minutes. To understand these data, crystals were exposed to the fragments individually and flash-frozen in liquid nitrogen after a 5 minutes incubation. Data were collected at high resolution (2.3–2.6 Å) and structures solved by molecular replacement. In all cases, pentoxifylline remained bound at the active site, and the fragment was found bound at a secondary binding pocket immediately adjacent to the pentoxifylline and partially composed of residues from a neighboring symmetry related molecule. A second fragment molecule was found bound at a small groove at a close crystal contact. It is possible that high occupancy binding at this site could result in disruption of the crystal lattice and lead to the crystal cracking observed with longer soaks. Details of these experiments will be published elsewhere.
Discussion
We demonstrate here that low-affinity competitive inhibitors of PDE4A can be identified using an enthalpy array enzyme activity assay. Screening at a compound concentration of 2 mM ensured that compounds with KI ≤ 2 mM could be detected above the noise threshold. The 2 mM cutoff corresponds to a ligand efficiency ≥ 0.3 for the average number of heavy atoms for the compounds in this library.
For phosphodiesterases, the direct label-free measure of substrate conversion using calorimetry provides a distinct advantage compared to the existing standard assays, which rely either on coupled enzymes37, radioactivity38, or HPLC separation39. In fragment screening with the coupled enzyme assay there is the possibility that compounds could interfere with the coupling enzymes rather than the enzyme of interest. It is necessary that the appropriate controls be performed to ensure that inhibition is due to action on the desired target. The radioactivity and HPLC assays are discontinuous and labor intensive. In contrast, each calorimetric measurement is a rapid continuous assay yielding full enzyme kinetic parameters for reactions performed in the presence of each compound. For competitive inhibitors, this allows determination of KI for each compound from the primary screening data. A limitation of continuous assays is that product accumulates during the course of the reaction, which is an issue if product inhibition is significant. For the reactions presented here, the substrate concentration (2 mM), and therefore corresponding product concentration at the end of the reaction, is below the reported Kd for AMP (7.1 mM40), so any product inhibition will cause, at most, ≈30% increase in the apparent KM for the control reaction.
The screen we describe here was used to identify inhibitors that act exclusively by a cAMP-competitive mechanism. By screening for compounds that alter kcat, the enthalpy array assay could be used to identify compounds that inhibit by a noncompetitive or uncompetitive mechanism with KI < 2 mM. Activity-based assays in general exclude from the list of hits compounds that bind to the target protein but do not but significantly inhibit the enzymatic reaction. These compounds could bind in pockets from which potent inhibitors could be developed; hence some very weakly binding fragments that might lead to potent inhibitors may well be missed using activity-based assays.
Unlike PDE4B41 or PDE4C22, PDE4A did not produce crystals in the apo form. Hence, co-crystallization was required. Crystals were obtained with multiple fragments, but all diffracted to low resolution (> 3.0 Å) with the exception of pentoxifylline. Soak-out, soak-in experiments were attempted with the pentoxifylline crystals but the crystals were unstable under these soaking conditions. Data collected with short soak-times revealed both pentoxifylline and the fragment bound at the active site.
With a hard-to-crystallize protein, such as PDE4A, the calorimetric pre-screen adds value because it provides data demonstrating that the compounds inhibit the enzyme by a particular mechanism. With the knowledge that the compounds act as competitive inhibitors, one could consider methods other than X-ray crystallography to obtain information about the specific interactions between the compound and the protein. For some targets, it may be possible to perform structural studies by NMR to determine the three-dimensional structure of the PDE4A-compound complex. Although the X-ray and NMR methods are expensive in terms of labor, material, and equipment, they do provide structural information about the binding interactions between fragments and the biomolecular target, which is crucial for efficiently transforming fragment hits into leads via fragment elaboration or linking. Another option is to use docking methods based on crystal structures of related proteins (or crystal structures of other ligands bound to the protein of interest) to propose potential binding models for the fragments and use this information to guide the synthesis of modified or elaborated fragments which can be tested for inhibition in the calorimetric assay. Additional attempts at X-ray crystallography perhaps using different protein constructs or protein mutants could be made, but this additional work was beyond the scope of this study.
Although we were unable to obtain crystal structures for all fragments bound to PDE4A, the chemical structure for many of the hits are consistent with either PDE4 substrates or published inhibitors. Specifically, fragments 109, 49 and 33 contain a hydrogen bonding motif present in the adenine core of AMP (Figure 6A). In the PDE4D-AMP structure (Figure 5A), the exocyclic nitrogen and adjacent ring heteroatom are within hydrogen bonding distance of Gln 581 (PDE4A numbering). Because the fragments are much smaller than AMP, it is possible they may maintain these hydrogen bonds but bind in a slightly different mode representing the lowest energy binding conformation. Similarly, fragments 73, 111 and 104 share a common core with published PDE4 inhibitors. Two of these, NVP (PDB code 2QYK22) and 4-[3-methoyphenyl)amino]-6-(methylsulfonyl)quinoline-3-carboxamide (PDB code 3FRG42), have published crystal structures and are shown in Figure 6B. In these structures, the quinoline heterocyclic nitrogen is hydrogen bonding with Gln 581 (PDE4A numbering) and examination of the overlay shows that the core may shift in binding mode based upon the substitution pattern on the ring without losing the hydrogen bond. As with the purine, it is likely that the quinoline rings of the fragment hits occupy slightly different relative orientations depending on their substitution patterns. Regardless of the binding modes, the chemical structures of these fragment hits are consistent with known PDE4 ligands, further substantiating them as valid hits.
Figure 6.

Summary of screening hits with purine and quinoline-like hydrogen bonding motifs. A. Hydrogen bonding of AMP to PDE4D2 showing two hydrogen bonds with Gln581(PDE4A numbering). Fragments 109, 49 and 33 all share this hydrogen bonding motif. B. Hydrogen bonding of two published quinoline fragments NVP (PDE4A10; PDB code 2QYK, pink) and 4-[3-methoyphenyl)amino]-6-(methylsulfonyl)quinoline-3-carboxamide (PDE4B2B; PDB code 3FRG, green) to PDE. Although hydrogen bonding between the quinoline nitrogen and Gln581 is maintained, the orientation of the quinoline in the pocket varies with the substitution pattern on the ring. Fragments 73, 111 and 104 all contain a quinoline heterocycle core.
Although pentoxifylline was one of the more potent compounds tested (72 μM), it is the least ligand efficient (0.28). Examination of the crystal structure (Figure 4) provides a possible explanation for this observation. The aliphatic “tail” of the ligand inserts into the primary binding pocket rather than the molecule’s core, most likely because the core is highly substituted. The high degree of substitution could sterically interfere with binding in the pocket and also interferes with hydrogen bonding with Gln 581. Based on the crystal structure, the interactions between this ligand and protein appear to be purely van der Waals.
In contrast to the dearth of interactions observed here for pentoxifylline, IBMX forms an extensive network of interactions with PDE4 and has both higher potency (8.3 μM) and ligand efficiency (0.43). In the PDE4D-IBMX structure (36; PDB 1ZKN, Figure 5A), the xanthine ring stacks against Phe-372 (Phe 584 PDE4A) on one side and contacts Ile-336 (Ile 548, PDE4A) and Phe-340 (Phe 552, PDE4A) on the other side. IBMX forms a hydrogen bond with the side chain of Gln-369 (Gln 581, PDE4A) and hydrophobic interactions with Leu-319 (Leu 319, PDE4A)) and Asn-321 (Asn 533, PDE4A). In addition, there are interactions of the isobutyl group with Met-273 and Ile-376 (Ile 588, PDE4A), and unique interactions with Met-273 (Met 485, PDE4A) and Met-357 (Met 569, PDE4A).
The use of enthalpy arrays to pre-screen fragments for inhibition of enzymatic activity has two benefits: 1) the number of structural characterizations is reduced, reducing labor and material cost which is particularly important in cases where structural characterization is more difficult than expected, and 2) one knows that the compounds have an effect on the activity of the enzyme, indicating that the fragment is binding to a site of functional interest rather than simply binding. Moreover, calorimetric pre-screening can reveal the inhibition mechanism, such as whether inhibition is competitive, mixed, or uncompetitive. In this study, the pre-screening of PDE4A reduced the number of compounds on which structural characterization needs to be performed by more than a factor of 10. Because all but one of the compounds competitively inhibit the enzyme, there is increased motivation to try to obtain diffracting crystals even if it is a difficult to crystallize target, or to put the investment into NMR characterization of structure.
Supplementary Material
Acknowledgments
We thank Richard Bruce, Alan Bell, and Dirk De Bruyker for their contributions to the enthalpy array technology, system automation, and array fabrication. We thank Duncan McRee for his contribution to the initiation of the PDE4A fragment screening project as well as helpful discussion. We thank G. Sridhar Prasad for his contribution during the early stages of the project. This publication was made possible by Grant Number R01EB009191 from the National Institute of Biomedical Imaging and Bioengineering, National Institutes of Health. Its contents are solely the responsibility of the authors and do not necessarily represent the official views of the NIH.
Footnotes
Conflict of interest statement
M. Recht and F. Torres are employed by Palo Alto Research Center Incorporated. All other authors are employed by Zenobia Therapeutics.
References
- 1.Carr RA, Congreve M, Murray CW, Rees DC. Fragment-based lead discovery: leads by design. Drug Discov Today. 2005;10:987–992. doi: 10.1016/S1359-6446(05)03511-7. [DOI] [PubMed] [Google Scholar]
- 2.Erlanson DA, McDowell RS, O’Brien T. Fragment-based drug discovery. J Med Chem. 2004;47:3463–3482. doi: 10.1021/jm040031v. [DOI] [PubMed] [Google Scholar]
- 3.Jahnke W, Erlanson DA. Fragment-based approaches in drug discovery. Weinheim: Wiley-VCH; Chichester: John Wiley, distributor; 2006. [Google Scholar]
- 4.Hann MM, Leach AR, Harper G. Molecular complexity and its impact on the probability of finding leads for drug discovery. J Chem Inf Comput Sci. 2001;41:856–864. doi: 10.1021/ci000403i. [DOI] [PubMed] [Google Scholar]
- 5.Hopkins AL, Groom CR, Alex A. Ligand efficiency: a useful metric for lead selection. Drug Discov Today. 2004;9:430–431. doi: 10.1016/S1359-6446(04)03069-7. [DOI] [PubMed] [Google Scholar]
- 6.Nienaber VL, Richardson PL, Klighofer V, Bouska JJ, Giranda VL, Greer J. Discovering novel ligands for macromolecules using X-ray crystallographic screening. Nat Biotechnol. 2000;18:1105–1108. doi: 10.1038/80319. [DOI] [PubMed] [Google Scholar]
- 7.Shuker SB, Hajduk PJ, Meadows RP, Fesik SW. Discovering high-affinity ligands for proteins: SAR by NMR. Science. 1996;274:1531–1534. doi: 10.1126/science.274.5292.1531. [DOI] [PubMed] [Google Scholar]
- 8.Hajduk PJ, Greer J. A decade of fragment-based drug design: strategic advances and lessons learned. Nat Rev Drug Discov. 2007;6:211–219. doi: 10.1038/nrd2220. [DOI] [PubMed] [Google Scholar]
- 9.Erlanson DA, Wells JA, Braisted AC. Tethering: fragment-based drug discovery. Annu Rev Biophys Biomol Struct. 2004;33:199–223. doi: 10.1146/annurev.biophys.33.110502.140409. [DOI] [PubMed] [Google Scholar]
- 10.Boettcher A, Ruedisser S, Erbel P, Vinzenz D, Schiering N, Hassiepen U, Rigollier P, Mayr LM, Woelcke J. Fragment-based screening by biochemical assays: Systematic feasibility studies with trypsin and MMP12. J Biomol Screen. 2010;15:1029–1041. doi: 10.1177/1087057110380455. [DOI] [PubMed] [Google Scholar]
- 11.Godemann R, Madden J, Kramer J, Smith M, Fritz U, Hesterkamp T, Barker J, Hoppner S, Hallett D, Cesura A, Ebneth A, Kemp J. Fragment-based discovery of BACE1 inhibitors using functional assays. Biochemistry. 2009;48:10743–10751. doi: 10.1021/bi901061a. [DOI] [PubMed] [Google Scholar]
- 12.Hämäläinen MD, Zhukov A, Ivarsson M, Fex T, Gottfries J, Karlsson R, Bjorsne M. Label-free primary screening and affinity ranking of fragment libraries using parallel analysis of protein panels. J Biomol Screen. 2008;13:202–209. doi: 10.1177/1087057108314651. [DOI] [PubMed] [Google Scholar]
- 13.Perspicace S, Banner D, Benz J, Muller F, Schlatter D, Huber W. Fragment-based screening using surface plasmon resonance technology. J Biomol Screen. 2009;14:337–349. doi: 10.1177/1087057109332595. [DOI] [PubMed] [Google Scholar]
- 14.Giannetti AM, Koch BD, Browner MF. Surface plasmon resonance based assay for the detection and characterization of promiscuous inhibitors. J Med Chem. 2008;51:574–580. doi: 10.1021/jm700952v. [DOI] [PubMed] [Google Scholar]
- 15.Peters WB, Frasca V, Brown RK. Recent developments in isothermal titration calorimetry label free screening. Comb Chem High Throughput Screen. 2009;12:772–790. doi: 10.2174/138620709789104889. [DOI] [PubMed] [Google Scholar]
- 16.Todd MJ, Gomez J. Enzyme kinetics determined using calorimetry: a general assay for enzyme activity? Anal Biochem. 2001;296:179–187. doi: 10.1006/abio.2001.5218. [DOI] [PubMed] [Google Scholar]
- 17.Bello AM, Konforte D, Poduch E, Furlonger C, Wei L, Liu Y, Lewis M, Pai EF, Paige CJ, Kotra LP. Structure-activity relationships of orotidine-5′-monophosphate decarboxylase inhibitors as anticancer agents. J Med Chem. 2009;52:1648–1658. doi: 10.1021/jm801224t. [DOI] [PubMed] [Google Scholar]
- 18.Poduch E, Bello AM, Tang S, Fujihashi M, Pai EF, Kotra LP. Design of inhibitors of orotidine monophosphate decarboxylase using bioisosteric replacement and determination of inhibition kinetics. J Med Chem. 2006;49:4937–4945. doi: 10.1021/jm060202r. [DOI] [PubMed] [Google Scholar]
- 19.Torres FE, Kuhn P, De Bruyker D, Bell AG, Wolkin MV, Peeters E, Williamson JR, Anderson GB, Schmitz GP, Recht MI, Schweizer S, Scott LG, Ho JH, Elrod SA, Schultz PG, Lerner RA, Bruce RH. Enthalpy arrays. Proc Natl Acad Sci U S A. 2004;101:9517–9522. doi: 10.1073/pnas.0403573101. [DOI] [PMC free article] [PubMed] [Google Scholar]
- 20.Recht MI, Torres FE, De Bruyker D, Bell AG, Klumpp M, Bruce RH. Measurement of enzyme kinetics and inhibitor constants using enthalpy arrays. Anal Biochem. 2009;388:204–212. doi: 10.1016/j.ab.2009.02.028. [DOI] [PMC free article] [PubMed] [Google Scholar]
- 21.Houslay MD, Schafer P, Zhang KY. Keynote review: phosphodiesterase-4 as a therapeutic target. Drug Discov Today. 2005;10:1503–1519. doi: 10.1016/S1359-6446(05)03622-6. [DOI] [PubMed] [Google Scholar]
- 22.Wang H, Peng MS, Chen Y, Geng J, Robinson H, Houslay MD, Cai J, Ke H. Structures of the four subfamilies of phosphodiesterase-4 provide insight into the selectivity of their inhibitors. Biochem J. 2007;408:193–201. doi: 10.1042/BJ20070970. [DOI] [PMC free article] [PubMed] [Google Scholar]
- 23.O’Neil MJ, editor. The Merck index : an encyclopedia of chemicals, drugs, and biologicals. Whitehouse Station, N.J: Merck; 2006. [Google Scholar]
- 24.Greengard P, Rudolph SA, Sturtevant JM. Enthalpy of hydrolysis of the 3′ bond of adenosine 3′,5′-monophosphate and guanosine 3′,5′-monophosphate. J Biol Chem. 1969;244:4798–4800. [PubMed] [Google Scholar]
- 25.Doyle ML, Louie G, Dal Monte PR, Sokoloski TD. Tight binding affinities determined from thermodynamic linkage to protons by titration calorimetry. Methods Enzymol. 1995;259:183–194. doi: 10.1016/0076-6879(95)59044-7. [DOI] [PubMed] [Google Scholar]
- 26.Cha S. Kinetic behavior at high enzyme concentrations. Magnitude of errors of Michelis-Menten and other approximations. J Biol Chem. 1970;245:4814–4818. [PubMed] [Google Scholar]
- 27.Goldstein A. The Mechanism of Enzyme-Inhibitor-Substrate Reactions : Illustrated by the Cholinesterase-Physostigmine-Acetylcholine System. J Gen Physiol. 1944;27:529–580. doi: 10.1085/jgp.27.6.529. [DOI] [PMC free article] [PubMed] [Google Scholar]
- 28.Fersht A. Structure and mechanism in protein science : a guide to enzyme catalysis and protein folding. New York: W.H. Freeman; 1999. [Google Scholar]
- 29.Otwinowski Z, Minor W. Processing of X-ray diffraction data collected in oscillation mode. Methods Enzymol. 1997;276:307–326. doi: 10.1016/S0076-6879(97)76066-X. [DOI] [PubMed] [Google Scholar]
- 30.Collaborative Computational Project Number 4. The CCP4 suite: programs for protein crystallography. Acta Crystallogr D Biol Crystallogr. 1994;50:760–763. doi: 10.1107/S0907444994003112. [DOI] [PubMed] [Google Scholar]
- 31.McRee DE. Differential evolution for protein crystallographic optimizations. Acta crystallographica Section D, Biological crystallography. 2004;60:2276–2279. doi: 10.1107/S0907444904025491. [DOI] [PubMed] [Google Scholar]
- 32.Murshudov GN, Skubak P, Lebedev AA, Pannu NS, Steiner RA, Nicholls RA, Winn MD, Long F, Vagin AA. REFMAC5 for the refinement of macromolecular crystal structures. Acta crystallographica Section D, Biological crystallography. 2011;67:355–367. doi: 10.1107/S0907444911001314. [DOI] [PMC free article] [PubMed] [Google Scholar]
- 33.Rao FV, Andersen OA, Vora KA, Demartino JA, van Aalten DM. Methylxanthine drugs are chitinase inhibitors: investigation of inhibition and binding modes. Chem Biol. 2005;12:973–980. doi: 10.1016/j.chembiol.2005.07.009. [DOI] [PubMed] [Google Scholar]
- 34.Owens RJ, Catterall C, Batty D, Jappy J, Russell A, Smith B, O’Connell J, Perry MJ. Human phosphodiesterase 4A: characterization of full-length and truncated enzymes expressed in COS cells. Biochem J. 1997;326 (Pt 1):53–60. doi: 10.1042/bj3260053. [DOI] [PMC free article] [PubMed] [Google Scholar]
- 35.Huai Q, Colicelli J, Ke H. The crystal structure of AMP-bound PDE4 suggests a mechanism for phosphodiesterase catalysis. Biochemistry. 2003;42:13220–13226. doi: 10.1021/bi034653e. [DOI] [PubMed] [Google Scholar]
- 36.Huai Q, Liu Y, Francis SH, Corbin JD, Ke H. Crystal structures of phosphodiesterases 4 and 5 in complex with inhibitor 3-isobutyl-1-methylxanthine suggest a conformation determinant of inhibitor selectivity. J Biol Chem. 2004;279:13095–13101. doi: 10.1074/jbc.M311556200. [DOI] [PubMed] [Google Scholar]
- 37.Burgin AB, Magnusson OT, Singh J, Witte P, Staker BL, Bjornsson JM, Thorsteinsdottir M, Hrafnsdottir S, Hagen T, Kiselyov AS, Stewart LJ, Gurney ME. Design of phosphodiesterase 4D (PDE4D) allosteric modulators for enhancing cognition with improved safety. Nat Biotechnol. 2010;28:63–70. doi: 10.1038/nbt.1598. [DOI] [PubMed] [Google Scholar]
- 38.Card GL, England BP, Suzuki Y, Fong D, Powell B, Lee B, Luu C, Tabrizizad M, Gillette S, Ibrahim PN, Artis DR, Bollag G, Milburn MV, Kim SH, Schlessinger J, Zhang KY. Structural basis for the activity of drugs that inhibit phosphodiesterases. Structure. 2004;12:2233–2247. doi: 10.1016/j.str.2004.10.004. [DOI] [PubMed] [Google Scholar]
- 39.Pennington SN. 3′,5′-cyclic adenosine monophosphate phosphodiesterase assay using high speed liquid chromatography. Anal Chem. 1971;43:1701–1707. doi: 10.1021/ac60306a041. [DOI] [PubMed] [Google Scholar]
- 40.Liu S, Laliberte F, Bobechko B, Bartlett A, Lario P, Gorseth E, Van Hamme J, Gresser MJ, Huang Z. Dissecting the cofactor-dependent and independent bindings of PDE4 inhibitors. Biochemistry. 2001;40:10179–10186. doi: 10.1021/bi010096p. [DOI] [PubMed] [Google Scholar]
- 41.Xu RX, Hassell AM, Vanderwall D, Lambert MH, Holmes WD, Luther MA, Rocque WJ, Milburn MV, Zhao Y, Ke H, Nolte RT. Atomic structure of PDE4: insights into phosphodiesterase mechanism and specificity. Science. 2000;288:1822–1825. doi: 10.1126/science.288.5472.1822. [DOI] [PubMed] [Google Scholar]
- 42.Lunniss CJ, Cooper AW, Eldred CD, Kranz M, Lindvall M, Lucas FS, Neu M, Preston AG, Ranshaw LE, Redgrave AJ, Ed Robinson J, Shipley TJ, Solanke YE, Somers DO, Wiseman JO. Quinolines as a novel structural class of potent and selective PDE4 inhibitors: optimisation for oral administration. Bioorganic & medicinal chemistry letters. 2009;19:1380–1385. doi: 10.1016/j.bmcl.2009.01.045. [DOI] [PubMed] [Google Scholar]
Associated Data
This section collects any data citations, data availability statements, or supplementary materials included in this article.