

Abstract
Objective
To characterize and compare measurements of the posterior cingulate glucose metabolism, the hippocampal glucose metabolism, and hippocampal volume so as to distinguish cognitively normal, late-middle-aged persons with 2, 1, or 0 copies of the apolipoprotein E (APOE) ε4 allele, reflecting 3 levels of risk for late-onset Alzheimer disease.
Design
Cross-sectional comparison of measurements of cerebral glucose metabolism using 18F-fluorodeoxy-glucose positron emission tomography and measurements of brain volume using magnetic resonance imaging in cognitively normal ε4 homozygotes, ε4 heterozygotes, and noncarriers.
Setting
Academic medical center.
Participants
A total of 31 ε4 homozygotes, 42 ε4 heterozygotes, and 76 noncarriers, 49 to 67 years old, matched for sex, age, and educational level.
Main Outcome Measures
The measurements of posterior cingulate and hippocampal glucose metabolism were characterized using automated region-of-interest algorithms and normalized for whole-brain measurements. The hippocampal volume measurements were characterized using a semiautomated algorithm and normalized for total intracranial volume.
Results
Although there were no significant differences among the 3 groups of participants in their clinical ratings, neuropsychological test scores, hippocampal volumes (P=.60), or hippocampal glucose metabolism measurements (P = .12), there were significant group differences in their posterior cingulate glucose metabolism measurements (P=.001). The APOE ε4 gene dose was significantly associated with posterior cingulate glucose metabolism (r=0.29, P=.0003), and this association was significantly greater than those with hippocampal volume or hippocampal glucose metabolism (P<.05, determined by use of pairwise Fisher z tests).
Conclusions
Although our findings may depend in part on the analysis algorithms used, they suggest that a reduction in posterior cingulate glucose metabolism precedes a reduction in hippocampal volume or metabolism in cognitively normal persons at increased genetic risk for Alzheimer disease.
We and others have been using positron emission tomography (PET) measurements of the cerebral metabolic rate for glucose (CMRgl) in the posterior cingulate cortex and other brain regions that are known to be preferentially affected by Alzheimer disease (AD), magnetic resonance imaging (MRI) measurements of hippocampal and other brain tissue volumes, and other biomarker measurements to detect and track some of the brain changes that precede the clinical onset of AD.1–12 These findings have led our group and others to consider how these biomarkers could be used for people at increased risk for AD in the accelerated evaluation of presymptomatic AD treatments.8,12–14 They have also led researchers to propose models that characterize the trajectory of different biomarker changes associated with the pre-clinical stages of the disorder.15,16 For instance, 18F-fluorodeoxyglucose (FDG)–PET studies17–24 reveal characteristic and progressive CMRgl reductions in the posterior cingulate, precuneus, and parietal, temporal, and prefrontal brain regions beginning years before the clinical onset of AD. In other studies, we have reported evidence of CMRgl reductions in an automatically characterized hippocampal region of interest; these reductions were associated with apparent normal aging and predicted future cognitive decline.5 Magnetic resonance imaging studies reveal progressively reduced hippocampal volumes, which tend to parallel the earliest memory changes that herald the clinical onset of AD.25
The apolipoprotein E (APOE) ε4 allele is the major genetic risk factor for late-onset AD.26 Each additional ε4 allele in a person’s APOE genotype is associated with a greater risk of AD and a younger average age at clinical onset.26 We and others have found that cognitively normal, late-middle-aged and young adult APOE ε4 carriers exhibit CMRgl reductions in these AD-affected regions7–9,27,28 and that these reductions in late middle age are correlated with APOE ε4 gene dose (the number of ε4 alleles in a person’s APOE genotype, reflecting 3 levels of genetic risk for AD).10 In a preliminary study of cognitively normal, late-middle-aged ε4 homozygotes and noncarriers, we were able to detect CMRgl reductions in the posterior cingulate cortex and other brain regions preferentially affected by AD, prior to detectable evidence of hippocampal volumes; CMRgl reductions in the location with maximal posterior cingulate CMRgl reductions were still apparent after controlling for hippocampal volume differences, and smaller hippocampal volumes were associated with poorer long-term memory scores.25 Together, these and other findings led us to propose that posterior cingulate CMRgl reductions were apparent prior to hippocampal atrophy and that hippocampal atrophy may correspond to the earliest memory declines associated with the clinical onset of AD.25 In the present study, we sought to extend our previous findings to a much larger group of cognitively normal, late-middle-aged persons with 2 copies, 1 copy, and no copies of the APOE ε4 allele and to compare posterior cingulate CMRgl measurements, hippocampal CMRgl measurements, and hippocampal volumes in automatically selected regions of interest.
METHODS
PARTICIPANTS
Cognitively normal volunteers 47 to 68 years of age were recruited using newspaper advertisements and were enrolled into a longitudinal cohort study as previously described.7,10,29 Participants provided informed consent, agreed not to receive any information about their APOE genotype, and were studied under guidelines approved by the human subjects committees at Banner Good Samaritan Medical Center in Phoenix, Arizona, and the Mayo Clinic in Scottsdale, Arizona. Venous blood samples were obtained, and APOE genotypes were characterized with analysis by restriction fragment-length polymorphisms.30 APOE ε4 heterozygotes and noncarriers were individually matched to each APOE ε4 homozygotes for their sex, age (within 3 years), and educational level (within 2 years). Individuals who were enrolled reported a first-degree family history of probable AD and denied any cognitive symptoms. Additional inclusion criteria for participation consisted of a Folstein Mini-Mental State Examination score of at least 28, a Hamilton Depression Rating Scale score of less than 10, the absence of a current psychiatric disorder based on a structured psychiatric interview,31 and normal neurological examination results. Participants with a reported history of coronary artery disease, diabetes mellitus, or cerebrovascular accidents were excluded. Participants with clinically significant abnormalities, including but not limited to the presence of lacunar infarcts on their T1-weighted MRI scans, were also excluded. Note that, at the time these MRI scans were acquired, a complete clinical MRI examination, including T2-weighted images, was not performed; hence, the evaluation of more subtle evidence of cerebrovascular disease was not possible. For the present study, cross-sectional MRI and FDG-PET data from 160 participants were available for analysis. Data from 11 participants were excluded owing to technical MRI failures that resulted in the inability to segment the hippocampus. The remaining 149 participants included 31 APOE ε4 homozygotes, 42 ε4 heterozygotes, and 76 noncarriers, all 49 to 67 years of age.
BRAIN IMAGING
18F-fluorodeoxyglucose PET and volumetric T1-weighted MRI were performed as previously described.7,9,10,25,32 18F-fluorodeoxyglucose PET was performed with a 951/31 ECAT scanner (Siemens), a 20-minute transmission scan, the intravenous injection of 10 mCi of FDG, and a 60-minute dynamic sequence of emission scans as the participants, who had fasted for at least 4 hours, lay quietly in the darkened room with their eyes closed and directed forward. The PET images were reconstructed using the filtered back-projection with Hanning filter of 0.40 cycles per pixel and measured attenuation correction, resulting in 31 slices with an in-plane resolution of about 8.5 mm, full-width at half-maximum, an axial resolution of 5.0-to 7.1-mm full-width at half-maximum, a 3.375-slice thickness, and a 10.4-cm axial field of view. Magnetic resonance imaging was performed using a 1.5-T Signa system (General Electric) and a T1-weighted, 3-dimensional pulse sequence (radio-frequency–spoiled gradient recall acquisition in the steady state; repetition time, 33 ms; echo time, 5 ms; α =30°; number of excitations, 1; field of view, 24 cm; 256×192 imaging matrix; slice thickness, 1.5 mm; scan time, 13:36 minutes). The MRI data set consisted of 124 contiguous horizontal slices with an in-plane voxel dimension of 0.94 by 1.25 mm.
IMAGE ANALYSES
SPM99 (Wellcome Trust Centre for Neuroimaging; http://www.fil.ion.ucl.ac.uk/spm/) was used by investigators at the Banner Alzheimer’s Institute in Phoenix, Arizona, to linearly and nonlinearly deform (normalize) each participant’s PET image into the coordinates of a standard brain atlas. The Automated Anatomical Labeling toolbox33 was used to extract the PET data from the bilateral posterior cingulate. An automated algorithm developed at New York University was used by these investigators to characterize bilateral hippocampal regions of interest and extract CMRgl measurements from each person’s FDG-PET image.23,34 Posterior cingulate and hippocampal CMRgl measurements were normalized for the individual variation in whole-brain measurements using proportionate scaling. A semiautomated algorithm (Surface Navigator Technologies; Medtronic) was used by investigators at the University of California, San Francisco, to characterize bilateral hippocampal volumes (Medtronic Surgical Navigation Technologies) as previously described.35,36 Hippocampal volumes were normalized for the individual variation in total intracranial volumes37 using proportionate scaling.
A 1-way analysis of variance with a linear trend was used to examine the ability of posterior cingulate CMRgl measurements, hippocampal CMRgl measurements, and hippocampal volume measurements to distinguish among the 3 levels of risk for AD. Two-tailed t tests were subsequently performed to characterize and compare between-group measurements in the ε4 homozygotes, ε4 heterozygote, and noncarrier groups. An analysis of covariance with a linear trend was used to examine APOE ε4 dose effects on posterior cingulate and hippocampal CMRgl measurements, covarying for hippocampal volume. Using the Fisher z test, we directly compared the correlation coefficients relating APOE ε4 gene dose to posterior cingulate CMRgl, hippocampal CMRgl, and hippocampal volume.38 Lastly, the area under the curve of the receiver operating characteristic for the posterior cingulate CMRgl, hippocampal CMRgl, and hippocampal volume was computed using U statistics39 in order to characterize and compare the ability of the 3 measurements to distinguish among the 3 levels of genetic risk for AD.
RESULTS
The APOE ε4 homozygote, ε4 heterozygote, and non-carrier group characteristics are reported in Table 1. There were no significant differences in age, sex, educational levels, clinical ratings, or neuropsychological test scores.
Table 1.
Characteristics, Clinical Ratings, and Neuropsychological Test Scores of Participants
| Variable | Mean (SD)
|
P Valuea | ||
|---|---|---|---|---|
| Noncarriers (n = 76) | APOE 34 Heterozygotes (n = 42) | APOE 34 Homozygotes (n = 31) | ||
| Age, y | 56.5 (4.7) | 55.9 (4.0) | 55.5 (5.1) | .60 |
| Sex, No. | .90 | |||
| Male | 28 | 15 | 10 | |
| Female | 48 | 27 | 21 | |
| Education, y | 15.8 (1.5) | 15.3 (1.5) | 15.7 (1.4) | .17 |
| MMSE score | 29.8 (0.5) | 29.8 (0.4) | 29.8 (0.6) | .74 |
| AVLT score | ||||
| Total | 47.7 (8.0) | 48.1 (9.6) | 49.0 (10.2) | .81 |
| STM | 9.6 (2.5) | 10.1 (2.4) | 9.9 (3.3) | .51 |
| LTM | 8.9 (2.9) | 9.7 (2.9) | 9.5 (3.4) | .28 |
| Complex Figure test score | ||||
| Copy | 34.9 (1.6) | 34.1 (2.7) | 34.4 (1.9) | .09 |
| Recall | 18.7 (6.1) | 19.0 (6.3) | 17.1 (6.0) | .37 |
| Boston Naming Test score | 57.1 (3.1) | 56.8 (3.0) | 56.6 (3.5) | .80 |
| WAIS-R score | ||||
| Information | 12.0 (2.2) | 12.3 (2.1) | 11.3 (2.1) | .20 |
| Digit span | 11.3 (2.1) | 11.8 (3.0) | 11.1 (2.8) | .47 |
| Block design | 11.9 (2.6) | 12.2 (2.6) | 11.7 (2.6) | .78 |
| Arithmetic | 12 (2.4) | 12.4 (2.2) | 11.1 (2.8) | .09 |
| Similarities | 12.4 (2.2) | 12.5 (2.0) | 11.6 (1.9) | .18 |
| COWAT score | 44.0 (11.2) | 44.3 (11.5) | 48.3 (10.4) | .18 |
| WMS-R orientation score | 13.8 (0.5) | 13.9 (0.3) | 13.8 (0.4) | .41 |
Abbreviations: AVLT, Auditory Verbal Learning Test; COWAT, Controlled Oral Word Association Test; LTM, long-term memory; MMSE, Mini-Mental State Examination; STM, short-term memory; WAIS-R, Wechsler Adult Intelligence Scale–Revised; WMS-R, Wechsler Memory Scale–Revised.
Significance at α = .05.
Brain imaging measurements are reported in Table 2 and in our Figure. The 3 groups of participants differed from each other in posterior cingulate CMRgl measurements (analysis of variance: P = .001; pairwise comparisons: P < .05) but not in bilateral hippocampal CMRgl measurements (analysis of variance: P = .12) or left, right, or bilateral hippocampal volume measurements (analysis of variance: P = .23, .89, and .60, respectively). The posterior cingulate and hippocampal CMRgl findings remained unchanged after controlling for hippocampal volumes (analysis of covariance: P = .002 and .11, respectively).
Figure.
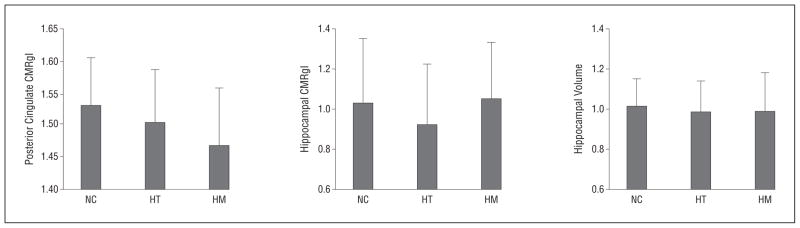
Cerebral metabolic rate for glucose (CMRgl) in the posterior cingulate and the hippocampus, determined using positron emission tomography, and hippocampal volume, determined using magnetic resonance imaging, in APOE ε4 homozygotes (HM), heterozygotes (HT), and noncarriers (NC). The CMRgl measurements are normalized to whole-brain measurement, whereas the hippocampal volumes are normalized for the variation in total intracranial volume. There is a significant decrease only with posterior cingulate CMRgl from noncarriers to homozygotes of the APOE ε4 allele (analysis of variance: P = .001; linear trend: P = .0003). Error bars indicate standard deviation.
Supporting the between-group differences, the APOE ε4 gene dose was more closely correlated with posterior cingulate hypometabolism (r = 0.29, P = .0003) than with hippocampal hypometabolism or hippocampal volumes (r = 0.07 and 0.013, respectively, determined using pairwise Fisher z tests; P < .05). Indeed, posterior cingulate CMRgl measurements were significantly better than hippocampal CMRgl or hippocampal volume measurements in distinguishing between the ε4 homozygote and noncarrier groups (area under the receiver operating characteristic curve: 0.71, 0.52, and 0.54, respectively, using pairwise comparisons: P = .04), whereas the hippocampal CMRgl and hippocampal volume measurements did not differ significantly in their ability to distinguish between the groups of participants.
A quadratic model was used post hoc to further explore the relationship between APOE ε4 gene dose and each of the imaging measurements following the exploratory finding of lower mean hippocampal CMRgl measurements in the APOE ε4 heterozygotes than in ε4 homozygotes or noncarriers (Table 2). Although the finding of a significant quadratic relationship between APOE ε4 gene dose and baseline measurements of hippocampal CMRgl (P = .04) may or may not be consistent with greater hippocampal activation in functional MRI studies of cognitively normal older adult APOE ε4 carriers during learning and memory tasks,40 this observation must be considered exploratory. We failed to detect a significant difference between carriers and noncarriers using either hippocampal CMRgl (P = .30) or hippocampal volume (P = .32).
Table 2.
Imaging Measurements
| Measurement | Mean (SD)
|
P Value
|
|||
|---|---|---|---|---|---|
| Noncarriers (n = 76) | APOEε34 Heterozygotes (n = 42) | APOE 34 Homozygotes (n = 31) | ANOVA | Linear Trend | |
| Hippocampal volume determined by MRI | |||||
| Left | 0.519 (0.070) | 0.498 (0.069) | 0.496 (0.099) | .23 | .11 |
| Right | 0.494 (0.075) | 0.486 (0.094) | 0.495 (0.100) | .89 | .97 |
| Total | 1.012 (0.137) | 0.985 (0.156) | 0.991 (0.191) | .60 | .41 |
| CMRgl determined by PET | |||||
| Posterior cingulate | 1.53 (0.07) | 1.51 (0.08) | 1.47 (0.09) | .001 | .0003 |
| Hippocampus | 1.03 (0.32) | 0.92 (0.30) | 1.05 (0.28) | .12 | .88 |
Abbreviations: ANOVA, analysis of variance; CMRgl, cerebral metabolic rate for glucose; MRI, magnetic resonance imaging; PET, positron emission tomography.
COMMENT
Our study directly compared posterior cingulate CMRgl, hippocampal CMRgl, and hippocampal volume measurements using preselected, automatically or semiautomatically generated regions of interest in a large number of well-matched, late-middle-aged, cognitively normal persons at 3 levels of genetic risk for AD. As expected, a higher APOE ε4 gene dose was associated with a lower posterior cingulate CMRgl. These findings were apparent in the absence of detectable hippocampal CMRgl or hippocampal volume differences. Together, these findings confirm and extend our observation that posterior cingulate CMRgl reductions can be detected before hippocampal CMRgl or hippocampal volume alterations in the pre-clinical stages of late-onset AD, and they support similar findings in early-onset AD-causing mutation carriers.41
As previously noted, posterior cingulate CMRgl reductions could reflect a reduction in the density activity or metabolism of terminal neuronal fields or perisynaptic astroglial cells7; as previously shown, these reductions are unlikely to reflect the combined effects of brain atrophy and partial-volume averaging.9,10 Posterior cingulate hypometabolism was also found in young adult carriers several decades before possible dementia9; indeed, young adult carriers who died were found to have reduced cytochrome oxidase activity, even before they showed evidence of soluble or fibrillar amyloid-β pathology.42
In comparison with our previous report,25 the present study compared FDG and volumetric MRI measurements in a much larger number of research participants and compared measurements in persons at 3 levels of genetic risk for AD. It compared posterior cingulate and hippocampal measurements in automatically or semiautomatically generated regions of interest, free from the inflated type I error associated with multiple regional comparisons in our previous FDG-PET analysis. It included the additional comparison of hippocampal CMRgl measurements, which had been implicated in the early detection and tracking of AD, and found that the posterior cingulate measurements were more sensitive to detecting this preclinical stage of the disorder. We previously demonstrated reduced posterior cingulate CMRgl measurements in cognitively normal young adult APOE ε4 heterozygotes, more than 4 decades before their estimated age at clinical onset.9 Based on other comparisons,8,9,43 we found that the reduction in the posterior cingulate CMRgl does not progress between young adulthood and late middle age but that it anticipates progressive CMRgl declines, with some of the earliest fibrillar Aβ deposition starting in late-middle-aged ε4 carriers.
Additional analyses will be needed to compare CMRgl measurements with regional gray matter volume or cortical thickness measurements using other voxel-based or region-of-interest–based methods because the sensitivity to detect a change using any biomarker method may be at least partly related to technical factors, such as the data analysis technique used, and not solely attributable to the underlying biological process. Although we found that the posterior cingulate CMRgl was more sensitive than the hippocampal CMRgl or the hippocampal volume in its ability to discriminate among cognitively normal, late-middle-aged persons at 3 levels of genetic risk for AD, the differential sensitivity could be related to actual differences in the underlying processes, the image acquisition, the region of interest, the analysis techniques used, or a combination of these factors. It is possible that future technical developments could further improve the sensitivity of these biomarker measurements for the preclinical detection of AD.
Additional analyses will also be needed to compare CMRgl measurements with fibrillar amyloid-β measurements using PET; we have acquired these measurements in a smaller number of participants. As we have stated in the past, these and other biomarker measurements are not yet recommended to predict a cognitively normal person’s clinical course or his or her response to suggested but unproven risk-reducing treatments. Additional studies are needed to characterize and compare the trajectory of these and other biomarker changes during the preclinical stages of AD16,44 because these bio-marker changes continue to set the stage for the accelerated evaluation of presymptomatic AD treatments.13
Acknowledgments
Funding/Support: This work was supported by the National Institute of Mental Health (grant R01MH57899 to Dr Reiman), the National Institute on Aging (grants R01AG031581 and P30AG19610 to Dr Reiman and grant R01AG025526 to Dr Alexander), the state of Arizona (to Drs Chen, Alexander, Caselli, and Reiman), and contributions from the Banner Alzheimer’s Foundation and the Mayo Clinic Foundation.
Footnotes
Online-Only Material: Listen to an author interview about this article, and others, at http://bit.ly/MT7xg4.
Additional Contributions: We thank Patti Aguilar, Christine Burns, MA, Sandra Goodwin, Bruce Henslin, BBA, Candy Monarrez, Anita Prouty, BS, Cole Reschke, BS, Nicole Richter, BS, and Sandra Yee-Benedetto, MHA, for their assistance.
Author Contributions: Study concept and design: Chen, Langbaum, Fleisher, Caselli, and Reiman. Acquisition of data: Bandy, Mosconi, Buckley, Schuff, Weiner, Caselli, and Reiman. Analysis and interpretation of data: Protas, Chen, Fleisher, Alexander, Lee, de Leon, Truran-Sacrey, Caselli, and Reiman. Drafting of the manuscript: Protas, Chen, Fleisher, and Reiman. Critical revision of the manuscript for important intellectual content: Protas, Chen, Langbaum, Fleisher, Alexander, Lee, Bandy, de Leon, Mosconi, Buckley, Truran-Sacrey, Schuff, Weiner, Caselli, and Reiman. Statistical analysis: Protas, Chen, Alexander, Schuff, and Reiman. Obtained funding: Weiner and Reiman. Administrative, technical, and material support: Bandy, Mosconi, Buckley, Truran-Sacrey, Weiner, Caselli, and Reiman. Study supervision: Fleisher, Truran-Sacrey, Schuff, Weiner, and Reiman.
Conflict of Interest Disclosures: Dr Mosconi has a patent on a technology that was licensed to Abiant Inc by New York University and, as such, has a financial interest in this license agreement and holds stock and stock options in the company. Dr Mosconi has also received compensation for consulting services from Abiant Inc. Dr Weiner reported that he was on the scientific advisory boards of Lilly, Araclon, Institut Catala de Neurociencies Aplicades, Gulf War Veterans Advisory Committee, and Biogen Idec in 2010 and Pfizer in 2011; that he consulted for AstraZeneca, Araclon, Medivation/Pfizer, Ipsen, TauRx Therapeutics, Bayer HealthCare, Biogen Idec, ExonHit Therapeutics, Servier, and Synarc in 2010 and Pfizer and Janssen in 2011; that he received funding for travel from NeuroVigil, CHRU Hôpital Roger Salengro, Siemens, AstraZeneca, Geneva University Hospitals, Lilly, University of California, San Diego–Alzheimer’s Disease Neuroimaging Initiative (ADNI), Paris University, Institut Catala de Neurociencies Aplicades, University of New Mexico School of Medicine, Ipsen, and Clinical Trials on Alzhimer’s Disease in 2010 and Pfizer, The Alzheimer’s & Parkinson’s Conference, Paul Sabatier University, Novartis, and Tohoku University in 2011; that he was on the editorial advisory board of Alzheimer’s Disease & Dementia and Magnetic Resonance Imaging; that he received honoraria from NeuroVigil and Institut Catala de Neurociencies Aplicades in 2010 and Pharmaceuticals and Medical Devices Agency/Japanese Ministry of Health, Labour, and Welfare and Tohoku University in 2011; that he received commercial entities research support from Merck and Avid; that he received government entities research support from the US Department of Defense and the Department of Veterans Affairs; and that he has stock options in Synarc and Elan. The organizations contributing to the foundation for the National Institutes of Health, and thus to the National Institute on Aging–funded ADNI, are Abbott, the Alzheimer’s Association, the Alzheimer’s Drug Discovery Foundation, the Anonymous Foundation, AstraZeneca, Bayer HealthCare, BioClinica (ADNI 2), Bristol-Myers Squibb, the Cure Alzheimer’s Fund, Eisai, Elan, Gene Network Sciences, Genentech, GE Healthcare, GlaxoSmithKline, Innogenetics, Johnson & Johnson, Lilly, Medpace, Merck, Novartis, Pfizer, Roche, Schering Plough, Synarc, and Wyeth.
References
- 1.de Leon MJ, George AE, Stylopoulos LA, Smith G, Miller DC. Early marker for Alzheimer’s disease: the atrophic hippocampus. Lancet. 1989;2(8664):672–673. doi: 10.1016/s0140-6736(89)90911-2. [DOI] [PubMed] [Google Scholar]
- 2.den Heijer T, Oudkerk M, Launer LJ, van Duijn CM, Hofman A, Breteler MM. Hippocampal, amygdalar, and global brain atrophy in different apolipoprotein E genotypes. Neurology. 2002;59(5):746–748. doi: 10.1212/wnl.59.5.746. [DOI] [PubMed] [Google Scholar]
- 3.Jak AJ, Houston WS, Nagel BJ, Corey-Bloom J, Bondi MW. Differential cross-sectional and longitudinal impact of APOE genotype on hippocampal volumes in nondemented older adults. Dement Geriatr Cogn Disord. 2007;23(6):382–389. doi: 10.1159/000101340. [DOI] [PMC free article] [PubMed] [Google Scholar]
- 4.Mosconi L, Nacmias B, Sorbi S, et al. Brain metabolic decreases related to the dose of the ApoE e4 allele in Alzheimer’s disease. J Neurol Neurosurg Psychiatry. 2004;75(3):370–376. doi: 10.1136/jnnp.2003.014993. [DOI] [PMC free article] [PubMed] [Google Scholar]
- 5.Mosconi L, De Santi S, Li J, et al. Hippocampal hypometabolism predicts cognitive decline from normal aging. Neurobiol Aging. 2008;29(5):676–692. doi: 10.1016/j.neurobiolaging.2006.12.008. [DOI] [PMC free article] [PubMed] [Google Scholar]
- 6.Mosconi L, Mistur R, Switalski R, et al. FDG-PET changes in brain glucose metabolism from normal cognition to pathologically verified Alzheimer’s disease. Eur J Nucl Med Mol Imaging. 2009;36(5):811–822. doi: 10.1007/s00259-008-1039-z. [DOI] [PMC free article] [PubMed] [Google Scholar]
- 7.Reiman EM, Caselli RJ, Yun LS, et al. Preclinical evidence of Alzheimer’s disease in persons homozygous for the epsilon 4 allele for apolipoprotein E. N Engl J Med. 1996;334(12):752–758. doi: 10.1056/NEJM199603213341202. [DOI] [PubMed] [Google Scholar]
- 8.Reiman EM, Caselli RJ, Chen K, Alexander GE, Bandy D, Frost J. Declining brain activity in cognitively normal apolipoprotein E epsilon 4 heterozygotes: a foundation for using positron emission tomography to efficiently test treatments to prevent Alzheimer’s disease. Proc Natl Acad Sci U S A. 2001;98(6):3334–3339. doi: 10.1073/pnas.061509598. [DOI] [PMC free article] [PubMed] [Google Scholar]
- 9.Reiman EM, Chen K, Alexander GE, et al. Functional brain abnormalities in young adults at genetic risk for late-onset Alzheimer’s dementia. Proc Natl Acad Sci U S A. 2004;101(1):284–289. doi: 10.1073/pnas.2635903100. [DOI] [PMC free article] [PubMed] [Google Scholar]
- 10.Reiman EM, Chen K, Alexander GE, et al. Correlations between apolipoprotein E epsilon4 gene dose and brain-imaging measurements of regional hypometabolism. Proc Natl Acad Sci U S A. 2005;102(23):8299–8302. doi: 10.1073/pnas.0500579102. [DOI] [PMC free article] [PubMed] [Google Scholar]
- 11.Reiman EM, Caselli RJ, Alexander GE, Chen K. Tracking the decline in cerebral glucose metabolism in persons and laboratory animals at genetic risk for Alzheimer’s disease. Clin Neurosci Res. 2001;1:194–206. doi: 10.1016/S1566-2772(01)00006-8. [DOI] [Google Scholar]
- 12.Reiman E, Langbaum J. Brain imaging in the evaluation of putative Alzheimer’s disease slowing, risk-reducing and prevention therapies. In: Jagust W, D’Esposito M, editors. Imaging the Aging Brain. New York, NY: Oxford University Press; 2009. pp. 319–350. [Google Scholar]
- 13.Reiman EM, Langbaum JB, Tariot PN. Alzheimer’s prevention initiative: a proposal to evaluate presymptomatic treatments as quickly as possible. Biomark Med. 2010;4(1):3–14. doi: 10.2217/bmm.09.91. [DOI] [PMC free article] [PubMed] [Google Scholar]
- 14.Reiman EM, Langbaum JB, Fleisher AS, et al. Alzheimer’s Prevention Initiative: a plan to accelerate the evaluation of presymptomatic treatments. J Alzheimers Dis. 2011;26(suppl 3):321–329. doi: 10.3233/JAD-2011-0059. [DOI] [PMC free article] [PubMed] [Google Scholar]
- 15.Jack CR, Jr, Knopman DS, Jagust WJ, et al. Hypothetical model of dynamic bio-markers of the Alzheimer’s pathological cascade. Lancet Neurol. 2010;9(1):119–128. doi: 10.1016/S1474-4422(09)70299-6. [DOI] [PMC free article] [PubMed] [Google Scholar]
- 16.Sperling RA, Aisen PS, Beckett LA, et al. Toward defining the preclinical stages of Alzheimer’s disease: recommendations from the National Institute on Aging-Alzheimer’s Association workgroups on diagnostic guidelines for Alzheimer’s disease. Alzheimers Dement. 2011;7(3):280–292. doi: 10.1016/j.jalz.2011.03.003. [DOI] [PMC free article] [PubMed] [Google Scholar]
- 17.Alexander GE, Chen K, Pietrini P, Rapoport SI, Reiman EM. Longitudinal PET evaluation of cerebral metabolic decline in dementia: a potential outcome measure in Alzheimer’s disease treatment studies. Am J Psychiatry. 2002;159(5):738–745. doi: 10.1176/appi.ajp.159.5.738. [DOI] [PubMed] [Google Scholar]
- 18.Chase TN, Foster NL, Fedio P, Brooks R, Mansi L, Di Chiro G. Regional cortical dysfunction in Alzheimer’s disease as determined by positron emission tomography. Ann Neurol. 1984;15(suppl):S170–S174. doi: 10.1002/ana.410150732. [DOI] [PubMed] [Google Scholar]
- 19.Foster NL, Chase TN, Mansi L, et al. Cortical abnormalities in Alzheimer’s disease. Ann Neurol. 1984;16(6):649–654. doi: 10.1002/ana.410160605. [DOI] [PubMed] [Google Scholar]
- 20.Jagust WJ, Friedland RP, Budinger TF, Koss E, Ober B. Longitudinal studies of regional cerebral metabolism in Alzheimer’s disease. Neurology. 1988;38(6):909–912. doi: 10.1212/wnl.38.6.909. [DOI] [PubMed] [Google Scholar]
- 21.Langbaum JB, Chen K, Lee W, et al. Alzheimer’s Disease Neuroimaging Initiative. Categorical and correlational analyses of baseline fluorodeoxyglucose positron emission tomography images from the Alzheimer’s Disease Neuroimaging Initiative (ADNI) Neuroimage. 2009;45(4):1107–1116. doi: 10.1016/j.neuroimage.2008.12.072. [DOI] [PMC free article] [PubMed] [Google Scholar]
- 22.Minoshima S, Frey KA, Koeppe RA, Foster NL, Kuhl DE. A diagnostic approach in Alzheimer’s disease using three-dimensional stereotactic surface projections of fluorine-18-FDG PET. J Nucl Med. 1995;36(7):1238–1248. [PubMed] [Google Scholar]
- 23.Mosconi L, Tsui WH, Herholz K, et al. Multicenter standardized 18F-FDG PET diagnosis of mild cognitive impairment, Alzheimer’s disease, and other dementias. J Nucl Med. 2008;49(3):390–398. doi: 10.2967/jnumed.107.045385. [DOI] [PMC free article] [PubMed] [Google Scholar]
- 24.Silverman DH, Small GW, Chang CY, et al. Positron emission tomography in evaluation of dementia: regional brain metabolism and long-term outcome. JAMA. 2001;286(17):2120–2127. doi: 10.1001/jama.286.17.2120. [DOI] [PubMed] [Google Scholar]
- 25.Reiman EM, Uecker A, Caselli RJ, et al. Hippocampal volumes in cognitively normal persons at genetic risk for Alzheimer’s disease. Ann Neurol. 1998;44(2):288–291. doi: 10.1002/ana.410440226. [DOI] [PubMed] [Google Scholar]
- 26.Corder EH, Saunders AM, Strittmatter WJ, et al. Gene dose of apolipoprotein E type 4 allele and the risk of Alzheimer’s disease in late onset families. Science. 1993;261(5123):921–923. doi: 10.1126/science.8346443. [DOI] [PubMed] [Google Scholar]
- 27.Rimajova M, Lenzo NP, Wu JS, et al. Fluoro-2-deoxy-D-glucose (FDG)-PET in APOEepsilon4 carriers in the Australian population. J Alzheimers Dis. 2008;13(2):137–146. doi: 10.3233/jad-2008-13203. [DOI] [PubMed] [Google Scholar]
- 28.Small GW, Mazziotta JC, Collins MT, et al. Apolipoprotein E type 4 allele and cerebral glucose metabolism in relatives at risk for familial Alzheimer disease. JAMA. 1995;273(12):942–947. [PubMed] [Google Scholar]
- 29.Caselli RJ, Dueck AC, Osborne D, et al. Longitudinal modeling of age-related memory decline and the APOE epsilon4 effect. N Engl J Med. 2009;361(3):255–263. doi: 10.1056/NEJMoa0809437. [DOI] [PMC free article] [PubMed] [Google Scholar]
- 30.Hixson JE, Vernier DT. Restriction isotyping of human apolipoprotein E by gene amplification and cleavage with HhaI. J Lipid Res. 1990;31(3):545–548. [PubMed] [Google Scholar]
- 31.Spitzer R, Williams J, Gibbon M, First M. User’s Guide for the Structured Clinical Interview for DSM-III-R (SCID) Washington, DC: American Psychiatric Publishing; 1990. [Google Scholar]
- 32.Chen K, Reiman EM, Huan Z, et al. Linking functional and structural brain images with multivariate network analyses: a novel application of the partial least square method. Neuroimage. 2009;47(2):602–610. doi: 10.1016/j.neuroimage.2009.04.053. [DOI] [PMC free article] [PubMed] [Google Scholar]
- 33.Tzourio-Mazoyer N, Landeau B, Papathanassiou D, et al. Automated anatomical labeling of activations in SPM using a macroscopic anatomical parcellation of the MNI MRI single-subject brain. Neuroimage. 2002;15(1):273–289. doi: 10.1006/nimg.2001.0978. [DOI] [PubMed] [Google Scholar]
- 34.Mosconi L, Tsui WH, De Santi S, et al. Reduced hippocampal metabolism in MCI and AD: automated FDG-PET image analysis. Neurology. 2005;64(11):1860–1867. doi: 10.1212/01.WNL.0000163856.13524.08. [DOI] [PubMed] [Google Scholar]
- 35.Hsu YY, Schuff N, Du AT, et al. Comparison of automated and manual MRI volumetry of hippocampus in normal aging and dementia. J Magn Reson Imaging. 2002;16(3):305–310. doi: 10.1002/jmri.10163. [DOI] [PMC free article] [PubMed] [Google Scholar]
- 36.Schuff N, Woerner N, Boreta L, et al. Alzheimer’s Disease Neuroimaging Initiative. MRI of hippocampal volume loss in early Alzheimer’s disease in relation to ApoE genotype and biomarkers. Brain. 2009;132(pt 4):1067–1077. doi: 10.1093/brain/awp007. [DOI] [PMC free article] [PubMed] [Google Scholar]
- 37.Devanand DP, Pradhaban G, Liu X, et al. Hippocampal and entorhinal atrophy in mild cognitive impairment: prediction of Alzheimer disease. Neurology. 2007;68(11):828–836. doi: 10.1212/01.wnl.0000256697.20968.d7. [DOI] [PubMed] [Google Scholar]
- 38.Meng XL, Rosenthal R, Rubin DB. Comparing correlated correlation coefficients. Psychol Bull. 1992;111(1):172–175. doi: 10.1037/0033-2909.111.1.172. [DOI] [Google Scholar]
- 39.DeLong ER, DeLong DM, Clarke-Pearson DL. Comparing the areas under two or more correlated receiver operating characteristic curves: a nonparametric approach. Biometrics. 1988;44(3):837–845. [PubMed] [Google Scholar]
- 40.Bookheimer SY, Strojwas MH, Cohen MS, et al. Patterns of brain activation in people at risk for Alzheimer’s disease. N Engl J Med. 2000;343(7):450–456. doi: 10.1056/NEJM200008173430701. [DOI] [PMC free article] [PubMed] [Google Scholar]
- 41.Mosconi L, Sorbi S, de Leon MJ, et al. Hypometabolism exceeds atrophy in pre-symptomatic early-onset familial Alzheimer’s disease. J Nucl Med. 2006;47 (11):1778–1786. [PubMed] [Google Scholar]
- 42.Valla J, Yaari R, Wolf AB, et al. Reduced posterior cingulate mitochondrial activity in expired young adult carriers of the APOE ε4 allele, the major late-onset Alzheimer’s susceptibility gene. J Alzheimers Dis. 2010;22(1):307–313. doi: 10.3233/JAD-2010-100129. [DOI] [PMC free article] [PubMed] [Google Scholar]
- 43.Reiman EM, Chen K, Liu X, et al. Fibrillar amyloid-beta burden in cognitively normal people at 3 levels of genetic risk for Alzheimer’s disease. Proc Natl Acad Sci U S A. 2009;106(16):6820–6825. doi: 10.1073/pnas.0900345106. [DOI] [PMC free article] [PubMed] [Google Scholar]
- 44.Jack CR, Jr, Petersen RC, Xu YC, et al. Hippocampal atrophy and apolipoprotein E genotype are independently associated with Alzheimer’s disease. Ann Neurol. 1998;43(3):303–310. doi: 10.1002/ana.410430307. [DOI] [PMC free article] [PubMed] [Google Scholar]