

Abstract
The CREB/CRE transcriptional pathway has been implicated in circadian clock timing and light-evoked clock resetting. To date, much of the work on CREB in circadian physiology has focused on how changes in the phosphorylation state of CREB regulate the timing processes. However, beyond changes in phosphorylation, CREB-dependent transcription can also be regulated by the CREB coactivator CRTC (CREB-regulated transcription coactivator), also known as TORC (transducer of regulated CREB). Here we profiled both the rhythmic and light-evoked regulation of CRTC1 and CRTC2 in the murine suprachiasmatic nucleus (SCN), the locus of the master mammalian clock. Immunohistochemical analysis revealed rhythmic expression of CRTC1 in the SCN. CRTC1 expression was detected throughout the dorsoventral extent of the SCN in the middle of the subjective day, with limited expression during early night, and late night expression levels intermediate between mid-day and early night levels. In contrast to CRTC1, robust expression of CRTC2 was detected during both the subjective day and night. During early and late subjective night, a brief light pulse induced strong nuclear accumulation of CRTC1 in the SCN. In contrast with CRTC1, photic stimulation did not affect the subcellular localization of CRTC2 in the SCN. Additionally, reporter gene profiling and chromatin immunoprecipitation analysis indicated that CRTC1 was associated with CREB in the 5′ regulatory region of the period1 gene, and that overexpression of CRTC1 leads to a marked upregulation in period1 transcription. Together, these data raise the prospect that CRTC1 plays a role in fundamental aspects of SCN clock timing and entrainment.
Introduction
Virtually every aspect of mammalian biology is sculpted by an inherent circadian (24 h) timing system. Central to clock timing is the suprachiasmatic nucleus (SCN), a relatively small nucleus within the ventral hypothalamus that functions as the master circadian clock (Dibner et al., 2010; Welsh et al., 2010). Recent work has revealed fundamental features of the “core” clock transcription feedback loop that are central to the timing process, as well as ancillary cellular signaling and transcriptional loops that regulate the phasing and amplitude of the core molecular clock. Likewise, the basic cellular signaling program that couples light to clock entrainment has been dissected over the past several years. Interestingly, the CREB/CRE transcriptional pathway has been shown to play a role as both a regulator of SCN core molecular clock timing and as a signaling intermediate that couples light to the clock. Given that the phosphorylation of CREB at Ser-133 is a central event driving activation of CRE-mediated transcription, a good deal of work has focused on how photic input and clock timing regulate Ser-133 phosphorylation. However, work going back almost 20 years has clearly shown that Ser-133 phosphorylation does not always correlate with the induction of CRE-mediated gene expression and that other phosphorylation events also regulate the transactivation potential of CREB (Brindle et al., 1995). Additionally, recent work has revealed that CREB-mediated transcription can be stimulated through the actions of the CRTC (CREB-regulated transcription coactivator) family of CREB cofactors (Takemori et al., 2007; Altarejos and Montminy, 2011). CRTCs bind to the C-terminal b-zip domain of CREB via a mechanism that is independent of Ser-133 phosphorylation. Upon an increase in intracellular calcium or cAMP, CRTCs are dephosphorylated via a calcineurin-dependent mechanism, thus leading to their rapid translocation to the nucleus, where they homo-tetamerize on CREB and, in turn, facilitate CREB-mediated transcription (Screaton et al., 2004; Altarejos and Montminy, 2011). These observations coupled with work showing that CRTCs play a critical role in a range of processes in the CNS (Zhou et al., 2006; Kovacs et al., 2007; Li et al., 2009) raised the prospect that CRTCs could contribute to SCN clock physiology.
Materials and Methods
Animals and brain tissue processing.
Six- to 8-week-old C57BL/6 mice (both male and female, equally distributed across experimental groups) were entrained to a 12 h light/dark cycle (4 weeks) and transferred to continuous darkness for 2 d before white light treatment (40 lux, 5 min) at CT6, CT15, or CT22. Control animals (no light exposure) were handled in a manner consistent with that of the light-treated mice. Immediately after photic stimulation, mice were killed and processed for immunolabeling and Western analysis using the methods described previously (Cao et al., 2008). Ventricular microinfusion of FK506 (100 mm) and cyclosporine (5 mm) diluted in DMSO (2 μl) was performed using the techniques described previously (Cao et al. (2008)). All procedures involving live animals were in accordance with Ohio State University animal welfare guidelines and approved by the Institutional Animal Care and Use Committee.
Immunohistochemical labeling and quantitation.
Free-floating sections were processed using Vectastain Elite ABC labeling method (Vector Laboratories) per the manufacturer's instructions. The following antibodies were used: CRTC1 (1:25,000; #2587; Cell Signaling Technology) and CRTC2 (1:500, #12497-1-AP; Proteintech Group). Immunoreactivity was visualized via the nickel-intensified DAB substrate (Vector Laboratories). SCN images (10×) were captured and analyzed (via MetaMorph software) for CRTC1 and CRTC2 expression using single-cell counting and densitometric analysis. For the single-cell counting, an “exclusive” threshold was applied to the image and a “count cells” application was applied to an area inclusive of a traced region that outlined each SCN. Based on our criteria, the software identified clusters of cells (regions of interest with an area 1.7 × larger than a single SCN neuronal nucleus (∼8 μm). Based on the size of the cluster, the software then generated a cell number/cluster. This method was applied to all images, and values (number of cells/SCN) were averaged from two central SCN sections per animal. Analysis of significant differences between two groups was made using the Student's t test.
For densitometric analysis (see Fig. 1C), we used the ratiometric quantitation method described previously (Cao et al., 2008, their section on p4E-BP1) to compare CRTC levels in the SCN to the adjacent lateral hypothalamus. Of note, CRTC expression did not oscillate in the lateral hypothalamus. Data were presented as the mean ± SEM. Significant differences were assessed via one-way ANOVA analysis followed by the Bonferroni multiple-comparison test. p < 0.05 was accepted as statistically significant.
Figure 1.
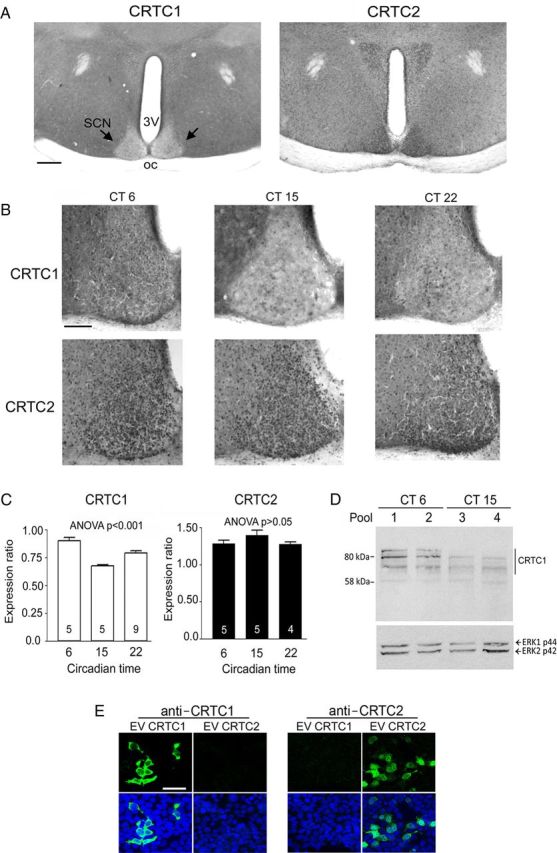
CRTC1 and CRTC2 expression in the SCN. A, Representative low-magnification images (4×) provide a general overview of CRTC1 and CRTC2 expression in the SCN at CT15. Scale bar, 250 μm. 3V, Third ventricle; OC, optic chiasm. B, Representative higher-magnification (10×) images of CRTC1 and CRTC2 in the SCN. A clear time-of-day variation in CRTC1 was detected, with higher labeling detected during the subjective day (CT6) than either subjective night time point. In contrast, CRTC2 expression did not vary as a function of circadian time. Scale bar, 100 μm. C, Densitometric analysis of CRTC1 and CRTC2 expression in the SCN as a function of circadian time. Numbers in the bars indicate the number of mice examined. D, Western analysis of CRTC1 expression at CT6 and CT15. There is relative difference in expression between the two time points. ERK 1 and ERK 2 expression was profiled as a loading control. E, HEK293 cells were transfected with CRTC1 or CRTC2 expression vectors (EV) and then immunolabelied with the CRTC1 and CRTC2 antibodies. There is specificity of the immunolabeling; nuclei were visualized via DraQ5 (blue). Scale bar, 50 μm.
Immunofluorescence labeling.
Briefly, for CRTC1 and cellular nuclei labeling, tissue was incubated with the noted CRTC1 antibody (1:5000) and either an anti-neuronal nuclear antigen (NeuN) antibody (1:500, Millipore Bioscience Research Reagents) or with the DNA stain DRAQ5 (1:3000; Biostatus Limited). AlexaFluor secondary antibodies were used to visualize the signal. To double-label for CRTC1 and pCREB, the noted CRTC1 primary and secondary antibody labeling approach was used. Tissue was then incubated (3 h at room temperature) with an AlexaFluor-488 conjugate antibody against pCREB (1:500, #9187; Cell Signaling Technology). Control experiments did not detect cross-reactivity between CRTC1 and pCREB labeling. Images were captured with a Zeiss 510 confocal microscope.
Western blotting.
For analysis of CRTC1, SCN tissue were pooled from 3 mice per replicate and lysed in 100 μl RIPA buffer. A total of 5 μg of protein/lane was processed via Western analysis and detection using methods described previously (Cao et al., 2008). Membranes were incubated with the noted CRTC1 antibody (1:25,000) and with a goat polyclonal anti-ERK antibody (1:1000; Santa Cruz Biotechnology). HEK293 cells were probed for CRTC1 and β-actin (1:6000, MAB1501; Millipore Bioscience Research Reagents).
Period 1 genomic organization.
As part of the ENCODE project, CREB chromatin immunoprecipitation (ChIP) Seq datasets were generated in the laboratory of Dr. Richard M. Myers at the HudsonAlpha Institute for Biotechnology. A detailed description of the experimental and computational methods can be found at http://genome.ucsc.edu/cgi-bin/hgTables?db=hg19&hgta_group=regulation&hgta_track=wgEncodeHaibTfbs&hgta_table=wgEncodeHaibTfbsA549Creb1sc240V0416102Dex100nmRawRep1&hgta_doSchema=describe+table+schema.
Datasets were loaded into the UCSC genome browser (http://www.genome.ucsc.edu/) and analyzed within the context of the human period1 gene locus.
Transgene analysis.
A total of 2 × 10⁵ of HEK293 cells/well were transfected for 24 h with 0.8 μg total of per1-promoter-luciferase construct plus pCDNA3 empty vector or pCDNA3-flag-CRTC1 plasmid (provided by Dr. Marc Montminy) using the Lipofectamine 2000 reagent (Invitrogen), and luciferase activity was examined using lysis and reporter gene kits (#E153A, #E151A; Promega). Reporter gene expression was normalized to total protein concentration (Protein Assay Kit, #500-0006; Bio-Rad). For PER1 expression analysis, HEK293 cells were transfected as described, and labeled with anti-Period1 (1:50 provided by Dr. Steven Reppert) and anti-Flag (1:1000; Santa Cruz Biotechnology) antibodies. Quantitation of Period1 expression in CRTC1-expressing was performed on a cell-by-cell basis using ImageJ. The CRTC2-Flag expression vector was provided by Dr. Yang Zhou (Shanghai Institutes for Biological Sciences).
ChIP.
HEK293 cells (total, 3.5 × 10⁶) were subjected to chromatin cross-linking with 1% paraformaldehyde (room temperature, 10 min) and washed twice in ice-cold PBS. Cells were collected, washed again, and resuspended in lysis buffer and then sonicated. Lysate was immunoprecipitated overnight at 4°C with 5 μl CRTC1 antibody or control rabbit IgG (#2729; Cell Signaling Technology). Precipitated DNA was profiled using the SYBR Green PCR Master Mix (#4309155; Applied Biosystems). PCR primer sets are as follows: per1 CRE2 F, 5′-GTAACCAGGCCCTGCTGCCG-3′; per1 CRE2 R, 5′-CCTGCCCCACATTCCGAGGC-3′; GAPDH F, 5′-ACAAACCCCAAAATGACTATCCT-3′; GAPDH R, 5′-GCCTGGAGAAACCTGTATGTATG-3′. For Western analysis, lysates were run on an SDS-PAGE gel and probed for CRTC1 as described above.
Results
To begin our analysis of CRTCs in the SCN, mice were killed at 3 circadian time (CT) points, the middle of the subjective day (CT6), early subjective night (CT15), and the late subjective night (CT22), and brain sections were immunolabeled for the expression of CRTC1 and CRTC2. Analysis of CRTC1 labeling revealed a marked time-of-day-specific expression in the SCN (Fig. 1). Along these lines, at CT6, CRTC1 expression was clearly visible throughout the SCN, from the ventral-most region to the dorsal apex. In contrast, a limited number of CRTC1-immunoreactive cells were detected within the central and dorsal regions of the SCN at CT15 (Fig. 1A,B). Of additional interest, at CT15, CRTC1 expression within the SCN was lower than the expression in the surrounding hypothalamic regions, providing a clear neuroanatomical outline of the SCN (Fig. 1A,B). At CT22, CRTC1 expression was detected in a small subset of SCN cells (Fig. 1B). Both densitometric analysis (Fig. 1C) and single-cell counting (Fig. 2C) revealed a statistically significant variation in CRTC1 immunoreactivity as a function of the time of day. Paralleling the immunohistochemistry, Western analysis revealed a higher level of CRTC1 expression during the subjective day (CT6) than the subjective night (CT15: Fig. 1D). We detected a number of bands, which is consistent with work by other groups (e.g., Canettieri et al., 2009) and is the likely result of CRTC1 splice variants and varied phosphorylation states. In contrast to CRTC1, robust CRTC2 expression was detected within the SCN at all three circadian time points, and quantitative analysis did not detect a significant variation in the expression as a function of clock time (Fig. 1C; see Fig. 3D). The lack of cross-reactivity for the CRTC1 and CRTC2 antibodies was validated in Figure 1E. Together, these data indicate that CRTC1 is under the control of the circadian clock within the SCN, whereas CRTC2 is apparently not affected by the time of day.
Figure 2.

Light-evoked nuclear CRTC1 localization in the SCN. A, Representative CRTC1 expression in the SCN under control conditions (no light) and 5 min after light exposure (40 lux). B, High-magnification images of the CT15 dataset from A. There is marked cellular labeling within the central SCN after light treatment. C, Quantitative analysis of CRTC1 expression in the SCN. D, To assess whether light triggered a nuclear accumulation of CRTC1, SCN tissue from the CT15 time point was immunofluorescently labeled for CRTC1 (red) and DraQ5 (green). Individual and merged 2-μm-thick confocal planes, accompanied by orthogonal 20-μm z-stack renderings are presented. Arrows indicate CRTC1-expressing nuclei. E, Representative images showing that FK506 and cyclosporine A infusion disrupts CRTC1 nuclear accumulation after a 5 min light pulse.
Figure 3.

CRTC expression and light regulation in the SCN. A, Double labeling for CRTC1 and NeuN in the central SCN 5 min after light exposure. There is neuronal-enriched expression of nuclear CRTC1 (arrows). Arrowheads indicate neurons without nuclear localization of CRTC1. Scale bar, 10 μm. B, Light-evoked colocalization of CRTC1 and pCREB in the SCN. Merging the two fluorescent channels revealed that a subset of cells express both pCREB and CRTC1. Arrowheads indicate colocalized pCREB and CRTC1 expression; arrows indicate cellular nuclei that only express pCREB. Scale bar, 30 μm. C, Representative images reveal marked CRTC2 expression at each time point. Light treatment (40 lux, 5 min) had no clear effect on CRTC2 expression or subcellular immunoreactivity at any of the circadian time points. D, Quantitative analysis of CRTC2 expression in the SCN.
Next, we examined whether CRTCs are regulated by photic input. Mice received a brief light pulse (5 min, 40 lux) at the noted mid-subjective day and early and late subjective night time points. The use of a brief light pulse protocol was based on work showing that light triggers rapid (within 7 min) (Albrecht et al., 1997) induction of gene expression after a light pulse; hence, if CRTCs contribute to this first wave of inducible gene expression, nuclear accumulation must occur within a relatively short time period. Analysis of CRTC1 revealed a robust increase in immunopositive cells during both the early and late night time points (Fig. 2A–C). High-magnification imaging revealed that much of the increased immunoreactivity was localized to the central SCN (Fig. 2B). In contrast to the effects of light exposure during the night time points, exposure of dark-adapted mice to light at CT6 did not increase CRTC1 immunoreactivity (Fig. 2A–C). These data indicate that light regulation of CRTC1 is phase-restricted to the night time domain.
Given the short time course of the light-pulse paradigm (5 min), we postulated that the increase in CRTC1 immunoreactivity does not result from an increase in the CRTC1 gene transcription and/or mRNA translation but rather results from the nuclear accumulation of CRTC1. Hence, light would trigger the redistribution of a diffuse cytoplasmic CRTC1 signal into concentrated nuclear signal that would be more readily detected using immunolabeling methods. To address the nuclear accumulation of CRTC1, we profiled CRTC1 expression via confocal analysis. These data detected limited nuclear CRTC1 expression under control conditions (no light). However, after light treatment, CRTC1 expression was colocalized with the nuclear/DNA stain DraQ5 in a subset of the cells (Fig. 2D). Consistent with this, under the same light treatment condition, CRTC1 was colocalized with the NeuN (Fig. 3A). These data suggest that photic stimulation triggers the rapid nuclear accumulation of CRTC1 in the SCN. To further test this idea, we examined whether calcineurin (the upstream regulator of CRTC1 translocation) inhibition would affect the labeling for CRTC1. For this experiment, mice were infused with the calcineurin inhibitors FK506 and cyclosporine A 15 min before the noted 5 min light treatment. Representative data (Fig. 2E) revealed that inhibition of calcineurin activity potently reduced light-evoked CRTC1 labeling in the SCN, thus suggesting that the robust light-evoked CRTC1 signal results from its nuclear accumulation.
With respect to clock entrainment, light exposure during the night time-domain has been shown to trigger the rapid phosphorylation of CREB at Ser-133 (pCREB), an event required for CREB to couple to CBP and, in turn, drive CRE-dependent gene expression. Given that the translocation of CRTC1 to the nucleus could provide another route by which light stimulates activation of CREB-mediated gene expression, we examined the spatial and temporal correlation between CRTC1 nuclear translocation and pCREB. To study this relationship, SCN tissue from control (no light) and light-treated (40 lux, 5 min) mice was double-labeled for CRTC1 and pCREB. Representative confocal images reveal that a subset of light-responsive, pCREB-positive, cells exhibited a marked increase in nuclear CRTC1 (Fig. 3B). Together, these data indicate that a subset of retinoreceptor SCN neurons exhibit two routes to CREB activation: Ser-133 phosphorylation and the nuclear translocation of CRTC1.
We then tested whether photic input influences CRTC2 expression and/or cellular localization. For these experiments, the same light pulse paradigm used to stimulate CRTC1 nuclear accumulation was used. However, unlike CRTC1, no significant change in the number of CRTC2-positive cells was detected at any of the circadian time points tested (Fig. 3C,D). These data indicate striking differences in CRTC1 and CRTC2 regulation within the SCN.
Next, we addressed whether CRTC1 could affect molecular clock timing. These studies were focused on the inducible expression of the core clock gene period1. Interest in Period1 is based on work showing that the period1 promoter contains several CRE binding sites and that both light-inducible expression and the amplitude of rhythmic period1 expression are modulated by the CREB/CRE pathway (O'Neill et al., 2008; Lee et al., 2010). Of note, whole-genome analysis via ChIP Seq identified CREB occupancy at two CRE motifs within the period1 5′ regulatory region (Fig. 4A). To further analyze molecular mechanisms of period1 regulation, HEK 293 cells were transfected with a period1-luciferase construct and either an empty expression vector or a CRTC1 expression vector. CRTC1 expression led to an ∼7-fold increase in period1-luciferase expression, relative to empty vector controls (Fig. 4B). Western analysis confirmed that the transfection led to a marked overexpression of CRTC1 (Fig. 4C). Notably, CRTC1 overexpression also led to an increase in the expression of the endogenous Period1 protein in HEK 293 cells (Fig. 4D).
Figure 4.

CRTC1 regulates period1 expression. A, UCSC genome browser diagram depicting the gene structure of the human period1 gene, CREB occupation, and the phylogenetic conservation of this region. B, HEK293 cells were transfected with a period1-promoter-luciferase construct and either pCDNA3 empty vector plasmid DNA or pCDNA3-flag-CRTC1 plasmid DNA and subjected to luciferase assay. Luciferase activity was normalized to total protein concentration on a well-by-well basis, and data are presented as fold activity, relative to pCDNA3 empty vector samples, which was set to a value of 1.0. Data are presented as mean ± SEM from quadruplicate determinations. C, The expression of flag-CRTC1 in transfected HEK293 cells was confirmed via Western blotting; β-actin serves as the control. D, HEK293 cells were transfected as in B, and endogenous Period1 immunolabeling was quantitated. Numbers in the bars indicate the number of cells examined. EV, Expression vector. E, Left, ChIP assay for CRTC1 binding at the CRE2 site (shown in A) within the period1 5′ regulatory region was normalized to a control pull-down using IgG, which was set to a value of 1. Data are mean ± SEM and were averaged from a triplicate determination. Right, To confirm successful CRTC1 pull-down, immunoprecipitates from control (rabbit IgG) and CRTC1 antibody pull-downs were Western-blotted for CRTC1. Notably, an ∼75 kDa band (consistent with the weight of CRTC1) was detected from the CRTC1 immunoprecipitate. Input (0.5 μg of lysates) was used to confirm the molecular weight of CRTC1.
To complement the reporter and endogenous gene profiling, we used ChIP-based PCR profiling to determine whether CRTC1 is associated with CREB within the period1 promoter. Chromatin from HEK293 cells was immunoprecipitated with a CRTC1 antibody or control IgG, and the relative level of bound chromatin was quantitated via PCR analysis. PCR analysis of CRE site 2 (CRE2) within the period1 promoter (Fig. 4E) detected an approximately threefold enrichment in bound CRTC1. Figure 4E also provides Western blot-based validation of the CRTC1 pull-down. Together, these data indicate that the core clock gene period1 is a direct target of the CRTC1/CREB transcriptional pathway.
Discussion
A major finding of this work is that CRTC1 expression varied as a function of clock time. Hence, expression was highest during the day and reached a nadir during the early subjective night. Interestingly, a number of studies have shown that Ser-133 and Ser-142 phosphorylation of CREB is also rhythmically regulated within the SCN (Obrietan et al., 1999; Gau et al., 2002). Likewise, CRE-mediated gene expression also exhibits a rhythm (Obrietan et al., 1999; O'Neill et al., 2008), with a peak occurring during the subjective day. Here it is important to note that CRTC1 rhythmicity may not result from changes in mRNA expression but rather could result from time-of-day differences in mRNA stability, localization, and/or protein degradation; additional studies are in progress. Together, these data hint at the possibility that the rhythmic regulation of CRTC1 contributes to the circadian regulation of CRE-mediated gene expression in the SCN.
The light-evoked increase in CRTC1 nuclear accumulation likely results from increased levels of intracellular calcium and cAMP. Along these lines, in response to photic stimulation, there is a well-characterized release of both glutamate and PACAP from retino-hypothalamic nerve terminals, two transmitters that drive a robust increase in both calcium levels and cAMP. Hence, photic stimulation actuates a set of signaling events that would be predicted to trigger CRTC1 translocation. Here, it is worth noting that both cAMP levels and intracellular calcium levels oscillate within the SCN (Prosser and Gillette, 1991; Ikeda et al., 2003). Thus, both photic and clock-gated changes in cAMP and calcium levels could regulate the level of nuclear CRTC1.
In contrast with CRTC1, CRTC2 expression did not appear to be under the influence of either the clock or photic input. Rather, robust SCN-wide expression of CRTC2 was detected at all three circadian time points. This observation raises some interesting questions regarding the differential regulation and functional effects of CRTC1 and CRTC2. From a functional standpoint, the simplest explanation for the distinct expression patterns and inducible regulation of CRTC1 and CRTC2 is that the two isoforms have some degree of nonredundant functionality in the SCN. To our knowledge, limited work has been performed to mechanistically dissect whether CRTC1 and CRTC2 differentially regulate CREB-mediated transcription. However, it is worth noting that CRTC1 and CRTC2 differentially regulate AP1-dependent transcription (Canettieri et al., 2009).
Interestingly, a subset of SCN neurons that exhibited light-induced CREB phosphorylation also exhibited robust nuclear localization of CRTC1. These data indicate that signaling via CRTC1 likely represents a second route to CREB activation in retino-responsive cells. Could CRCT1 activation/nuclear accumulation represent a redundant transcriptional control process to the one actuated by CREB phosphorylation, or might it function as a distinctive regulator of CRE-mediated gene expression? Of note, in contrast to Ser-133 phosphorylation-dependent transcription, CRTCs are capable of stimulating CREB-mediated gene expression independent of CBP/p300 recruitment (Kasper et al., 2010). Hence, in some promoter contexts, one could envision CRE-mediated gene expression driven specifically by the recruitment of CRTCs to the CREB/CRE complex. Further, it is also worth noting that CRTCs have been found to stimulate transcription via association with bZIP transcription factors other than CREB, including c-Jun, c-Fos, and ATF6α (Canettieri et al., 2009; Wang et al., 2009). Hence, CRTCs likely function as both regulators of CREB-dependent and -independent gene expression programs in the SCN. Clearly, a good amount of additional work will be required to elucidate the functional roles of CRTCs in SCN clock timing and entrainment.
Footnotes
This work was supported by the National Institute of Health Grants MH62335 and NS067409.
The authors declare no competing financial interests.
References
- Albrecht U, Sun ZS, Eichele G, Lee CC. A differential response of two putative mammalian circadian regulators, mper1 and mper2, to light. Cell. 1997;91:1055–1064. doi: 10.1016/S0092-8674(00)80495-X. [DOI] [PubMed] [Google Scholar]
- Altarejos JY, Montminy M. CREB and the CRTC co-activators: sensors for hormonal and metabolic signals. Nat Rev Mol Cell Biol. 2011;12:141–151. doi: 10.1038/nrm3072. [DOI] [PMC free article] [PubMed] [Google Scholar]
- Brindle P, Nakajima T, Montminy M. Multiple protein kinase A-regulated events are required for transcriptional induction by cAMP. Proc Natl Acad Sci U S A. 1995;92:10521–10525. doi: 10.1073/pnas.92.23.10521. [DOI] [PMC free article] [PubMed] [Google Scholar]
- Canettieri G, Coni S, Della Guardia M, Nocerino V, Antonucci L, Di Magno L, Screaton R, Screpanti I, Giannini G, Gulino A. The coactivator CRTC1 promotes cell proliferation and transformation via AP-1. Proc Natl Acad Sci U S A. 2009;106:1445–1450. doi: 10.1073/pnas.0808749106. [DOI] [PMC free article] [PubMed] [Google Scholar]
- Cao R, Lee B, Cho HY, Saklayen S, Obrietan K. Photic regulation of the mTOR signaling pathway in the suprachiasmatic circadian clock. Mol Cell Neurosci. 2008;38:312–324. doi: 10.1016/j.mcn.2008.03.005. [DOI] [PMC free article] [PubMed] [Google Scholar]
- Dibner C, Schibler U, Albrecht U. The mammalian circadian timing system: organization and coordination of central and peripheral clocks. Annu Rev Physiol. 2010;72:517–549. doi: 10.1146/annurev-physiol-021909-135821. [DOI] [PubMed] [Google Scholar]
- Gau D, Lemberger T, von Gall C, Kretz O, Le Minh N, Gass P, Schmid W, Schibler U, Korf HW, Schütz G. Phosphorylation of CREB Ser142 regulates light-induced phase shifts of the circadian clock. Neuron. 2002;34:245–253. doi: 10.1016/S0896-6273(02)00656-6. [DOI] [PubMed] [Google Scholar]
- Ikeda M, Sugiyama T, Wallace CS, Gompf HS, Yoshioka T, Miyawaki A, Allen CN. Circadian dynamics of cytosolic and nuclear Ca2+ in single suprachiasmatic nucleus neurons. Neuron. 2003;38:253–263. doi: 10.1016/S0896-6273(03)00164-8. [DOI] [PubMed] [Google Scholar]
- Kasper LH, Lerach S, Wang J, Wu S, Jeevan T, Brindle PK. CBP/p300 double null cells reveal effect of coactivator level and diversity on CREB transactivation. EMBO J. 2010;29:3660–3672. doi: 10.1038/emboj.2010.235. [DOI] [PMC free article] [PubMed] [Google Scholar]
- Kovács KA, Steullet P, Steinmann M, Do KQ, Magistretti PJ, Halfon O, Cardinaux JR. TORC1 is a calcium- and cAMP-sensitive coincidence detector involved in hippocampal long-term synaptic plasticity. Proc Natl Acad Sci U S A. 2007;104:4700–4705. doi: 10.1073/pnas.0607524104. [DOI] [PMC free article] [PubMed] [Google Scholar]
- Lee B, Li A, Hansen KF, Cao R, Yoon JH, Obrietan K. CREB influences timing and entrainment of the SCN circadian clock. J Biol Rhythms. 2010;25:410–420. doi: 10.1177/0748730410381229. [DOI] [PMC free article] [PubMed] [Google Scholar]
- Li S, Zhang C, Takemori H, Zhou Y, Xiong ZQ. TORC1 regulates activity-dependent CREB-target gene transcription and dendritic growth of developing cortical neurons. J Neurosci. 2009;29:2334–2343. doi: 10.1523/JNEUROSCI.2296-08.2009. [DOI] [PMC free article] [PubMed] [Google Scholar]
- Obrietan K, Impey S, Smith D, Athos J, Storm DR. Circadian regulation of cAMP response element-mediated gene expression in the suprachiasmatic nuclei. J Biol Chem. 1999;274:17748–17756. doi: 10.1074/jbc.274.25.17748. [DOI] [PubMed] [Google Scholar]
- O'Neill JS, Maywood ES, Chesham JE, Takahashi JS, Hastings MH. cAMP-dependent signaling as a core component of the mammalian circadian pacemaker. Science. 2008;320:949–953. doi: 10.1126/science.1152506. [DOI] [PMC free article] [PubMed] [Google Scholar]
- Prosser RA, Gillette MU. Cyclic changes in cAMP concentration and phosphodiesterase activity in a mammalian circadian clock studied in vitro. Brain Res. 1991;568:185–192. doi: 10.1016/0006-8993(91)91396-I. [DOI] [PubMed] [Google Scholar]
- Screaton RA, Conkright MD, Katoh Y, Best JL, Canettieri G, Jeffries S, Guzman E, Niessen S, Yates JR, 3rd, Takemori H, Okamoto M, Montminy M. The CREB coactivator TORC2 functions as a calcium- and cAMP-sensitive coincidence detector. Cell. 2004;119:61–74. doi: 10.1016/j.cell.2004.09.015. [DOI] [PubMed] [Google Scholar]
- Takemori H, Kajimura J, Okamoto M. TORC-SIK cascade regulates CREB activity through the basic leucine zipper domain. FEBS J. 2007;274:3202–3209. doi: 10.1111/j.1742-4658.2007.05889.x. [DOI] [PubMed] [Google Scholar]
- Wang Y, Vera L, Fischer WH, Montminy M. The CREB coactivator CRTC2 links hepatic ER stress and fasting gluconeogenesis. Nature. 2009;460:534–537. doi: 10.1038/nature08111. [DOI] [PMC free article] [PubMed] [Google Scholar]
- Welsh DK, Takahashi JS, Kay SA. Suprachiasmatic nucleus: cell autonomy and network properties. Annu Rev Physiol. 2010;72:551–577. doi: 10.1146/annurev-physiol-021909-135919. [DOI] [PMC free article] [PubMed] [Google Scholar]
- Zhou Y, Wu H, Li S, Chen Q, Cheng XW, Zheng J, Takemori H, Xiong ZQ. Requirement of TORC1 for late-phase long-term potentiation in the hippocampus. PLoS One. 2006;1:e16. doi: 10.1371/journal.pone.0000016. [DOI] [PMC free article] [PubMed] [Google Scholar]