Abstract
Objective:
To investigate the influence of bowtie filtration on dedicated cone beam CT (CBCT) of the head and neck.
Methods:
A validated hybrid simulation technique was used to model a commercial CBCT system with offset scanning geometry, 90 kV tube potential and 145×75 mm imaging field of view. Three bowtie filters were formulated to produce uniform flux intensity in the projection image of cylindrical objects of diameter 14, 16 and 18 cm. The influence of these simulated filters was compared with the original flat filtration in terms of the output radiation field, the dose delivered to the object, the scatter distribution in projections and the quality of the reconstructed image.
Results:
Compared against flat filtration, dose reduction for the bowtie case, examined as a function of radial distance within a 16-cm-diameter water cylinder, varied from 8.7% at the centre to 53.8% at the periphery. Scatter reduction, quantified using scatter-to-primary ratio in projection images, was up to 37.6% for a 14-cm-diameter cylindrical contrast phantom. Using the supplied routine image reconstruction, bowtie filtration resulted in comparable noise appearance, contrast resolution and artefact pattern for computational anatomical phantoms, with <5% difference in contrast-to-noise ratio.
Conclusion:
Bowtie filtration can effectively reduce the dose and scatter in CBCT of the head and neck. For better image quality, corresponding modification to the image pre-processing and reconstruction is needed.
Advances in knowledge:
The hybrid simulation approach can usefully explore the impact of proposed system component and design changes.
Bowtie filters are widely applied in current mutislice CT and cone beam CT (CBCT) to modulate the output of the radiation source [1–5]. The term “bowtie” applies to a class of filter shapes featuring bilateral symmetry with a thickness that increases with the distance from the centre. Bowtie filters compensate for the difference in beam path length through the axial plane of the object such that a more uniform fluence can be delivered to the detector. Owing to this effect, they lower the risk of signal overflow in peripheral detector elements, thus relaxing the requirement on the dynamic range of the detector and allowing better contrast detectability [6]. The use of bowtie filters is known to give a reduction in the radiation dose at the periphery of the imaging field of view (FOV) [1,3]. They have also been found effective in reducing scatter, a major cause of image artefacts [1,3,4]. Furthermore, they have the potential to flatten the scatter distribution, which is beneficial for post-processing scatter correction strategies [7]. Usually, the thickness of a bowtie filter is variable within the axial plane but stays constant over the third dimension that corresponds to the longitudinal FOV. The large CBCT units for use in image-guided radiotherapy often have different bowtie filters switchable between different exposure settings.
Although the benefits have been well recognised, bowtie filters may not be so useful for systems with a relatively small FOV. In dedicated CBCT of the head and neck, where the FOVs are typically <20 cm in diameter, flat filtration is commonly applied [8]. The advantages and disadvantages of bowtie filtration for such systems have not been explored. It therefore remains an open question whether the findings regarding bowtie filters in large CBCT systems are still valid, and, if so, what improvements in terms of dose and scatter management can be achieved.
The filters applied on dedicated head and neck CBCT systems are fixed and incorporated within the source assembly, which makes it difficult to assess the effects of different filtration by practical measurement. Computer simulation methods offer a more convenient approach, allowing exploration of parameters for a given imaging system beyond its nominal design [4,7,9]. In a previous paper, we reported a hybrid technique to simulate the complete imaging chain of CBCT [10]. The current paper describes an application of the technique with the objective of modelling a dedicated head and neck CBCT system with only flat filtration, designing and optimising bowtie filters under a given set of presumptions and assessing the resulting system performance. We chose to investigate the Scanora 3D CBCT system (Soredex, PaloDEx Group, Finland).
METHODS AND MATERIALS
In this section, we first introduce the Scanora 3D system and review the outline of the hybrid simulation technique. Next, the simulation model established with the original flat filtration is described, with a focus on measures taken to cope with the so-called “offset” scanning geometry. Then, we propose an approach to design and optimise bowtie filters. Phantoms to be used for evaluation of the system performance are presented last.
Scanora 3D cone beam CT system
The Scanora 3D applies an offset scanning technique, which is implemented nowadays as a solution to the growing demand of large FOVs on the one hand and the cost-prohibitive flat panel detectors on the other hand [4,11]. It allows the CBCT system to reconstruct an FOV of some nominal volume using a detector of roughly half the size compared with that in a symmetrical set-up. Specifically, the source and the detector rotate in paired circular trajectories while the flat panel detector is offset with respect to the rotation axis, such that the peripheral region of the FOV is imaged by projections in only half of the rotation, namely 180° plus the fan angle, while a small region around the centre of the FOV is covered by all projections. Because of this highly asymmetrical set-up, the projections are also called “half projections”. To avoid ambiguity, the “central beam” mentioned in this text is the one that runs perpendicular from the focal spot to the detector plane. The “inner side” of the half projection refers specifically to the side near the centre of the FOV and the “outer side”, in contrast, is the side corresponding to the periphery of the FOV.
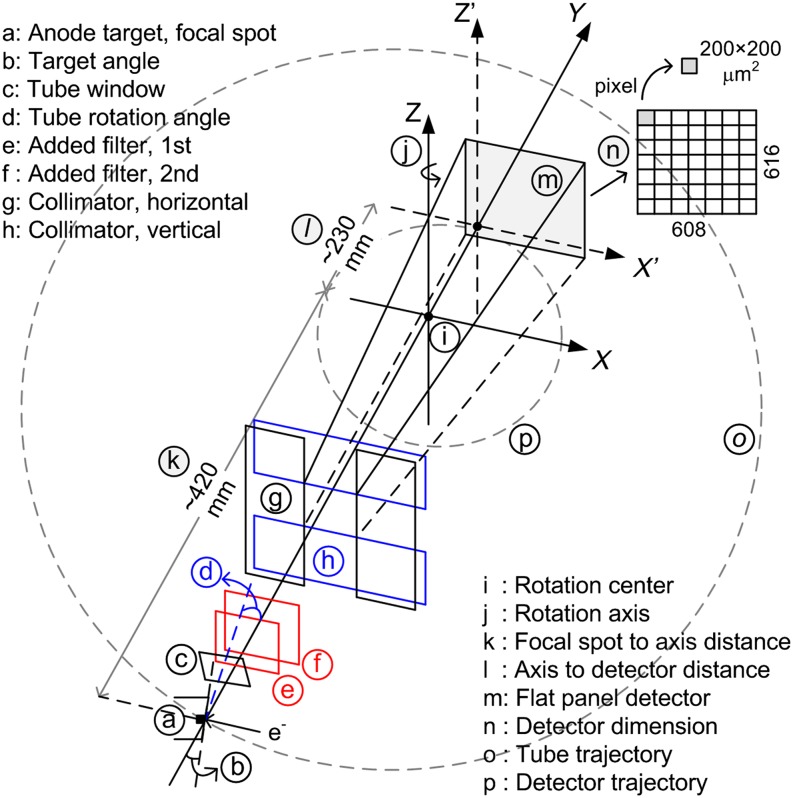
Figure 1 shows the image acquisition geometry of the Scanora system. The tube is placed in a direction such that the anode to cathode axis lies orthogonal to the longitudinal FOV. The flat panel detector is the Hamamatsu C10900D (Hamamatsu Photonics®, Hamamatsu City, Japan), with a 608×616 array of 200×200 μm2 pixels. It is offset in the cathode direction, leaving an overlap of ∼5 mm for half-projections at opposite angles. The tube is rotated upwards about the anode to cathode axis by a small angle. Accordingly, the lower bound of the radiation field is slightly below the tube trajectory plane. Two filters are placed in the beam path, each made of a 0.1 mm flat copper sheet. The system operates under a fixed tube potential of 90 kV while the tube current can be adjusted in a range from 4.0 mA to 12.5 mA. The largest FOV is 145×75 mm, denoted as width×height, which utilises the entire effective area of the detector and was the focus of our investigation. The paired source–detector movement follows a step-and-shoot (pulsed) pattern, with the half projections distributed evenly over 360°. Under the standard operation mode, the large FOV is associated with 225 half projections, an effective exposure time of 2.25 s and an isotropic voxel resolution of 350 µm in the reconstructed image. The system also supports a high-resolution mode and a panoramic imaging program, which, however, were not considered in this study.
Figure 1.
Image acquisition geometry of the Scanora 3D cone beam CT system.
Hybrid simulation technique
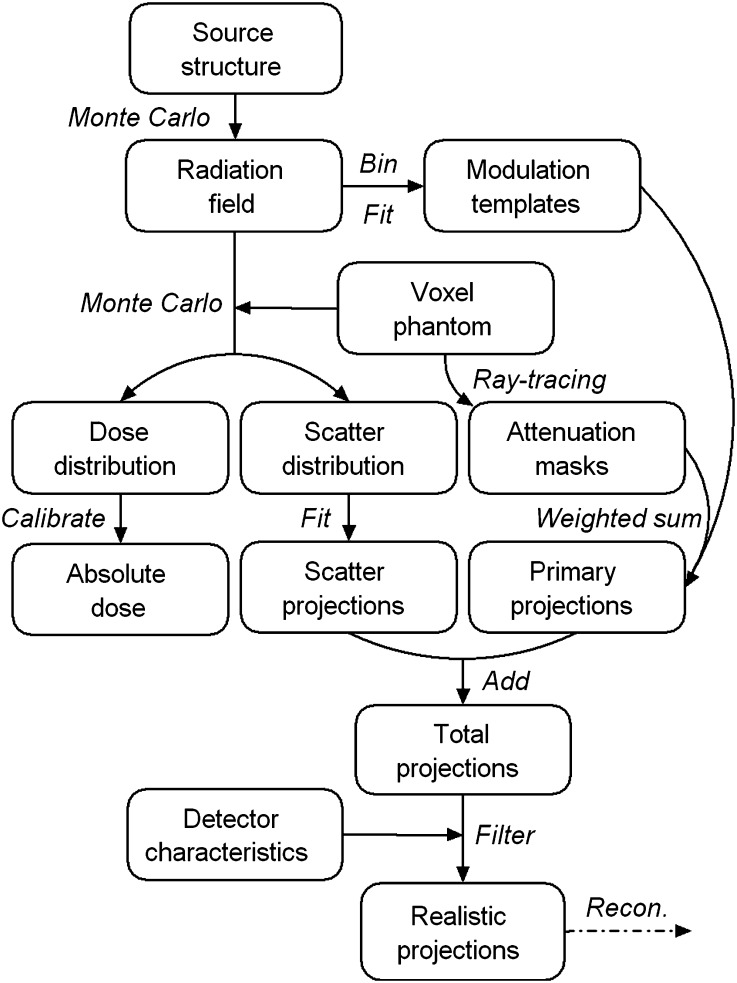
The simulation technique accounts for the complete imaging chain of a CBCT system via a hybrid approach [10]. The model starts with the X-ray generation, filtration and collimation, delivers a cone beam radiation field, continues with angular projections through a three-dimensional (3D) voxel phantom, calculates the dose distributions in pre-defined regions of interest, produces primary and scatter images separately, applies the measured resolution and noise characteristics of the flat panel detector, follows the image pre-processing procedures and results in a sequence of two-dimensional (2D) projection data ready for volumetric reconstruction. The flowchart of the simulation is presented in Figure 2. This technique is hybrid: it includes both dose- and image-related aspects of the imaging process, splitting the system structure into source, projection and detector, combining deterministic and stochastic methods, making use of the measured detector characteristics as well as different acceleration and variance reduction techniques. The BEAMnrc/EGSnrc code system was employed for the Monte Carlo part [12,13]. The so-called “phase space” was used to keep track of the beam dataflow in the source simulation model and represent the resulting radiation field. The measured resolution and noise characteristics of the detector were described using the modulation transfer function (MTF) and the noise power spectrum (NPS), both of which were used to filter the simulated projection images in the frequency domain. Further details about the hybrid simulation technique can be found in Zhang et al [10].
Figure 2.
Flowchart of the hybrid simulation technique for cone beam CT.
Simulation model
The simulation model was first established with the original flat filtration design of the Scanora system. The small rotation of the X-ray tube about the anode to cathode axis, as shown in Figure 1, was handled by tilting up the phase space generated at the tube window with a special source routine of BEAMnrc [12].
Given the offset scanning geometry and the truncated FOV with respect to the patient size, it is essential that the pixel values near the border of each simulated projection image are accurate, especially at the inner side. Two steps were taken to ensure this. The first concerns the fitting procedure in smoothing the scatter distribution, where the robustness of fitting near the edges of each projection was improved by providing additional data beyond the image border. To do so, the scatter signals were always collected with a sufficiently large detector dimension, namely twice as large as the actual one, although the collimation was kept unchanged, which ensured the radiation field and scatter distribution were both realistic. The fitting was then performed over the large range and the images were truncated to the actual dimension afterwards. The second step concerns the application of the MTF in the frequency domain, an operation equivalent to the convolution of each projection image (in the spatial domain) with the detector point spread function. The (unknown) pixel values beyond the image border are important to the accuracy of the convolution near those positions. Therefore, each 2D projection image was padded with void margins before applying the MTF, i.e. pixels beyond the image border were assumed to be zero. The influence of the zero-padding was compensated in subsequent image pre-processing, where the projection data were normalised against the flood image that had been padded and filtered with the MTF in the same manner.
The image pre-processing pipeline of the Scanora system consists of dark field correction, bad pixel correction, flood field normalisation and logarithm conversion. The first two steps were not needed with our simulation approach. Before being used for normalisation, the simulated flood image had to be fitted in both directions to guarantee that no noise was induced owing to the limited number of X-rays from the source simulation since noise was solely determined by the application of NPS. The flood image was also filtered with the MTF, as mentioned above, in order to better cope with the border conditions. Finally, the projection images were compiled into the same format as routine images of the system for reconstruction using the proprietary Scanora software.
Development of bowtie filters
The principle upon which bowtie filters are designed remains a proprietary technology of the CT manufacturers. It is known that polymethyl methacrylate (PMMA), polytetrafluoroethylene (Teflon), aluminium and copper are commonly adopted materials, while the exact dimension can differ between systems (even for the same manufacturer) depending on the image acquisition geometry and the range of exposure settings. The practical design may have many criteria, including the beam shaping effect, beam hardening effect, dose reduction, scatter management, noise uniformity, contrast detectability and so forth. Searching for an optimal bowtie filter suggests an iterative procedure with the simulation which evaluates a design criterion or some combination of criteria and adjusts the bowtie dimension until a preset condition is satisfied. Optimising the noise uniformity in reconstructed images, as suggested in Wunderlich and Noo [14], would be one of the aims but demands detailed knowledge of the detector response and exact parameter settings of the reconstruction algorithm. In the present study, we aimed for uniform flux intensity at the detector, with the idea of relaxing the requirement on the dynamic range of the detector. Uniform signal intensity should also lead to uniform noise in the projection image.
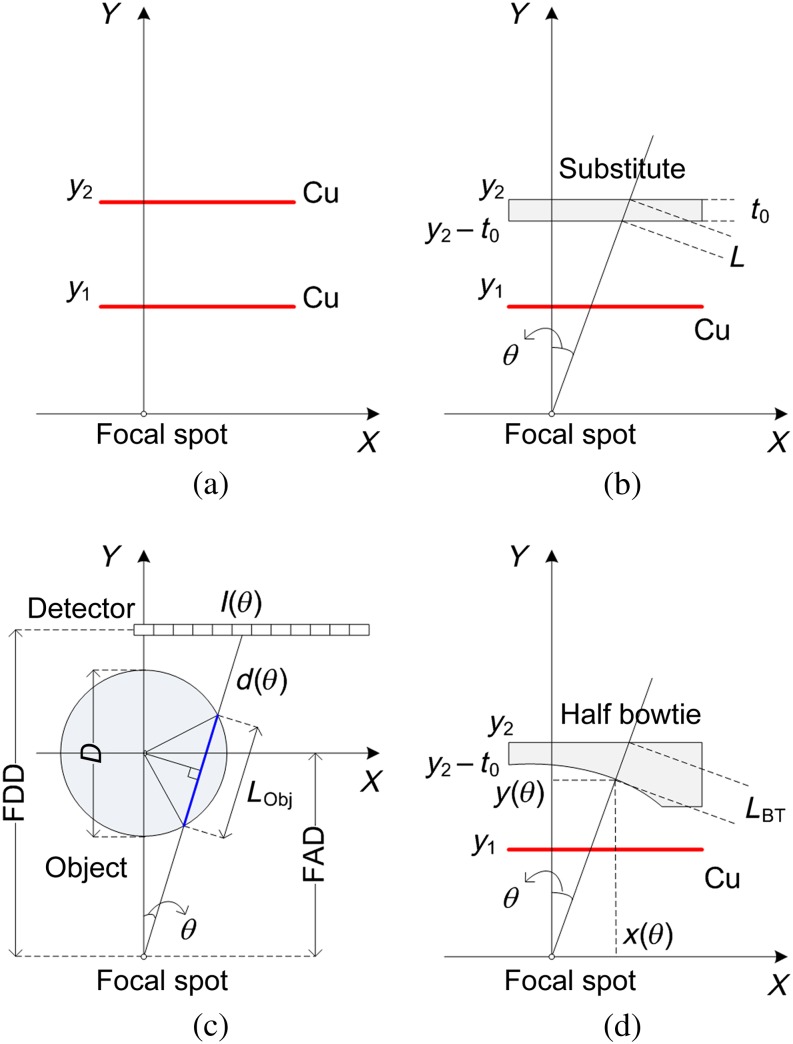
Considering the integrity of the original system, the bowtie filter was expected to replace the second added filter, which was originally a 0.1-mm flat copper sheet, while leaving the remaining source structure untouched. As shown in Figure 3a, y1 and y2 represent the distances of the two flat filters to the focal spot in the original design. We restrict ourselves to the axial plane of the FOV. The bowtie filter should reside on (y1, y2) with a flat surface at y2 such that the holder for the second flat filter could still be used. Given the low beam quality and the tube current limitation of the Scanora, copper was not considered a suitable material for the bowtie filter. A less attenuating material would allow easier machining to the desired (variable) thickness and still fit into the available space. Therefore, we first substituted the copper filter with a flat plate of a potential bowtie material that produces the same output X-ray spectrum as shown in Figure 3b. To obtain the equivalent substituting thickness t0, the phase space generated behind the first copper filter was transported through the plate by Monte Carlo simulation in which the value of t0 could be iteratively adjusted.
Figure 3.
Development of bowtie filter for the Scanora system: (a) positions of the original flat copper filters, (b) substitution of the second copper sheet with an aluminium plate, (c) attenuation by a water cylinder and (d) variable bowtie thickness. FAD, focal spot to rotation axis distance; FDD, focal spot to detector distance.
The offset scanning geometry of the Scanora suggests a half-bowtie filter. Let θ be the beam angle with respect to the y-axis; the thickness of the bowtie filter for θ≤0 was held constant to be t0. To define the dimension for θ>0, a cylindrical object with diameter D was simulated at the rotation centre, as shown in Figure 3c. Let I be the attenuated beam intensity as a function of θ and I(0) the intensity of the X-ray beam at θ=0 after passing through the object. It then follows from the Beer–Lambert law that
 |
for
 |
where FAD is the focal spot to rotation axis distance,  is the average attenuation coefficient for the object and LObj is the beam path length traversed within the object, determined by
 |
Note that LObj(0)=D. Corrected for the spatial variation of photon fluence according to the inverse square law [6], Equation (1) becomes
 |
where d(θ) stands for the total beam path length at θ. That is
 |
The bowtie filter should equalise the attenuation profile such that I(θ) stays equal to I(0), requiring
 |
where LBT specifies the angular length of filtration, as shown in Figure 3d, and  is the average attenuation coefficient for the bowtie filter. Note that LBT(0)=t0. Rearranging Equation (5) leads to
 |
Inserting Equation (2) into Equation (6), LBT is written as
 |
Co-ordinates of the bowtie surface can be found by
 |
With Equation (8), it is possible to sample the exact bowtie dimension at discrete θ and fit the curving surface with polynomials. The bowtie thickness to angles beyond the range θ is defined to continue as a plateau.
Choosing aluminium to be the material for the bowtie filter, t0 was found to be 4.0 mm. The object was assumed to be a homogeneous water cylinder of diameter D, where D was chosen to approximate various sizes of the human head. The values of  and
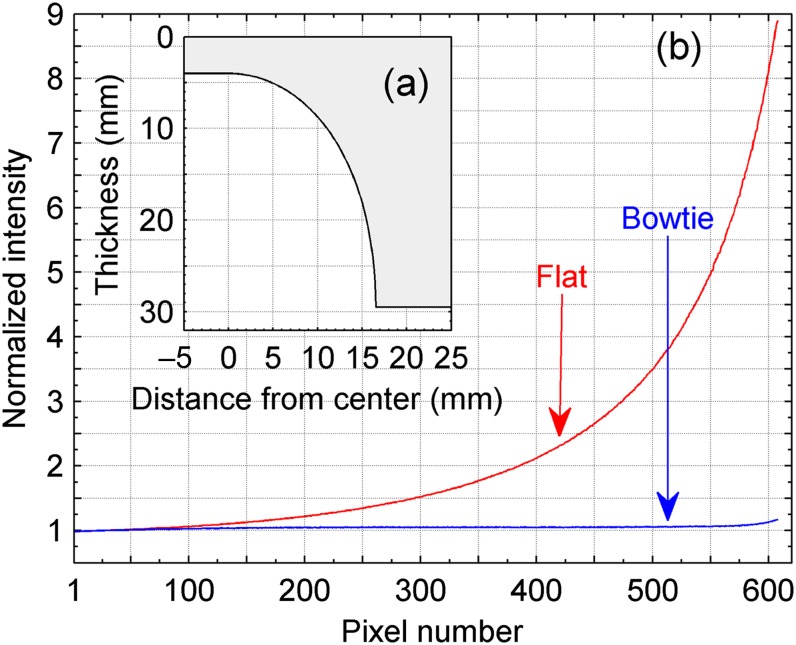
and  were estimated to be 0.206 cm−1 and 0.750 cm−1, respectively, corresponding to an average photon energy of 60 keV. Given the typical size of adult human heads, three bowtie filters were considered in our investigation, with dimensions calculated using D=14, 16 and 18 cm. The thickness of the bowtie filter calculated with D=16 cm is plotted in Figure 4a as a function of distance from the central beam. The intensity profile of the corresponding projection image with the presence of the water cylinder is shown in Figure 4b. It can be observed that the bowtie filter manages to flatten the intensity profile, with a reduction factor ∼9 approaching the periphery.
Figure 4.
(a) Bowtie filter dimension calculated with D=16 cm and (b) normalised horizontal intensity profile of the projection image with the presence of the object.
Simulation of bowtie filtration
Since no component module in the BEAMnrc was available for describing the shape of bowtie filters, a separate EGSnrc code for such geometry was developed and integrated within the source simulation model. The bowtie filter had an Al-equivalent thickness for θ≤0 as compared with the original flat filter, i.e. the beam hardening effect remained identical after the substitution. However, the output X-ray fluence may still have been changed. To maintain the output X-ray fluence in the central beam direction, the number of electron bombardments simulated for the X-ray tube had to be increased until the output photon fluence towards the inner side of the projection matched that of the original filtration. This corresponds to increasing the tube current on a real imaging system.
Phantoms
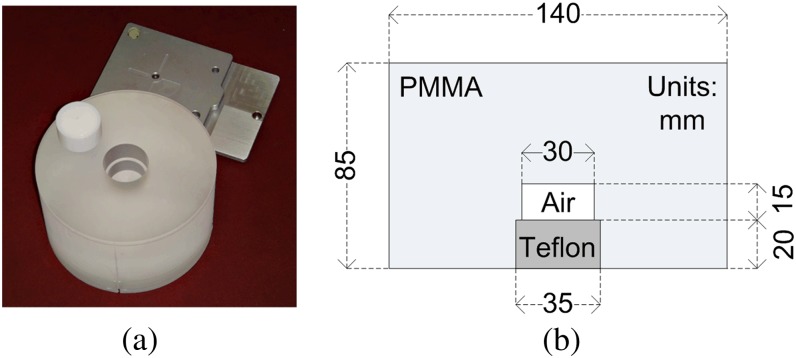
Performance of the CBCT system was evaluated by scanning different test phantoms. First, the quality assurance (QA) phantom supplied with the Scanora system was used, a PMMA cylinder with a small cylindrical air cavity and a cylindrical Teflon insert. The dimensions are shown in Figure 5. It was positioned at the rotation centre, where the diameter of the phantom completely fits the large FOV. This phantom was used for comparing the experimental and simulated image data for flat filtration and then to assess the impact of bowtie filters. In the experimental acquisition, the positioning is assisted by a specific phantom holder and the positioning lights. In the simulation, phantom positioning was precise because of its ideal geometric setting. To account for any small discrepancy of the phantom placement when comparing the reconstructed images, the experimental image was to be registered to its simulation counterpart with a 3D rigid transform.
Figure 5.
(a) The quality assurance (QA) phantom and the phantom holder supplied with the Scanora 3D CBCT system (Soredex, PaloDEx Group, Finland) and (b) dimensions of the QA phantom in lateral view. PMMA, polymethyl methacrylate.
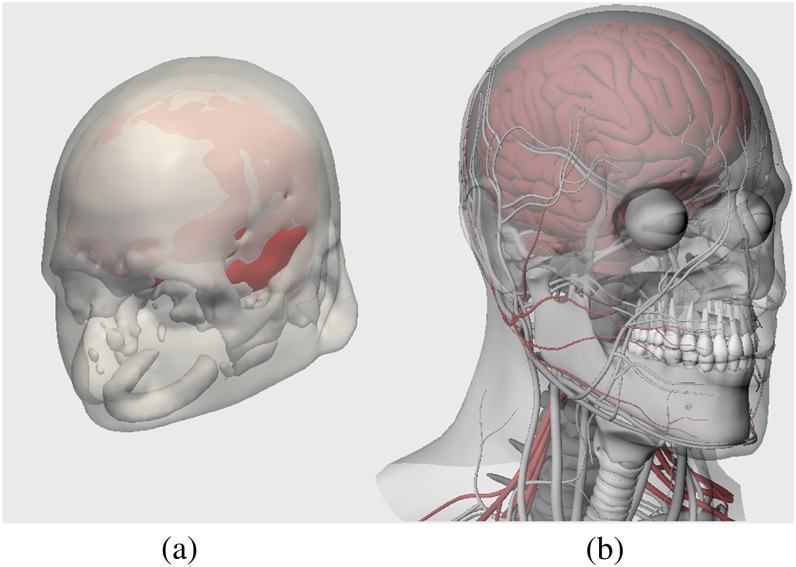
In further simulations, two computational anatomical phantoms were used. One was the “Zubal” head phantom made available by techniques described in Zubal et al [15]. This phantom is based on segmentation data from transaxial MR images, representing the typical anatomy of the upper half of a human head with 125 identified organs and suborgan structures. The phantom data were computerised in a 3D array of 1.1×1.1×1.4 mm3 voxels. Unfortunately, the lower half of the head is not available—a clear limitation of the phantom. To investigate the case of oral CBCT examinations, we employed a so-called “Plasticboy” phantom [16], a 3D computer graphics phantom that relies on triangular mesh models to represent the human organ system with a high fidelity. The head and neck part of the phantom was adopted in this study as it has a detailed depiction of the human dentition. The phantom was voxelised with an isotropic resolution of 0.65 mm for implementation with the simulation model. Figure 6 provides a 3D view of the two phantoms. Data of mass density and elemental composition for different organs and tissues were taken from the International Commission on Radiological Protection [17]. The large FOV was simulated with a focus on the frontal sinus for the Zubal phantom and on the oral region for the Plasticboy phantom.
Figure 6.
Three-dimensional views of (a) the skin, skull and brain of the Zubal head phantom and (b) the head and neck anatomy of the Plasticboy phantom [16].
Assessment and results
System performance for different filtrations was assessed in terms of the output radiation field, the dose delivered to the object, the scatter distribution in projection images and the reconstructed image quality. Interpretations of the results are threefold: comparison between the experimentally measured data and the data simulated with the original flat filtration, which shows the accuracy of the simulation model; comparison between the simulation data for flat filtration and the data for bowtie filtration, which shows the potential influence of bowtie filters; comparison among the simulation data for different bowtie dimensions, which shows the system dependence on the considered range of variations for bowtie filters.
Radiation field
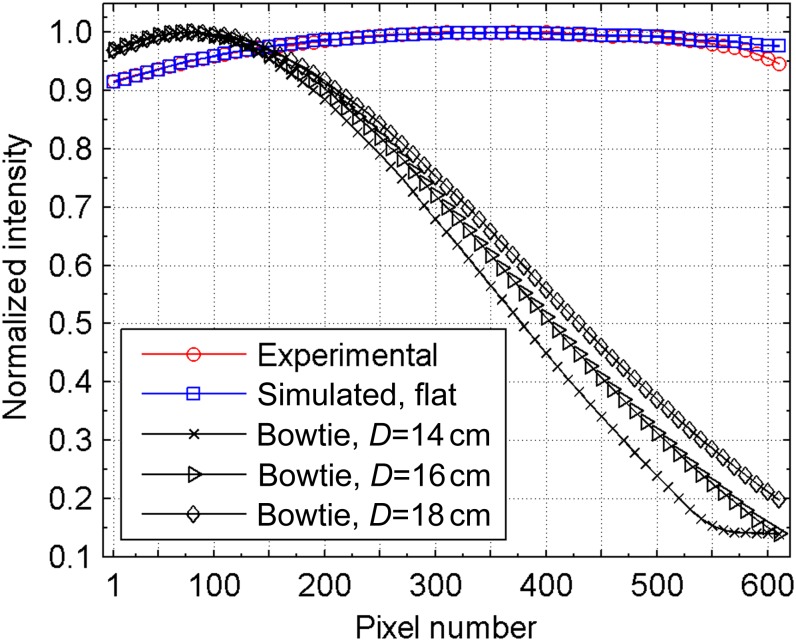
The modulation imposed by the bowtie filters as well as the original flat filter was first examined in terms of the beam shaping effect. This information is represented via the signal intensity profile of the flood field. Figure 7 shows normalised mean horizontal profiles of the measured experimental flood image, the simulated flood image with the original flat filter and the flood images simulated with different bowtie filters. It can be seen that the data produced by the simulation counterpart of the original flat filtration agree well with the experimental data, which in part confirms that the source simulation model was accurate. Some discrepancy can be noted at the outer side of the projection image, which is probably owing to slight differences in collimator placement of the Scanora system and their nominal positions used in simulation. As expected, the bowtie filters strongly reduce photon fluence towards the periphery of the FOV. The peak intensity arrives closer to the inner side of the projection with bowtie filtration than with flat filtration. Of note, about 25 pixels at the beginning of the profile correspond to the overlap region across the rotation axis. With the flat filter, the deviation of the peak fluence from the central beam direction is mainly owing to the heel effect. These are open field profiles, without an object in the beam. They may be contrasted with the curve in Figure 4a for a simulated scan of a 16-cm diameter phantom, which demonstrates the flattened projection profile for the bowtie filter case. Dynamic range requirements at the field periphery are reduced by a factor of ∼5.
Figure 7.
Normalised intensity profile over the horizontal direction for the experimental flood image and the flood images simulated with different filtrations.
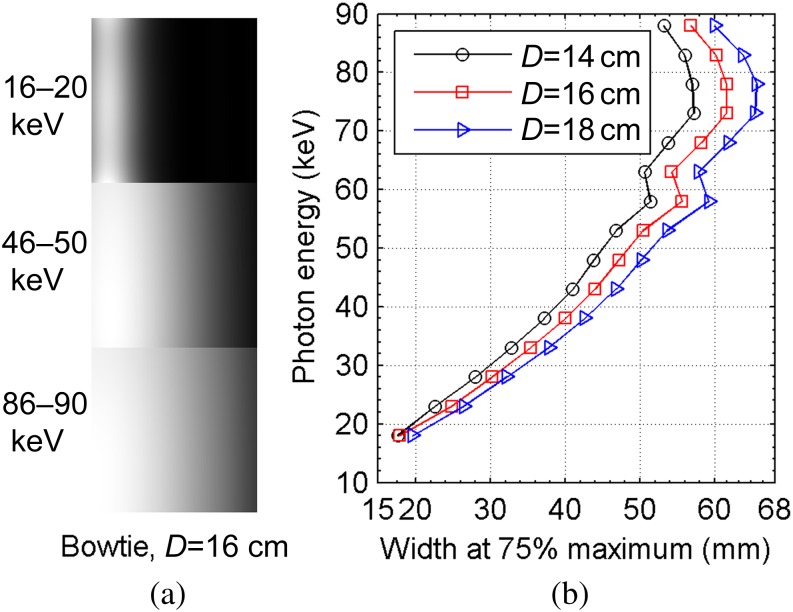
The radiation field was examined next in terms of the spatial variation of the output X-ray spectrum. This variation was owing to differences in beam hardening effect at different beam angles, which is obvious in the case of bowtie filtration. The “modulation templates” derived from the output phase space are able to characterise the photon distribution as a function of energy at all positions of the flood field [10]. In this study, the templates were obtained with 5 keV bins. The information contained in the modulation templates is equivalent to that of a pixelwise spectral analysis. Figure 8a shows the photon fluence distribution in the flood field at three selected energy bins with the bowtie filter optimised for D=16 cm. It can be observed that the gradient over the horizontal direction varies greatly with the photon energy. To evaluate the beam hardening effect in a quantitative manner, the width at three quarters of the maximum of the horizontal profile, σ0.75, was obtained from the modulation templates for each energy bin and for different bowtie dimensions as shown in Figure 8b. The σ0.75 for the original flat filtration is far beyond the imaging area since the photon fluence profile has nearly a flat distribution. The dramatic change of σ0.75 with bowtie filtration stresses the importance of accounting for the spatial variation of the spectrum when merging the analytically calculated mono-energetic “attenuation masks” as shown in Figure 2.
Figure 8.
(a) Examples of the photon fluence distribution characterised by the modulation templates for a bowtie filter and (b) width at 75% maximum of the horizontal profile of the modulation templates at different energy bins and for different bowtie dimensions.
Dose
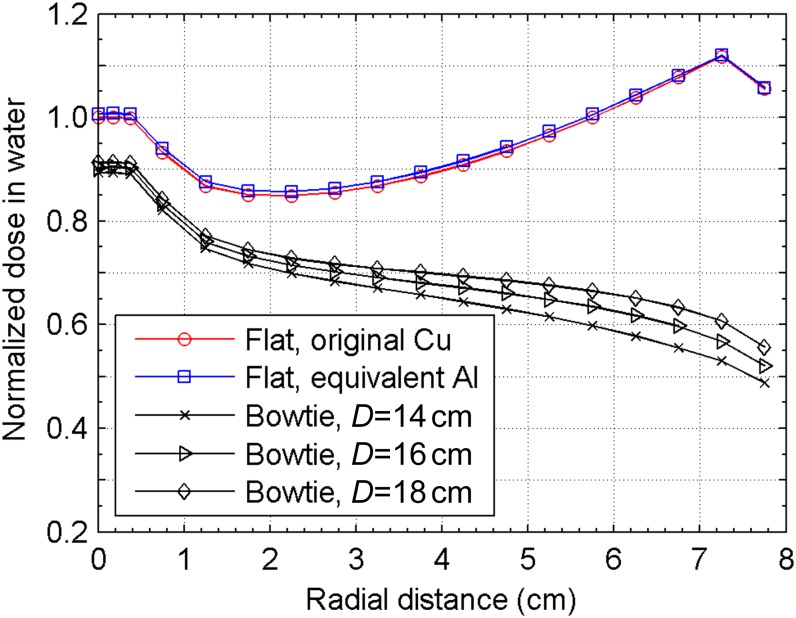
The effect of different filtrations was further examined by investigating the dose distribution. Monte Carlo dose estimates were calculated as a function of radial distance within a 16-cm diameter 9-cm height water cylinder that was positioned along the rotation axis with the bottom 1 cm below the rotation centre. Figure 9 shows the dose profile averaged over the axial direction for the simulated original flat filtration, the substituting flat filtration and the bowtie filtration optimised for different D. The data were normalised to the result at the central position under the original flat filtration. The close agreement between the results for the original flat filtration and the substituting flat filtration suggests that the intermediate step taken to replace the flat copper sheet with a flat aluminium plate in developing the bowtie filter was valid. The dose reduction effect by bowtie filters is increasingly prominent from the centre to the periphery of the FOV, namely from 8.7% to 53.8% for the D=14 cm case. The reduced dose around the centre is attributed to the reduced scatter radiation from the peripheral to the central regions. The difference between different bowtie dimensions is exhibited mainly over the peripheral half of the radius, where the largest difference is 14.6%.
Figure 9.
Normalised dose distribution as a function of the radial distance within a 16-cm diameter water cylinder imaged at the rotation centre using different filtrations.
Scatter
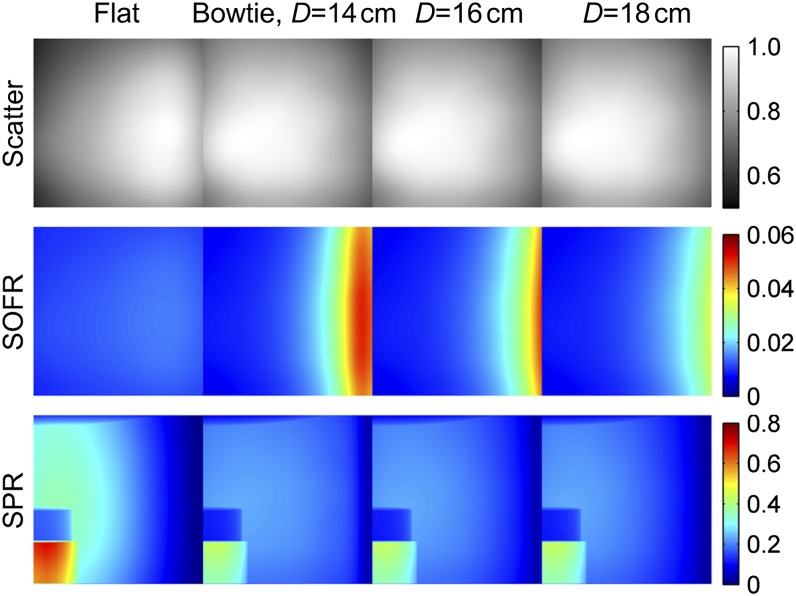
The scatter distribution in projection images was assessed via the QA phantom. Figure 10 shows the profile of scatter distribution, the scatter-to-open field ratio (SOFR) and the scatter-to-primary ratio (SPR) in one projection of the QA phantom imaged with different filtrations. The scatter distribution was presented by normalising the scatter signals against the maximum over the imaging area. With the original flat filtration, the scatter signals are stronger near the outer side. In contrast, scatter distribution was largely flattened by the bowtie filters. The differences for different bowtie filters imply that the bowtie dimension could be optimised in terms of scatter uniformity while taking into account the size of the object to be imaged. The SOFR was obtained by normalising the scatter projection image against the flood projection image. Differences are mainly exhibited near the outer side, where the flood intensity is greatly reduced by bowtie filters, and the differences owing to different bowtie dimensions are up to 44.3%. The SPR was obtained by dividing the scatter projection image with the corresponding primary projection image. For all types of filtrations, the SPR decreases from the centre to the periphery, corresponding to the variation of beam path length traversed by the phantom. The bowtie filters reduce SPR in general, with the greatest reduction near the inner side and for high attenuating regions, namely up to 37.6% for the Teflon insert region. Influence at the outer side is less evident owing to reduced primary signal. For the relatively low SPR near the outer side, the difference among different bowtie dimensions is up to 59.5%.
Figure 10.
Profile of scatter distribution, scatter-to-open field ratio (SOFR) and scatter-to-primary ratio (SPR) in the projection image of the quality assurance phantom simulated with different filtrations.
Image quality
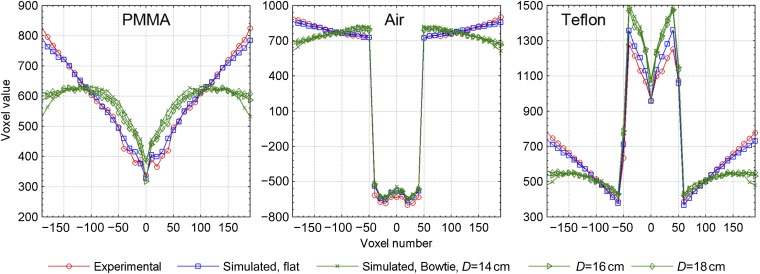
Reconstructed image quality was assessed with the computational anatomical phantoms as well as the QA phantom. Reconstruction parameters were kept the same as in patient cases. For the QA phantom, the experimentally acquired projection data and the data simulated with flat and different bowtie filtrations were reconstructed for comparison. Figure 11 plots the mean profiles over axial planes for the homogenous PMMA section, the air cavity section and the Teflon insert section. Note that the voxel value of the reconstructed image by the Scanora system is not precisely calibrated to the Hounsfield Units scale. The agreement between the experimental data and the simulation data for the original flat filtration provides further evidence that the simulation model is accurate. For the PMMA section, it can be seen that the cupping artefact is quite strong, with >50% decrease in voxel value from the periphery to the centre of the FOV. This artefact is mainly owing to scatter and the beam hardening effect [18]. The bowtie filtration limits such artefact and flattens the profile, lowering peripheral voxel values by ∼25% and raising voxel values in the inner half by ∼10%. It is interesting to note that the bowtie filter optimised for D=14 cm, the same as the diameter of the QA phantom, shows slight overreduction near the edge of the FOV. This is because the QA phantom has a different attenuation property than that assumed in deriving the bowtie dimension, which was homogeneous water. The influence of bowtie filtration on the air cavity and the Teflon insert section is also mainly on the surrounding PMMA area, although the voxel value of Teflon is increased by ∼5%.
Figure 11.
Mean profile at different sections of the reconstructed axial image of the quality assurance phantom. Experimentally acquired data with flat filtration, simulated data with flat filtration and simulated data with different bowtie filtrations are indicated. PMMA, polymethyl methacrylate.
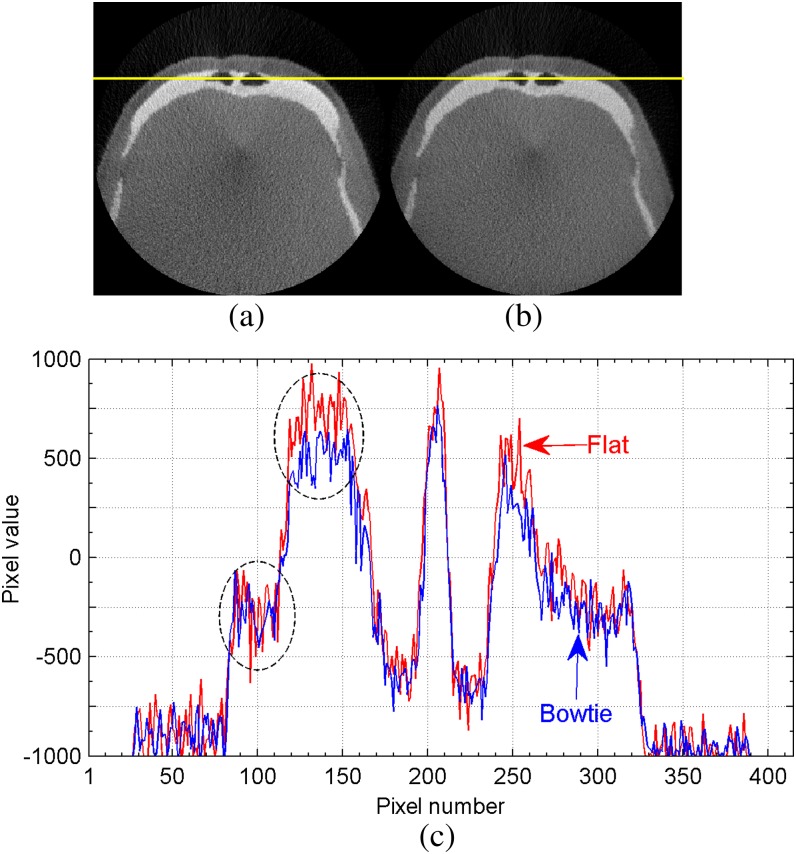
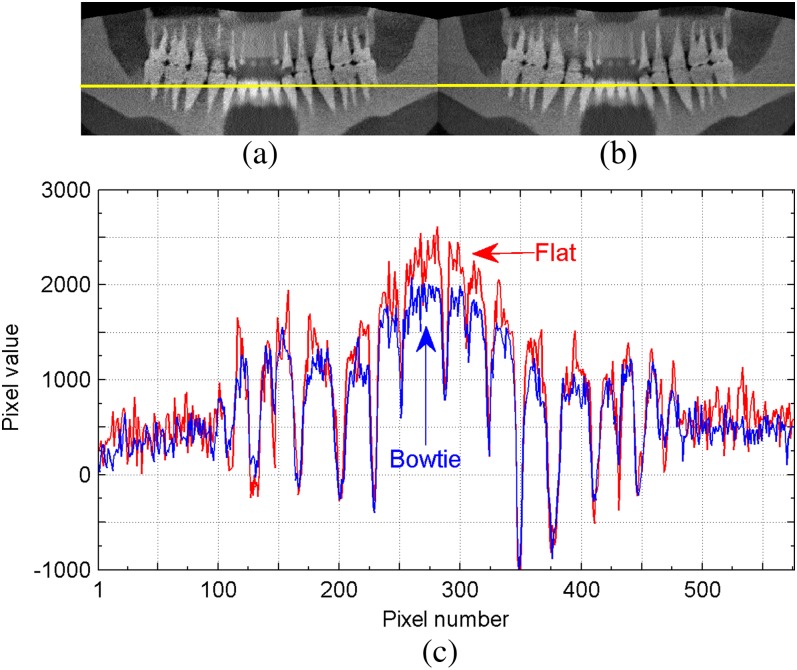
Projection data for the Zubal phantom and the Plasticboy phantom were simulated with the original flat filtration and with the bowtie filtration optimised for D=16 cm. Results for the Zubal phantom are shown in Figure 12. It can be observed that the bowtie filtration results in comparable noise appearance, contrast resolution and artefact pattern to the flat filtration. Qualitatively, the contrast-to-noise ratio for the selected bony region against the soft-tissue region, as indicated in Figure 12c, is 7.61 for the flat filtration and 7.88 for the bowtie filtration, calculated as the difference between the mean divided by the square root of the sum of the variance for pixel values in two regions. Increase in contrast-to-noise ratio using the bowtie filtration is <5%. Given the favourable representation of the oral anatomy, reconstruction results for the Plasticboy phantom are presented using the panoramic view as shown in Figure 13. The panoramic images were derived from the reconstructed volume via free-form curve extraction across the axial slices. We chose to place the curve over the jaw bones. Similar results are found. The bowtie filtration reduces the range of voxel values across the image with ∼10% lower peak values around the incisors.
Figure 12.
A typical reconstructed axial image of the Zubal phantom with (a) the original flat filtration, (b) the bowtie filtration and (c) comparison of a selected line profile across the image. The line in (a) and (b) indicates the position of the profile, and the dashed circles in (c) indicate the selected region for use in contrast-to-noise ratio calculation. Arrows indicate the flat and bowtie filtrations.
Figure 13.
A panoramic view derived from the reconstructed image of the Plasticboy phantom with (a) the original flat filtration, (b) the bowtie filtration and (c) comparison of a selected line profile across the panoramic view. The line in (a) and (b) indicates the position of the profile. Arrows indicate the flat and bowtie filtrations.
DISCUSSION
The focus of this study was on computer simulation as this enabled us to investigate an extensive modification to the filtration of a commercial imaging system. For larger CBCT systems, as in image-guided radiotherapy, bowtie filtration is an optional exposure setting and the effect has been thoroughly investigated via experimental measurements [1,3].
Voxel phantoms developed using the segmentation data of medical images are increasingly popular in Monte Carlo-based dosimetry studies. Image simulation, as another important application, usually has a higher requirement on the voxel resolution. As demonstrated in this study, the resolution of the MR-based Zubal phantom showed to be sufficiently fine for use in simulating images. For the oral and maxillofacial complex, the Plasticboy phantom would be a promising choice, where the anatomical models designed solely with computer graphics techniques were assumed sufficiently faithful.
Although we have observed specific effects owing to the use of bowtie filtration, they could be more evident for larger FOVs. It would therefore be interesting to modify the system at a larger scale by increasing the size of the radiation field, which may give a critical size above which the bowtie filtration should be recommendable. Bowtie filtration has been implemented on some other CBCT systems with similar applications as routinely done with the Scanora. Some systems with bowtie filtration are associated with even smaller cone angles. Therefore, it could also be an interesting simulation study to inversely apply the simulation assessment for these systems, namely to predict the impact of dropping the bowtie filter, replacing it with a flat one, or varying the bowtie dimensions.
There are several limitations to the hybrid simulation model established to the Scanora system when assessing the effect of bowtie filtration. First, the scatter generated by the anode target, the bowtie filter, the flat filter and the collimators was not taken into account. A practical solution to tackle this issue would be back-projecting the output phase space towards the focal spot position and labelling the deflecting photons prior to the projection simulation. However, the influence of these photons is expected to be minimal, considering the source to detector distance and the small FOV of the Scanora. Second, the advantage of bowtie filtration in relaxing the dynamic range of the detector is difficult to validate, although the flux intensity has been normalised. The exact contribution in this aspect depends on the detector of the actual system, where more information is needed. Third, the scatter and the primary projection images were collected with a perfect and constant energy absorbing efficiency in simulation before applying the detector MTF and NPS. This may remove part of the modulation effect by bowtie filters because the bowtie filter imposes stronger beam hardening in the peripheral direction than in the central beam direction, and such effect would not be fully picked up with a constant detector response. Finally, the reconstruction was conducted using the commercial software provided with the imaging system and hence is not designed specifically for use with the projection data acquired under bowtie filtration. The existing scatter correction and artefact reduction measures may conflict with the presence of a non-flat radiation field. A further step would be exploring custom reconstruction for the data considered here, which takes into account the reduced scatter as well as the increased primary signal and noise uniformity. However, investigating new image reconstruction techniques was not considered within the scope of the present study.
CONCLUSION
This simulation study systematically explored the potential use of bowtie filtration for a dedicated head and neck CBCT system. With regard to the offset geometry, Monte Carlo simulation of the radiation field and characterisation of the source modulation must adequately cover the FOV of interest. A generally applicable formulation based on normalising the signal intensity at the X-ray receptor was explicitly given to derive and optimise the dimensions of a bowtie filter. Compared with the original flat filtration, simulation results predicted that the bowtie filtration has a dose reduction of up to 53.8% at the periphery of a 16-cm diameter water cylinder. Even though the FOV was just 145×75 mm, bowtie filtration was useful for scatter management, reducing the scatter-to-primary ratio by up to 37.6% for a 14-cm diameter cylindrical contrast phantom. The comparable image results found for the computational anatomical phantoms suggest modification to the image pre-processing and the reconstruction for application of bowtie filtration. This hybrid simulation study demonstrated an approach that is useful for exploring and proposing design changes for CBCT systems.
FUNDING
This study was supported by the research fund of KU Leuven (OT/08/057). QL is with the National Key Technology R&D Program of China (2011BAI12B03).
Acknowledgments
We would like to thank M Linnosaari, E Eronen and E Suuronen with the PaloDEX group for providing technical details of the Scanora 3D CBCT system.
REFERENCES
- 1.Graham SA, Moseley DJ, Siewerdsen JH, Jaffray DA. Compensators for dose and scatter management in cone-beam computed tomography. Med Phys 2007;34:2691–703 [DOI] [PubMed] [Google Scholar]
- 2.Ding GX, Duggan DM, Coffey CW. Characteristics of kilovoltage x-ray beams used for cone-beam computed tomography in radiation therapy. Phys Med Biol 2007;52:1595–615 10.1088/0031-9155/52/6/004 [DOI] [PubMed] [Google Scholar]
- 3.Mail N, Moseley DJ, Siewerdsen JH, Jaffray DA. The influence of bowtie filtration on cone-beam CT image quality. Med Phys 2009;36:22–32 [DOI] [PubMed] [Google Scholar]
- 4.Menser B, Wiegert J, Wiesner S, Bertram M. Use of beam shapers for cone-beam CT with off-centered flat detector. Proc SPIE 2010;7622:762233 [Google Scholar]
- 5.Boone JM. Method for evaluating bow tie filter angle-dependent attenuation in CT: theory and simulation results. Med Phys 2010;37:40–8 [DOI] [PMC free article] [PubMed] [Google Scholar]
- 6.Beutel J, Kundel HL, Van Metter RL, editors. Handbook of medical imaging: physics and psychophysics. Volume 1 Bellingham, WA: SPIE, 2000 [Google Scholar]
- 7.Bootsma GJ, Verhaegen F, Jaffray DA. The effects of compensator and imaging geometry on the distribution of x-ray scatter in CBCT. Med Phys 2011;38:897–914 [DOI] [PubMed] [Google Scholar]
- 8.Miracle AC, Mukherji SK. Cone beam CT of the head and neck, Part 1: physical principles. AJNR Am J Neuroradiol 2009;30:1088–95 10.3174/ajnr.A1653 [DOI] [PMC free article] [PubMed] [Google Scholar]
- 9.Tkaczyk JE, Du Y, Walter D, Wu X, Li J, Toth T. Simulation of CT dose and contrast-to-noise as function of bowtie shape. Proc SPIE 2004;5368:403–410 [Google Scholar]
- 10.Zhang G, Pauwels R, Marshall N, Shaheen E, Nuyts J, Jacobs R, et al. Development and validation of a hybrid simulation technique for cone beam CT: application to an oral imaging system. Phys Med Biol 2011;56:5823–43 10.1088/0031-9155/56/18/004 [DOI] [PubMed] [Google Scholar]
- 11.Wang G. X-ray micro-CT with a displaced detector array. Med Phys 2002;29:1634–6 [DOI] [PubMed] [Google Scholar]
- 12.Rogers DWO, Walters B, Kawrakow I. BEAMnrc users manual. NRCC Report PIRS-0509(A)revK. Ottawa, ON: National Research Council, 2009 [Google Scholar]
- 13.Kawrakow I, Mainegra-Hing E, Rogers DWO, Tessier F, Walters BRB. The EGSnrc code system: Monte Carlo simulation of electron and photon transport. NRCC Report PIRS-701. Ottawa, ON: National Research Council, 2010 [Google Scholar]
- 14.Wunderlich A, Noo F. Achieving uniform noise in direct fan-beam CT reconstruction through bowtie filter design. IEEE Nucl Sci Symp Conf Rec 2007;6:4379–82 [Google Scholar]
- 15.Zubal IG, Harrell CR, Smith EO, Rattner Z, Gindi G, Hoffer PB. Computerized three-dimensional segmented human anatomy. Med Phys 1994;21:299–302 [DOI] [PubMed] [Google Scholar]
- 16.Plasticboy Pictures CC Plasticboy anatomy models. 2009 [cited 1 January 2012]. Available from:http://www.plasticboy.co.uk/store/about.html
- 17.International Commission on Radiological Protection Basic anatomical and physiological data for use in radiological protection: reference values. Ann ICRP 2002;32:1–278 [PubMed] [Google Scholar]
- 18.Schulze R, Heil U, Gross D, Bruellmann DD, Dranischnikow E, Schwanecke U, et al. Artefacts in CBCT: a review. Dentomaxillofac Radiol 2011;40:265–73 10.1259/dmfr/30642039 [DOI] [PMC free article] [PubMed] [Google Scholar]


