Abstract
Purpose:
The aim of this study was to assess the enhancement patterns of hepatic focal nodular hyperplasia (FNH) on gadoxetic acid-enhanced MRI and diffusion-weighted (DW) MRI.
Methods:
This retrospective study had institutional review board approval. Gadoxetic acid-enhanced and DW MR images were evaluated in 23 patients with 30 FNHs (26 histologically proven and 4 radiologically diagnosed). The lesion enhancement patterns of the hepatobiliary phase images were classified as heterogeneous or homogeneous signal intensity (SI), and as dominantly high/iso or low SI compared with those of adjacent liver parenchyma. Heterogeneous (any) SI lesions and homogeneous low SI lesions were categorised into the fibrosis group, whereas homogeneous high/iso SI lesions were categorised into the non-fibrosis group. Additionally, lesion SI on T2 weighted images, DW images and apparent diffusion coefficient (ADC) values were compared between the two groups.
Results:
The lesions showed heterogeneous high/iso SI (n=16), heterogeneous low SI (n=5), homogeneous high/iso SI (n=7) or homogeneous low SI (n=2) at the hepatobiliary phase MR images. The fibrosis group lesions were more likely to show high SI on DW images and T2 weighted images compared with those in the non-fibrosis group (p<0.05). ADC values tended to be lower in the fibrosis group than those in the non-fibrosis group without significance.
Conclusion:
FNH showed variable enhancement patterns on hepatobiliary phase images during gadoxetic acid-enhanced MRI. SI on DW and T2 weighted images differed according to the fibrosis component contained in the lesion.
Advances in knowledge:
FNH shows a wide spectrum of imaging findings on gadoxetic acid-enhanced MRI and DW MRI.
Focal nodular hyperplasia (FNH) is the second most common benign hepatic tumour after haemangioma, and most frequently occurs in females of childbearing and middle age [1]. It is considered to result from a congenital vascular disorder leading to a hyperplastic response of the surrounding liver parenchyma and is histologically characterised by normal hepatocytes with malformed bile ducts [2,3]. It is generally accepted that FNH can be managed conservatively and most cases do not require surgery because of the lack of malignancy potential and low risk of complications such as rupture or haemorrhage [4,5]. Therefore, the goal of imaging is to make a confident diagnosis and to avoid a biopsy or even surgical resection.
MRI is a well-established and widely used diagnostic modality for detecting and characterising focal hepatic lesions and generally allows a confident diagnosis of typical FNH [6–8]. Findings of typical FNH on conventional gadolinium-enhanced MRI are brisk arterial enhancement, iso or slightly low signal intensity (SI) on the portal and equilibrium phase, iso or slightly low SI on T1 weighted images, iso or slightly high SI on T2 weighted images, a central scar showing high SI on T2 weighted images and delayed dynamic enhancement [6–9]. However, when atypical imaging features are present, such as atypical findings of a central scar, high SI on T1 weighted images or washout during the portal or equilibrium phase, it is not easy to distinguish FNH from other hypervascular tumours, such as hepatocellular adenomas, hypervascular metastasis or fibrolamellar hepatocellular carcinomas [6,9]. Indeed, according to a study by Bieze et al [6], characterisation of FNH and hepatocellular adenoma on standard MRI is inconclusive in 40% of lesions.
Gadoxetic acid (Primovist®; Bayer-Schering Pharma, Berlin, Germany) is a new recently approved hepatobiliary gadolinium-based contrast agent. It has dual pharmacokinetic actions that combine extracellular properties for dynamic phase imaging with high hepatocyte-specific uptake and biliary excretion for delayed hepatobiliary phase imaging [10,11]. Many reports have concluded that FNHs show liver-specific enhancement and appear as iso or high SI on hepatobiliary phase imaging, and this enhancement pattern is a new additional criterion for diagnosing FNH, particularly in comparison with hepatocellular adenoma [6,10–15]. However, even though the major enhancement features of FNH are iso or high SI on hepatobiliary phase imaging, the portion of the central stellate scar or radiating fibrous septa of FNH demonstrates low SI owing to a lack of functioning hepatocytes. We postulate that the overall SI of FNH lesions during hepatobiliary phase imaging is dependent on their proportions of cellular and fibrous components.
Diffusion-weighted (DW) imaging is useful for the detection and characterisation of hepatic focal lesions [16–18]. In theory, DW imaging measures the random motion of water molecules in biological tissues and reflects tissue properties, such as the size of the extracellular space, viscosity and cellularity [18–20]. According to prior hepatic fibrosis evaluations using DW imaging, lower apparent diffusion coefficient (ADC) values are observed in cirrhotic liver compared with normal liver tissue, which may be owing to restricted diffusion from extracellular fibrosis [21–25]. Despite the fact that FNH is benign, some lesions show diffusion restrictions, probably owing to their high cellularity [26–28], and fibrosis components contained in FNH lesions should influence the degree of diffusion restriction.
The purpose of this study was to classify FNH lesions according to their enhancement pattern on hepatobiliary phase imaging and to assess the findings on DW and T2 weighted imaging of the lesions with regard to those on hepatobiliary phase imaging.
MATERIALS AND METHODS
Patient population
This retrospective study was approved by the institutional review board of our hospital, and patient informed consent was waived. A search in the radiology department report database identified 1122 consecutive patients who had undergone gadoxetic acid-enhanced liver MRI at our institution between January 2009 and July 2012. The inclusion criteria for the study were histologically confirmed FNH, and an FNH diagnosis based on a combination of pre-established typical characteristics on prior CT or MRI and clinical or imaging follow-up [12].
Review of the electronic medical records of this population identified 30 FNH lesions in 24 patients, which were diagnosed by percutaneous biopsy (n=20) or by typical imaging characteristics on MR and clinical or imaging follow-up (n=5). Typical MRI findings included arterial enhancement, iso or slightly low SI on portal and equilibrium phase, iso or slightly low SI on unenhanced T1 weighted images, iso or slightly high SI on T2 weighted images, a central scar showing high SI on T2 weighted images and delayed dynamic enhancement. Also, those MRI findings did not change over time, with a follow-up of at least a year [26]. As for the remaining lesions (n=5), they were multiple lesions, and other lesions in the same liver were histologically confirmed as FNH. 20 female patients and 4 male patients were included (mean age, 33.8 years ±11.5; age range, 19–74 years).
MRI protocol
All MRI examinations were performed on either a 1.5-T imaging unit (Signa Excite; GE Healthcare, Milwaukee, WI) equipped with eight-channel phased-array body coils (20 patients) or a 3-T MR unit (Magnetom® Skyra; Siemens Medical Solutions, Erlangen, Germany) using 18-channel coils (4 patients). The patients were examined in the supine position, and the receiver coil was positioned to cover the upper abdomen. All patients underwent a routine clinical imaging protocol of the liver including breath-hold axial and coronal T2 weighted half-Fourier acquisition single-shot turbo spin echo (or single-shot fast spin echo), axial in and opposed phase chemical shift imaging, breath-hold T2 weighted fast spin echo with fat suppression and T1 weighted gradient-recalled echo fat-suppressed sequences before and after injection of the contrast agent. Arterial phase T1 weighted MR images were acquired during a single breath-hold of 20–35 s. Portal and equilibrium phase images were obtained 60 s and 180 s after injecting the contrast medium, and delayed hepatobiliary imaging was performed at 20 min. A bolus (0.025 mmol kg−1 body weight) of gadoxetic acid (Primovist®; Bayer Healthcare Pharmaceuticals, Montville, NJ) was administered into the antecubital vein at a rate of 1.5 ml s−1. Parameters for T2 weighted fast spin echo and T1 weighted three-dimensional gradient-recalled echo MRI protocol are summarised in Table 1.
Table 1.
Gadoxetic acid-enhanced MRI protocol
| Parameter | 1.5 T | 3 T |
| T2 weighted FSE | ||
| Acquisition method | Respiratory-triggered | Breath-hold |
| TR/TE (ms) | 6000/107 | 3000/104 |
| Flip angle (°) | 180 | 136 |
| Slice thickness (mm) | 7 | 5 |
| Interslice gap (mm) | 1.4 | 1 |
| Field of view (mm) | 360 | 380 |
| Matrix | 320×224 | 320×200 |
| T1 weighted 3D GRE | ||
| Technique | LAVA | VIBE |
| TR/TE (ms) | 4.25/2.03 | 3.52/1.37 |
| Flip angle (°) | 10 | 9 |
| Slice thickness (mm) | 2.6 | 2.7 |
| Interslice gap (mm) | 0 | 0 |
| Field of view (mm) | 360 | 380 |
| Matrix | 320×192 | 480×263 |
3D, three-dimensional; FSE, fast spin echo; GRE, gradient-recalled echo; LAVA, liver acquisition with volume acceleration; TR, repetition time; TE, echo time; VIBE, volumetric interpolated breath-hold examination.
DW single-shot echo planar images were acquired with simultaneous use of the respiratory triggering (1.5 T) or free breathing (3 T) methods. Specific sequence parameters for DW imaging are described in Table 2.
Table 2.
Diffusion-weighted MRI protocol
| Parameter | 1.5 T | 3 T |
| Acquisition method | Respiratory-triggered | Free-breathing |
| b-values | 0, 400, 800 | 50, 400, 800 |
| Repetition time/echo time (s) | 5500–8000/63–73 | 5600/50 |
| Receiver bandwidth (Hz per pixel) | 1953 | 2442 |
| Matrix | 128×128 | 84×128 |
| Slice thickness (mm) | 7 | 5 |
| Interslice gap (mm) | 1.4 | 1 |
| Number of signals acquired | 8 | 4 |
| Field of view (mm2) | 360×360 | 380×309 |
| Acquisition time (s) | 110–210 | 218 |
| Number of slice | 22 | 35 |
| Parallel imaging factor | 2 | 2 |
Image analysis
Gadoxetic acid-enhanced MRI
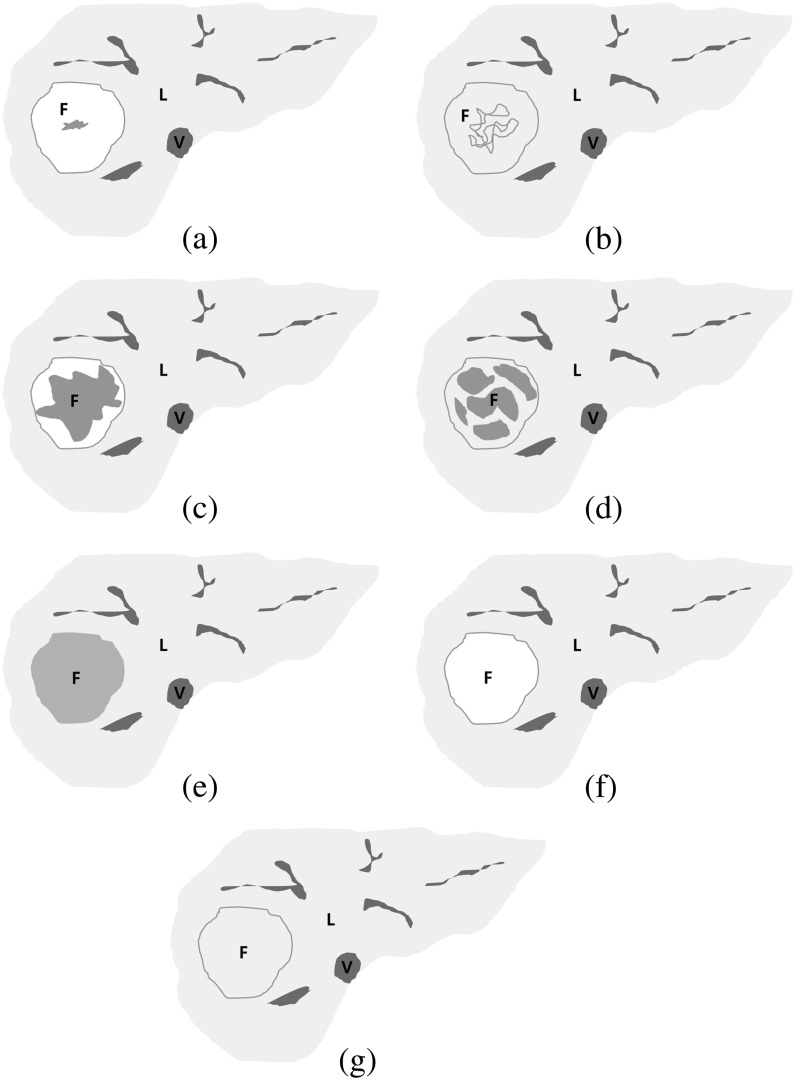
All MR images were retrospectively reviewed on a picture archiving and communication system workstation (Centricity RA1000; GE Healthcare, Milwaukee, WI). Two board-certified radiologists (HSP and YJK, with 7 and 12 years' clinical experience interpreting liver MR images, respectively) interpreted the MR images by consensus. The radiologists determined SI of the FNH lesions and recorded SI as low, iso or high SI on non-contrast T1 weighted images, T2 weighted images and contrast-enhanced dynamic T1 weighted (arterial phase, equilibrium phase and the 20-min hepatobiliary phase) images. SI ratios (SIRs) of the lesions were measured on each image set by one radiologist (HSP) and compared with adjacent hepatic parenchyma to establish objective measures [11]. Regions of interest (ROIs) were manually placed on each lesion and in adjacent liver parenchyma, encompassing as much of a lesion as possible to lie within the lesion and to avoid large vascular or biliary structures, then the SIR of the lesion to the liver signal was calculated. Lesions were characterised as low SI if SIR was <0.95, iso SI if SIR was ≥0.95 but ≤1.05 and high SI if SIR was >1.05. In addition, the pattern of contrast agent uptake was subjectively scored on hepatobiliary phase imaging as either heterogeneous if the lesion showed mixed high/iso and low SI or as homogeneous when the entire lesion showed either high, iso or low SI. Based on the finding that a central scar or fibrous septa on an FNH lesion showed low SI on hepatobiliary phase images, FNH lesions that had low SI portions, which were either heterogeneous high/iso SI (Figure 1a,b), heterogeneous low SI (Figure 1c,d) or homogeneous low SI (Figure 1e), were categorised as the fibrosis group, and the lesions showing homogeneous high/iso SI (Figure 1f,g) were classified as the non-fibrosis group (Table 3).
Figure 1.
Schematic diagrams of focal nodular hyperplasia (FNH) on hepatobiliary phase images of gadoxetic acid-enhanced MRI. (a) Heterogeneous high signal intensity (SI), (b) heterogeneous iso SI, (c) heterogeneous low SI, (d) heterogeneous low SI (2), (e) homogeneous low SI, (f) homogeneous high SI, (g) homogeneous iso SI. Heterogeneous high, iso or low signal intensity (SI) lesions and homogeneous low SI lesions were categorised into the fibrosis group (a–e), and homogeneous high or iso SI lesions were categorised into the non-fibrosis group (f, g). F, FNH; L, liver; V, inferior vena cava.
Table 3.
Categorisation of FNH based on hepatobiliary phase images of gadoxetic acid-enhanced MRI
| Lesion heterogeneity | Signal intensity of the FNH | |
| Fibrosis group | Non-fibrosis group | |
| Heterogeneous | High/iso | |
| Low | ||
| Homogeneous | High/iso | |
| Low | ||
FNH, focal nodular hyperplasia.
Diffusion-weighted MRI
ROI measurements of the ADC values of target lesions were added to the ADC map by one radiologist (HSP). ADC values were automatically calculated on ADC maps using the SI within the manually drawn ROI and the following equation: ADC=[ln(S0)–ln(S400)]/(400-0) (1.5-T MR unit) or [ln(S50)–ln(S400)]/(400-50) (3-T MR unit), where S0 is the SI on DW images obtained with a b-value of 0 s mm−2, S50 is the SI on DW images obtained with a b-value of 50 s mm−2 and S400 is the SI on DW images obtained with a b-value of 400 s mm−2. A qualitative assessment was also performed along with the quantitative measurement. By consensus reading, the two radiologists (HSP and YJK) determined lesion SI as high, iso or low compared with adjacent liver parenchyma on DW images at the two b-values and ADC maps.
Statistical analysis
The SI of the FNH lesions on DW and T2 weighted images were compared between the fibrosis and non-fibrosis groups using Fisher’s exact test. ADC values were compared between the two groups using Student’s t-test. p<0.05 was considered statistically significant. Results of the statistical analysis were obtained using commercially available software (MedCalc® v. 10.1.0.0; MedCalc Software, Mariakierke, Belgium).
RESULTS
Gadoxetic acid-enhanced MR findings
The mean maximum diameter of the 30 FNH lesions measured on 20-min hepatobiliary phase images was 3.31 cm (range 1.1–6.3 cm). 90% (27/30) of the lesions showed strong homogeneous enhancement on T1 weighted arterial phase images, whereas the other three lesions showed heterogeneous enhancement, iso SI or low SI. 28 lesions (93.3%) showed high or iso SI, and only 2 lesions showed low SI on equilibrium phase images.
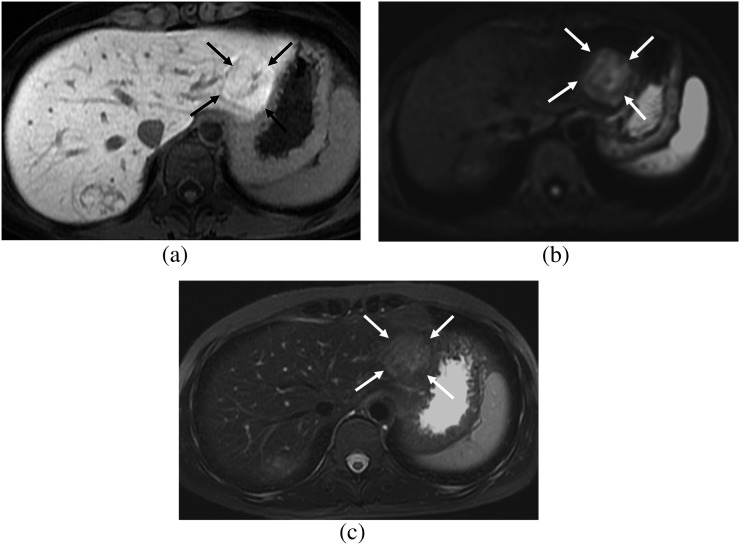
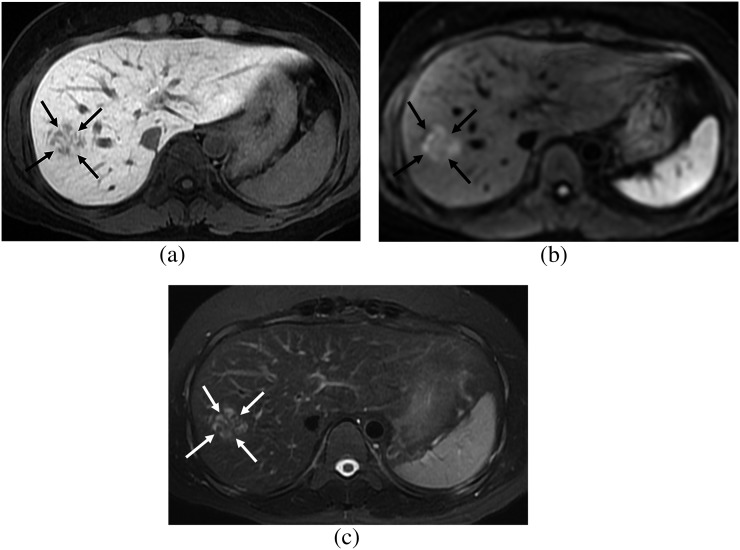
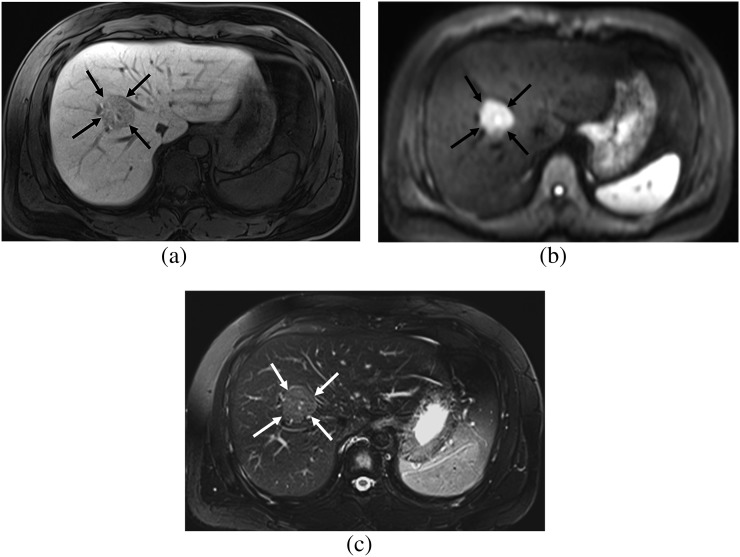
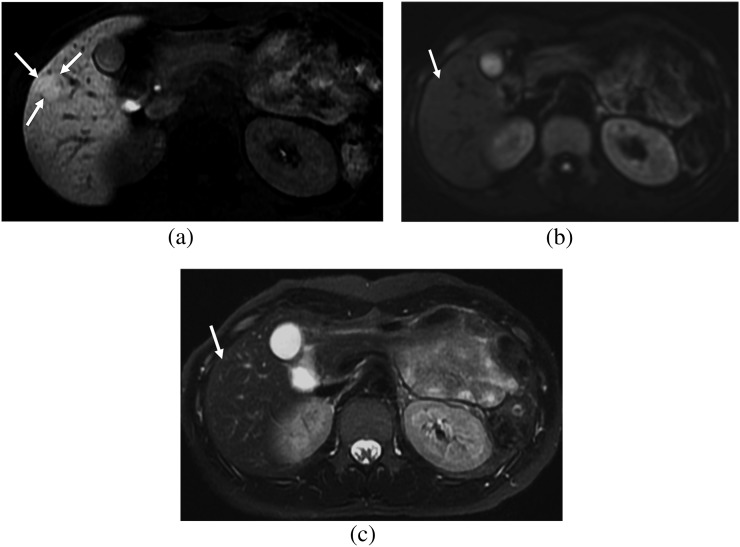
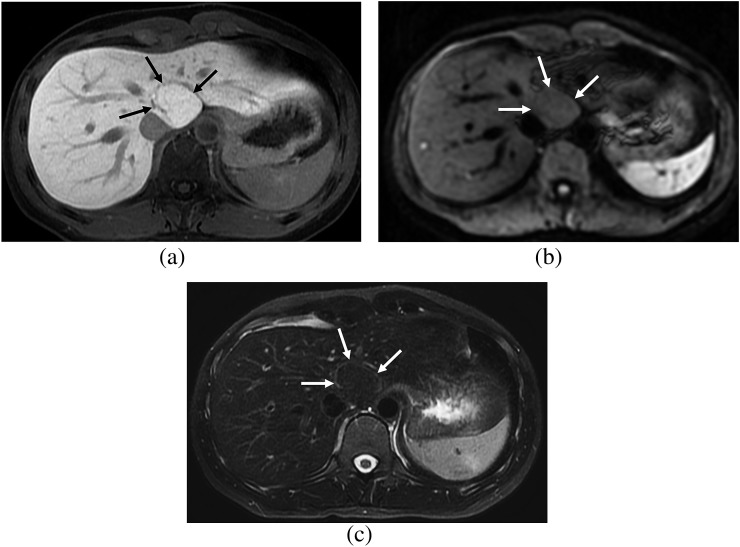
10 (33.3%) lesions showed high SI, 13 (43.3%) lesions showed iso SI and 7 (23.3%) lesions showed low SI on hepatobiliary phase images. Additionally, 21 (70.0%) lesions showed heterogeneous SI, whereas 9 (30.0%) were homogeneous. Four enhancement patterns were evident when those findings were combined: heterogeneous high/iso SI (n=16) (Figure 2), heterogeneous low SI (n=5) (Figure 3), homogeneous low SI (n=2) (Figure 4) and homogeneous high/iso SI (n=7) (Figures 5 and 6). Thus, they were divided into the fibrosis (n=23) (Figures 2–4) and non-fibrosis groups (n=7) (Figures 5 and 6) based on the criteria mentioned in the Materials and Methods section (Figure 1).
Figure 2.
A 32-year-old female. (a) Hepatobiliary phase image of gadoxetic acid-enhanced MRI shows a focal nodular hyperplasia showing heterogeneous high signal intensity (SI) (arrows), which is the fibrosis group. (b) On diffusion-weighted image (b=400), the lesion shows high SI (arrows) and diffusion restriction. (c) On T2 weighted image with fat suppression, the lesion shows high SI compared with that of the hepatic parenchyma (arrows).
Figure 3.
A 34-year-old female. (a) Hepatobiliary phase image of gadoxetic acid-enhanced MRI shows a focal nodular hyperplasia showing heterogeneous low signal intensity (SI) (arrows), which belongs to the fibrosis group. (b) On diffusion-weighted image (b=400), the lesion shows high SI (arrows) and diffusion restriction. (c) On T2 weighted image with fat suppression, the lesion shows high SI compared with that of the hepatic parenchyma (arrows).
Figure 4.
A 27-year-old male. (a) Hepatobiliary phase image of gadoxetic acid-enhanced MRI shows a focal nodular hyperplasia showing homogeneous low signal intensity (SI) (arrows), which is the fibrosis group. (b) On diffusion-weighted image (b=400), the lesion shows high SI (arrows) and diffusion restriction. (c) On T2 weighted image with fat suppression, the lesion shows high SI compared with that of the hepatic parenchyma (arrows).
Figure 5.
A 25-year-old female. (a) Hepatobiliary phase image of gadoxetic acid-enhanced MRI shows a focal nodular hyperplasia showing homogeneous high signal intensity (SI) (arrows), which is the non-fibrosis group. (b) On diffusion-weighted image (b=400), the lesion shows iso SI (arrows) and lacks diffusion restriction. (c) On T2 weighted image with fat suppression, the lesion shows iso SI compared with that of the hepatic parenchyma (arrows).
Figure 6.
A 29-year-old female. (a) Hepatobiliary phase image of gadoxetic acid-enhanced MRI shows a focal nodular hyperplasia showing homogeneous iso signal intensity (SI) (arrows), which is the non-fibrosis group. (b) On diffusion-weighted image (b=400), the lesion shows iso SI (arrows) and lacks diffusion restriction. (c) On T2 weighted image with fat suppression, the lesion shows iso SI compared with that of the hepatic parenchyma (arrows).
DW MR and T2 weighted MR findings
DW imaged lesions showed either high (n=20, 66.7%) or iso (n=10, 33.3%) SI. Lesions in the fibrosis group more frequently showed high SI on DW images (18/23, 78.3%) than those in the non-fibrosis group (2/7, 28.6%) (p=0.026) (Figures 2–6). The mean ADC value (×10−3 mm2 s−1) for all FNH lesions was 1.585±0.536 (standard deviation). Mean ADC of the fibrosis group (1.541±0.502) tended to be lower than that of the non-fibrosis group (1.729±0.658), but the difference did not reach statistical significance (p=0.424). The FNH lesions were seen as either high (n=15, 50.0%) or iso (n=15, 50.0%) SI on T2 weighted images. About 65% (15/23) of lesions in the fibrosis group showed high SI on T2 weighted images, whereas only one lesion (14.3%, 1/7) did in the non-fibrosis group, and the difference was statistically significant (p=0.031) (Figures 2–6).
DISCUSSION
The enhancement characteristics of FNH on hepatobiliary phase images of gadoxetic acid-enhanced MRI have been explored in many prior studies [6,10–15]. Histologically, FNHs are formed by multiple monoacinar nodules composed of normal-functioning hepatocytes, with abnormal bile ducts that do not communicate with the surrounding biliary system. Persistent uptake of liver-specific contrast media by normal hepatocytes and slowing of biliary excretion and retention of contrast within the lesion account for the increased SI on hepatobiliary phase images [12]. Prior studies have shown that >90% of observed FNHs on the hepatobiliary phase images are iso- or hyperintense relative to liver parenchyma [6,10,12–14]. In our study, 76.7% (23/30) of the lesions showed high or iso SI on hepatobiliary phase images and this figure was slightly lower than those of the most recent published studies.
Our study results demonstrated that FNHs manifested as various imaging features on hepatobiliary phase images of gadoxetic acid-enhanced MRI. We classified the FNH lesions on hepatobiliary phase images into four different categories (heterogeneous high/iso SI, heterogeneous low SI, homogeneous high/iso SI and homogeneous low SI), and the most frequent pattern was heterogeneous high/iso SI (53.3%, 16/30). Heterogeneous high/iso SI means that the lesion shows high or iso SI in most parts of the lesion but is mixed with a low SI portion. The low SI is mainly attributed to the central scar with its radiating fibrous septa. 5 (16.7%) of the lesions showed heterogeneous low SI, indicating that the lesions were mostly low SI and mixed with high/iso SI. In the same manner, these lesions are thought to contain a larger portion of the central scar and radiating fibrous septa. From these observations, we assumed that even though most FNH lesions show high or iso SI on hepatobiliary phase images, they can reveal varying degrees of low SI portions according to the central scar and fibrous septa component. About 23% (7/30) of the FNH lesions showing homogeneous high/iso SI lacked a central scar or fibrous septa. 2 (6.7%) lesions showed homogeneous low SI. Both these lesions were confirmed by percutaneous biopsy, although a detailed explanation of imaging–pathological correlation was not available. However, one of the lesions was from a 74-year-old female and the other was from a 27-year-old male patient. Considering that FNH mostly occurs in females of reproductive age, these two lesions are not only radiologically but also demographically atypical. In addition, the lesion from the 74-year-old aged female lacked arterial phase hyperenhancement. As FNHs are thought to occasionally undergo self-regression, which is why most lesions are encountered mostly in young females [29,30], this lesion in an older patient may be accompanied by some kind of degeneration and may show atypical imaging features.
With regard to DW imaging findings in our study, two-thirds of the FNH lesions (20/30, 66.7%) showed high SI on DW images. Earlier reports indicated that benign hepatocellular lesions, such as FNH along with hepatocellular adenoma readily mimic malignant hepatic tumours and often show increased SI and low ADC values on DW images [26,28], probably owing to their high cellularity. The mean ADC value of FNH lesions in our study was 1.585×10⁻³ mm2 s−1, which was similar to or slightly higher than reported ADC values of FNH, such as 1.40×10⁻³ mm2 s−1 [18], 1.46×10⁻³ mm2 s−1 [26] and 1.49×10⁻³ mm2 s−1 [16]. In addition, lesions in the fibrosis group significantly more frequently showed high SI on DW images than those in the non-fibrosis group. The mean ADC value of the lesions in the fibrosis group was lower than that in the non-fibrosis group. Similarly, SI on T2 weighted images in the fibrosis group was more frequently higher than that in the non-fibrosis group. From these results, we infer that the central scar and fibrous septa component contained in the FNHs contribute more to restricted diffusion than that of high cellularity. DW images may not be reliable to distinguish FNHs from malignant lesions, such as hepatocellular carcinomas or metastasis, as earlier reports indicated [26,28]. Indeed, increased diffusion restriction in FNH lesions acts as an obstacle along with low SI portions of the lesion seen on hepatobiliary phase imaging.
Several limitations in our study should be mentioned. First, a histological analysis with an exact radiological–pathological correlation was not available owing to the retrospective nature of this study. The fibrosis and non-fibrosis groups in this study were classified based on the SI pattern and degree of lesions during hepatobiliary phase MRI, which may be considered an arbitrary method. However, considering that most FNH studies in the radiology literature include FNH cases that are diagnosed by imaging findings only and without histological confirmation, decisions of at least a central fibrous scar in the fibrosis group based on imaging findings may not be groundless. Second, the sample size of the study was relatively small compared with other FNH studies, and the population number in each group was small. However, the proportion of histologically confirmed cases was larger (66.7%) than that in many prior FNH studies. Third, owing to its restospective nature, the DW imaging protocols varied, which may have impeded consistency in the ADC value measurements [31,32].
CONCLUSION
In conclusion, our study results revealed that FNH manifests variable enhancement patterns during hepatobiliary phase images on gadoxetic acid-enhanced MRI. SI on DW and T2 weighted images differed according to the fibrosis component contained in the lesion.
FUNDING
This work was supported by Konkuk University Medical Center Research Grant 2011.
REFERENCES
- 1.Maillette de Buy Wenniger L, Terpstra V, Beuers U. Focal nodular hyperplasia and hepatic adenoma: epidemiology and pathology. Dig Surg 2010;27:24–31 10.1159/000268404 [DOI] [PubMed] [Google Scholar]
- 2.Wanless IR, Mawdsley C, Adams R. On the pathogenesis of focal nodular hyperplasia of the liver. Hepatology 1985;5:1194–200 [DOI] [PubMed] [Google Scholar]
- 3.Kondo F. Benign nodular hepatocellular lesions caused by abnormal hepatic circulation: etiological analysis and introduction of a new concept. J Gastroenterol Hepatol 2001;16:1319–28 [DOI] [PubMed] [Google Scholar]
- 4.Reddy KR, Kligerman S, Levi J, Livingstone A, Molina E, Franceschi D, et al. Benign and solid tumors of the liver: relationship to sex, age, size of tumors, and outcome. Am Surg 2001;67:173–8 [PubMed] [Google Scholar]
- 5.Cherqui D, Rahmouni A, Charlotte F, Boulahdour H, Métreau JM, Meignan M, et al. Management of focal nodular hyperplasia and hepatocellular adenoma in young women: a series of 41 patients with clinical, radiological, and pathological correlations. Hepatology 1995;22:1674–81 [PubMed] [Google Scholar]
- 6.Bieze M, van den Esschert JW, Nio CY, Verheij J, Reitsma JB, Terpstra V, et al. Diagnostic accuracy of MRI in differentiating hepatocellular adenoma from focal nodular hyperplasia: prospective study of the additional value of gadoxetate disodium. AJR Am J Roentgenol 2012;199:26–34 [DOI] [PubMed] [Google Scholar]
- 7.Grazioli L, Morana G, Kirchin MA, Schneider G. Accurate differentiation of focal nodular hyperplasia from hepatic adenoma at gadobenate dimeglumine-enhanced MR imaging: prospective study. Radiology 2005;236:166–77 10.1148/radiol.2361040338 [DOI] [PubMed] [Google Scholar]
- 8.Grazioli L, Morana G, Federle MP, Brancatelli G, Testoni M, Kirchin MA, et al. Focal nodular hyperplasia: morphologic and functional information from MR imaging with gadobenate dimeglumine. Radiology 2001;221:731–9 [DOI] [PubMed] [Google Scholar]
- 9.Ferlicot S, Kobeiter H, Tran Van Nhieu J, Cherqui D, Dhumeaux D, Mathieu D, et al. MRI of atypical focal nodular hyperplasia of the liver: radiology-pathology correlation. AJR Am J Roentgenol 2004;182:1227–31 10.2214/ajr.182.5.1821227 [DOI] [PubMed] [Google Scholar]
- 10.Zech CJ, Grazioli L, Breuer J, Reiser MF, Schoenberg SO. Diagnostic performance and description of morphological features of focal nodular hyperplasia in Gd-EOB-DTPA-enhanced liver magnetic resonance imaging: results of a multicenter trial. Invest Radiol 2008;43:504–11 [DOI] [PubMed] [Google Scholar]
- 11.Mohajer K, Frydrychowicz A, Robbins JB, Loeffler AG, Reed TD, Reeder SB. Characterization of hepatic adenoma and focal nodular hyperplasia with gadoxetic acid. J Magn Reson Imaging 2012;36:686–96 10.1002/jmri.23701 [DOI] [PMC free article] [PubMed] [Google Scholar]
- 12.Purysko AS, Remer EM, Coppa CP, Obuchowski NA, Schneider E, Veniero JC. Characteristics and distinguishing features of hepatocellular adenoma and focal nodular hyperplasia on gadoxetate disodium-enhanced MRI. AJR Am J Roentgenol 2012;198:115–23 10.2214/AJR.11.6836 [DOI] [PubMed] [Google Scholar]
- 13.Gupta RT, Iseman CM, Leyendecker JR, Shyknevsky I, Merkle EM, Taouli B. Diagnosis of focal nodular hyperplasia with MRI: multicenter retrospective study comparing gadobenate dimeglumine to gadoxetate disodium. AJR Am J Roentgenol 2012;199:35–43 10.2214/AJR.11.7757 [DOI] [PubMed] [Google Scholar]
- 14.Grazioli L, Bondioni MP, Haradome H, Motosugi U, Tinti R, Frittoli B, et al. Hepatocellular adenoma and focal nodular hyperplasia: value of gadoxetic acid-enhanced MR imaging in differential diagnosis. Radiology 2012;262:520–9 10.1148/radiol.11101742 [DOI] [PubMed] [Google Scholar]
- 15.Karam AR, Shankar S, Surapaneni P, Kim YH, Hussain S. Focal nodular hyperplasia: central scar enhancement pattern using Gadoxetate Disodium. J Magn Reson Imaging 2010; 32:341–344 10.1002/jmri.22262 [DOI] [PubMed] [Google Scholar]
- 16.Parikh T, Drew SJ, Lee VS, Wong S, Hecht EM, Babb JS, et al. Focal liver lesion detection and characterization with diffusion-weighted MR imaging: comparison with standard breath-hold T2-weighted imaging. Radiology 2008;246:812–22 10.1148/radiol.2463070432 [DOI] [PubMed] [Google Scholar]
- 17.Ichikawa T, Haradome H, Hachiya J, Nitatori T, Araki T. Diffusion-weighted MR imaging with a single-shot echoplanar sequence: detection and characterization of focal hepatic lesions. AJR Am J Roentgenol 1998;170:397–402 10.2214/ajr.170.2.9456953 [DOI] [PubMed] [Google Scholar]
- 18.Bruegel M, Holzapfel K, Gaa J, Woertler K, Waldt S, Kiefer B, et al. Characterization of focal liver lesions by ADC measurements using a respiratory triggered diffusion-weighted single-shot echo-planar MR imaging technique. Eur Radiol 2008;18:477–85 10.1007/s00330-007-0785-9 [DOI] [PubMed] [Google Scholar]
- 19.Bammer R. Basic principles of diffusion-weighted imaging. Eur J Radiol 2003;45:169–84 [DOI] [PubMed] [Google Scholar]
- 20.Le Bihan D, Breton E, Lallemand D, Aubin ML, Vignaud J, Laval-Jeantet M. Separation of diffusion and perfusion in intravoxel incoherent motion MR imaging. Radiology 1988;168:497–505 [DOI] [PubMed] [Google Scholar]
- 21.Taouli B, Tolia AJ, Losada M, Babb JS, Chan ES, Bannan MA, et al. Diffusion-weighted MRI for quantification of liver fibrosis: preliminary experience. AJR Am J Roentgenol 2007;189:799–806 10.2214/AJR.07.2086 [DOI] [PubMed] [Google Scholar]
- 22.Taouli B, Koh DM. Diffusion-weighted MR imaging of the liver. Radiology 2010;254:47–66 10.1148/radiol.09090021 [DOI] [PubMed] [Google Scholar]
- 23.Taouli B, Chouli M, Martin AJ, Qayyum A, Coakley FV, Vilgrain V. Chronic hepatitis: role of diffusion-weighted imaging and diffusion tensor imaging for the diagnosis of liver fibrosis and inflammation. J Magn Reson Imaging 2008;28:89–95 10.1002/jmri.21227 [DOI] [PubMed] [Google Scholar]
- 24.Lewin M, Poujol-Robert A, Boëlle PY, Wendum D, Lasnier E, Viallon M, et al. Diffusion-weighted magnetic resonance imaging for the assessment of fibrosis in chronic hepatitis C. Hepatology 2007;46:658–65 10.1002/hep.21747 [DOI] [PubMed] [Google Scholar]
- 25.Koinuma M, Ohashi I, Hanafusa K, Shibuya H. Apparent diffusion coefficient measurements with diffusion-weighted magnetic resonance imaging for evaluation of hepatic fibrosis. J Magn Reson Imaging 2005;22:80–85 10.1002/jmri.20344 [DOI] [PubMed] [Google Scholar]
- 26.Agnello F, Ronot M, Valla DC, Sinkus R, Van Beers, Vilgrain V. High-b-value diffusion-weighted MR imaging of benign hepatocellular lesions: quantitative and qualitative analysis. Radiology 2012;262:511–19 10.1148/radiol.11110922 [DOI] [PubMed] [Google Scholar]
- 27.Cieszanowski A, Anysz-Grodzicka A, Szeszkowski W, Kaczynski B, Maj E, Gornicka B, et al. Characterization of focal liver lesions using quantitative techniques: comparison of apparent diffusion coefficient values and T2 relaxation times. Eur Radiol 2012;22:2514–24 [DOI] [PMC free article] [PubMed] [Google Scholar]
- 28.Kanematsu M, Goshima S, Watanabe H, Kondo H, Kawada H, Noda Y, et al. Detection and characterization of focal hepatic lesions with diffusion-weighted MR imaging: a pictorial review. Abdom Imaging 2013;38:297–308 10.1007/s00261-012-9940-0 [DOI] [PubMed] [Google Scholar]
- 29.Leconte I, Van Beers, Lacrosse M, Sempoux C, Jamart J, Materne R, et al. Focal nodular hyperplasia: natural course observed with CT and MRI. J Comput Assist Tomogr 2000;24:61–6 [DOI] [PubMed] [Google Scholar]
- 30.Kuo YH, Wang JH, Lu SN, Hung CH, Wei YC, Hu TH, et al. Natural course of hepatic focal nodular hyperplasia: a long-term follow-up study with sonography. J Clin Ultrasound 2009;37:132–7 10.1002/jcu.20533 [DOI] [PubMed] [Google Scholar]
- 31.Kwee TC, Takahara T, Koh DM, Nievelstein RA, Luijten PR. Comparison and reproducibility of ADC measurements in breathhold, respiratory triggered, and free-breathing diffusion-weighted MR imaging of the liver. J Mag Reson Imaging 2008;28:1141–8 10.1002/jmri.21569 [DOI] [PubMed] [Google Scholar]
- 32.Kartalis N, Loizou L, Edsborg N, Segersvärd R, Albiin N. Optimising diffusion-weighted MR imaging for demonstrating pancreatic cancer: a comparison of respiratory-triggered, free-breathing and breath-hold techniques. Eur Radiol 2012;22:2186–92 10.1007/s00330-012-2469-3 [DOI] [PubMed] [Google Scholar]


