

Abstract
Background: on an individual level, lower-income has been associated with disability, morbidity and death. On a population level, the relationship of economic indicators with health is unclear.
Objective: the purpose of this study was to evaluate relative fitness and frailty in relation to national income and healthcare spending, and their relationship with mortality.
Design and setting: secondary analysis of data from the Survey of Health, Ageing and Retirement in Europe (SHARE); a longitudinal population-based survey which began in 2004.
Subjects: a total of 36,306 community-dwelling people aged 50 and older (16,467 men; 19,839 women) from the 15 countries which participated in the SHARE comprised the study sample. A frailty index was constructed as the proportion of deficits present in relation to the 70 deficits available in SHARE. The characteristics of the frailty index examined were mean, prevalence of frailty and proportion of the fittest group.
Results: the mean value of the frailty index was lower in higher-income countries (0.16 ± 0.12) than in lower-income countries (0.20 ± 0.14); the overall mean frailty index was negatively correlated with both gross domestic product (r = −0.79; P < 0.01) and health expenditure (r = −0.63; P < 0.05). Survival in non-frail participants at 24 months was not associated with national income (P = 0.19), whereas survival in frail people was greater in higher-income countries (P < 0.05).
Conclusions: a country's level of frailty and fitness in adults aged 50+ years is strongly correlated with national economic indicators. In higher-income countries, not only is the prevalence of frailty lower, but frail people also live longer.
Keywords: ageing, frailty, Europe, SHARE, older people
Introduction
People today generally live longer and healthier lives than at any point in history [1]. This has engendered two related phenomena now affecting the global population. First, lower birth rates and higher life expectancy in many countries form a ‘demographic transition’ marking the ageing of national populations [2]. Secondly, achievements in health and longevity have caused a ‘disease transition’, wherein individuals accumulate and manage an increasing burden of age-associated, non-communicable diseases [3]. Together these transitions represent the beginning of an accelerating strain on social insurance and public health care systems [4]. Effective management will require further understanding of the determinants of the health of older adult populations and designing health systems appropriate to the needs of older adults, especially those with multiple, interacting medical and social problems.
In this regard, higher-income countries have expected advantages. Even so, the relationship between national wealth and health is complex [5]; gross domestic product (GDP) and healthcare spending per capita are only inconsistently related to life expectancy [6]. This inconsistency may be related to the heterogeneity of the health status of older adults in these populations. Among older adults in wealthy, developed countries, lower individual income has been variably associated with disability [7], disease-specific morbidity [8], cognitive decline [9], falls [10] and death [11]. These variable deficits, considered individually, can be variably present but on average, individuals accumulate health deficits at differing rates as they age, and these differences may be related to economic and social factors [12].
Elsewhere, a simple, widely validated means of summarising health status and its variability with age has been proposed [13]. That approach counts the deficits present in individuals and infers relative fitness or frailty on that basis, irrespective of the specific nature or combinations of deficits. The frailty index is the application of this approach and forms a state variable that captures the whole health of the individual. It has been shown to be a stronger predictor of mortality than chronological age [14, 15]. While properties of the frailty index are comparable across populations [16, 17], differences in the prevalence of frailty exist between countries [17–19]. These differences may be explained by socio-economic factors, especially as low individual income [20] and high social vulnerability [21] are associated with frailty. As health systems are responsible for an increasing proportion of frail older adults, it is important to examine whether this relationship between socio-economic factors and frailty at the level of the individual exists across populations as well. Investigating the determinants of frailty at the level of national populations would help policy-makers advance economic and social policies to benefit health in later life.
The Survey of Health, Ageing, and Retirement in Europe (SHARE) enables cross-country comparisons of the relationship between economic indicators and the health status of community-dwelling older adults. European countries are of particular interest in understanding the determinants of health of older adults, as Europe leads the demographic transition in population ageing; European nations have among the highest median ages, with one in five persons aged 60 or older [22]. Recent investigations further suggest that frailty may be more prevalent in European than North American populations [23]. The current study aimed to examine the relationship between national economic indicators and the health status of middle-aged and older adults in Europe. Our objectives were to evaluate health (measured by characteristics of the distribution of frailty) in relation to national income and healthcare spending and the relationship of these health and economic indicators with mortality.
Methods
This is a secondary analysis of the baseline data from the first and second SHARE waves (SHARE release 2.5.0 of 24 May 2011). SHARE began in 2004 and 37,546 people (16,590 men; 20,956 women) from probability samples in 15 countries participated in baseline interviews [wave 1: Austria, Belgium, Denmark, France, Germany, Greece, Italy, Netherlands, Spain, Sweden, Switzerland (2004–05), Israel (2005–06); wave 2: Czech Republic, Poland (2006–07), Ireland (2007)]. SHARE represents the non-institutionalised population aged 50 and older and their spouses/partners independent of age in all participating countries. We excluded spouses/partners below the age of 50 from the secondary analysis. Mortality data were obtained from the second (2006–07) and third waves (2008–09) of SHARE for all countries except Israel and Ireland.
Included economic indicators for each country were GDP per capita adjusted for purchasing power parity (constant 2005 international dollar) and healthcare expenditure as a percentage of GDP (World Bank data). For each country, we used economic indicators from the first year that data collection started for SHARE. The 15 included countries were categorised by GDP per capita as lower-income countries (GDP $14,652–$28,227) and higher-income countries (GDP $29,222–$41,137). The lower-income countries were those located in Southern and Eastern Europe (Greece, Italy, Spain, Israel, Czech Republic, Poland and Israel), and the higher-income countries were those located in Northern and Western Europe (Austria, Belgium, Denmark, France, Germany, Netherlands, Sweden, Switzerland and Ireland) [24]. Approval for secondary analyses came from the Research Ethics Committee of the Capital District Health Authority at Halifax, Nova Scotia, Canada.
A frailty index was constructed as the proportion of deficits present out of the 70 deficits available in the SHARE database. A deficit can be any symptom, sign, disease, disability or laboratory abnormality that is associated with age and adverse outcomes, present in at least 1% of the population, covers several organ systems and has no >5% missing data [25]. A recent study used a 40-item frailty index from SHARE [14]. The frailty index used here employed 70 measures from the physical health, behavioural risks, cognitive function, and mental health sections of the SHARE database (Supplementary data are available in Age and Ageing online, Appendix S1). These measures which were either binary, ordinal or continuous variables were mapped to a 0–1 interval (e.g. 0, 0.5, 1). Participants' frailty index scores were calculated by dividing the number of recorded deficits by the total number of measures (70 measures). For example, if 35 deficits were present the frailty index score would be 35/70 = 0.5. The frailty index's properties have been extensively cross-validated [13]. A score of 0.25 was considered the frailty cut-point score [26]. The fittest individuals were defined as those with a frailty index score of 0.03 or less (0–2 health deficits reported) [12]. The characteristics of the frailty index examined for each country were mean frailty index score, prevalence of frailty (proportion of people with a frailty index score of 0.25 or greater) and proportion of the fittest group (people with a frailty index score of 0.03 or less).
Statistical analysis
Associations between mean frailty index score and national economic indicators were examined using Pearson correlation coefficients. The prevalence of frailty and the proportion of the fittest group were compared between the lower- and higher-income countries. Death rates at 24 months were calculated for each country and Kaplan–Meier survival curves were generated. We evaluated survival in relation to the frailty index for each country using the Cox proportional hazard models adjusted by age and sex. To control for differences in institutionalisation rates across European countries, we also analysed data from those aged 50–64 years old, where institutionalisation is uncommon. Calibration weights were used to reflect the size of the national population by age and sex. The statistical significance level was set to 0.05. All calculations were performed using the SPSS software (version 19).
Results
The age of the included participants and the percentage of women were similar (P > 0.05) in the lower- (65.0 ± 0.78 years, 55.0% women) and higher-income countries (65.0 ± 0.63 years, 54.2% women) (Supplementary data are available in Age and Ageing online, Appendix S2). GDP (r = −0.79, P < 0.001; Figure 1) and healthcare expenditure (r = −0.63, P < 0.05) were negatively correlated with each country's mean frailty index. When only those aged 50–64 years were included in the analysis, GDP (r = −0.71, P < 0.01) and health-care expenditure (r = −0.63, P < 0.05) remained negatively correlated with each country's mean frailty index.
Figure 1.

Relationship between GDP per capita (PPP) and mean frailty index.
At all ages, the mean frailty index was greater in women than in men regardless of country. Every additional year of age was associated with a 3.5 and 2.8% higher mean frailty index in lower- and higher-income countries, respectively. The prevalence of frailty was lower (16.1 versus 27.6%; P < 0.01; Figure 2) and that of fitness was higher (7.2 versus 4.0%; P < 0.05; Supplementary data are available in Age and Ageing online, Appendix S3) in higher-income countries. The demographic characteristics of frail people were similar (P > 0.05) in the lower- (72.0 ± 1.98 years, 68.4% women) and higher-income countries (72.8 ± 1.44 years, 70.0% women). In contrast, the fittest group in higher-income countries was older (58.1 ± 0.70 versus 56.7 ± 1.18 years; P < 0.05) and with a greater proportion of women (41.3 versus 32.7%; P < 0.01).
Figure 2.

Prevalence of frailty by country.
Death rates were negatively correlated with each country's GDP (r = −0.80, P < 0.01) and health expenditure (r = −0.67, P < 0.05). In higher-income countries, the death rate across all participants was 3.3%, whereas in lower-income countries it was 6.3%. For non-frail participants, death rates were 1.9% for both lower- and higher-income countries. For frail participants, death rates were 11.6% in the lower-income countries and 10.5% in the higher-income countries. Survival in non-frail participants was greater than in frail participants in both lower- and higher-income countries (Figure 3). Survival in non-frail participants was not associated with national income (log-rank Chi-square = 1.69, P = 0.19), but survival in frail people was greater in higher-income countries than in lower-income countries (log-rank Chi-square = 3.69, P < 0.05; Figure 3). When only those aged 50–64 years were included in the analysis, survival in non-frail participants remained unassociated with national income (log-rank Chi-square = 0.58, P = 0.45) whereas the difference in the survival of the frail participants in lower- and higher-income countries was close to reaching significance (log-rank Chi-square = 3.55, P = 0.06). Adjusting for age and sex, a higher frailty index score was associated with a greater risk of death in all countries (P < 0.001) (Supplementary data are available in Age and Ageing online, Appendix S4). This association was similar in the higher- (adjusted HR: 1.05; 95% CI: 1.04–1.06) and lower-income countries (adjusted HR: 1.05; 95% CI: 1.05–1.06).
Figure 3.
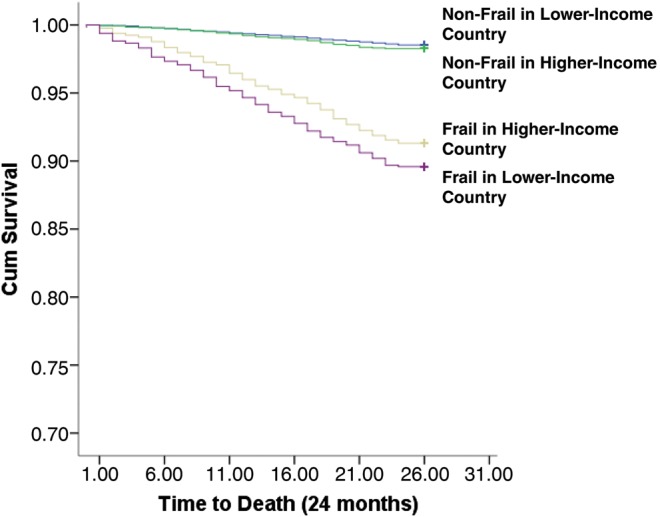
Survival at 24 months for frail and non-frail groups in lower- and higher-income countries.
Discussion
This secondary analysis of a large, representative data set of 15 European countries showed a strong relationship between national economic indicators and the health status of middle-aged and older adult populations, as measured by a frailty index. It also helps to clarify the often ambiguous relationship between national income and health. Lower-income countries had lower health care expenditure and demonstrated higher levels of frailty and lower levels of fitness when compared with the higher-income countries. Survival in non-frail participants was not related to national income; however, survival in frail people was greater in higher-income countries. The ability to compare the rate and prevalence of accumulated health deficits across many countries using the same frailty measure contributes to better understanding the determinants of the health of older adult populations, and further clarifies the relationship between national income and population health.
Our findings must be interpreted with caution. As the sample only includes community-dwelling participants, institutionalised older adults in each country are excluded. As institutionalisation practices may vary by country, this would affect the health status of the community-dwelling population in each country. Even so, we found similar results in people aged 50–64 years, who would not be affected by differences in institutionalisation practices. As the frailty index used in these analyses incorporated only self-reported deficits, there may be differences between countries based on cultural attitudes towards illness and health, regional variations in health literacy or diagnosis frequencies independent of the health status.
The characteristics of the frailty index across the countries studied here are comparable with findings from different nationally representative samples. Mitnitski et al. [17] reported that among seven community-based studies in Canada, Australia, the USA and Sweden deficits were found to accumulate on average at 2.9%/year. This is comparable with the higher-income countries presented here (2.8%/year). In China, the frailty index increased at 3.9%/year [19], comparable with the lower-income countries presented here (3.5%/year). Our results are also consistent with a recent study using a 40-item frailty index from SHARE, which showed that a higher frailty index score is associated with higher mortality and that the frailty index is greater in women than in men [14].
Another study from SHARE database, but with fewer countries, used the phenotypic approach to measure frailty and found that its prevalence was greater in women and in southern European countries [23]. The prevalence of frailty reported in that study was almost 50% lower than the prevalence we have estimated. This difference, which has been noted in other studies [27, 28], is not surprising considering the major differences between the two operational definitions of frailty. Although there is debate about the nature and measurement of frailty, a recent systematic review concluded that the frailty index seems to be the most suitable instrument to evaluate outcome measures in frailty research [29].
This is the first study to suggest that variability in the accumulation of age-associated health deficits may be explained, in part, by differences in environmental and particularly socio-economic factors. In higher-income countries, not only is the prevalence of frailty lower, but frail people also live longer. This might be because frail people in lower-income countries are exposed to different environmental and social insults in addition to limited access to high-quality health care while health and social systems in wealthier countries can support individuals in managing multiple problems. While this study of the relationship between economic resources and frailty on a population level is novel, there have been limited studies on the contribution of economic resources to frailty. The cross-sectional nature of the data used here limit potential conclusions as to causality of the associations observed. In particular, the possibility of reverse causation is non-trivial; that is, better health has also been found to be related to economic prosperity in these countries [30]. Understanding of the specific mechanisms influencing the health status of older adult populations is vital.
The findings of this study have potential implications for health policy and clinical practice. As the health of populations is linked with economic prosperity, and vice versa, investment in policies which promote access to income and health may limit the burden of frailty on national health care systems. Lower-income countries should focus their resources on this vulnerable population. While our study focused on population health, considering the social and economic issues facing frail older adults might influence clinical decisions about the course of their care. Future studies should focus not only on factors that contribute to lengthening survival, but improving the quality of life of frail older adults. One important aspect of this may be the relative proportion of public and private financing that makes up health-care expenditure. Further, economic changes in Europe since SHARE data collection began may have influenced levels of frailty in these countries. Future studies should investigate potential consequences of these recent developments.
Key points.
On a population level, the relationship of economic indicators with health is unclear.
A strong relationship exists between national economic indicators and a country's level of frailty and fitness.
In higher-income countries, not only is the prevalence of frailty lower, but frail people also live longer.
Conflicts of interest
None declared.
Funding
This paper uses data from SHARELIFE release 1, as of 24 November 2010 or SHARE release 2.5.0, as of 24 May 2011. The SHARE data collection has been primarily funded by the European Commission through the 5th framework programme (project QLK6-CT-2001- 00360 in the thematic programme Quality of Life), through the 6th framework programme (projects SHARE-I3, RII-CT- 2006-062193, COMPARE, CIT5-CT-2005-028857 and SHARELIFE, CIT4-CT-2006-028812) and through the 7th framework programme (SHARE-PREP, 211909 and SHARE-LEAP, 227822). Additional funding from the U.S. National Institute on Aging (U01 AG09740-13S2, P01 AG005842, P01 AG08291, P30 AG12815, Y1-AG-4553-01 and OGHA 04-064, IAG BSR06-11, R21 AG025169) as well as from various national sources is gratefully acknowledged (see www.share-project.org for a full list of funding institutions). O.T. is supported by the Dalhousie University Internal Medicine Research Foundation. K.R. receives funding from the Dalhousie Medical Research Foundation as Kathryn Allen Weldon Professor of Alzheimer Research. K.R. and A.M. are supported by operating grants from the Canadian Institutes of Health Research.
Conflicts of interest
K.R. and A.M. are applying for funding to commercialize a version of the Frailty Index based on a comprehensive geriatric assessment.
Supplementary data
Supplementary data mentioned in the text is available to subscribers in Age and Ageing online.
References
- 1.Vaupel JW. Biodemography of human ageing. Nature. 2010;464:536–42. doi: 10.1038/nature08984. [DOI] [PMC free article] [PubMed] [Google Scholar]
- 2.Lee R. The demographic transition: three centuries of fundamental change. J Econ Perspect. 2003;17:167–90. [Google Scholar]
- 3.Orman AR. The epidemiologic transition: a theory of the epidemiology of population change. Milbank Q. 2005;49:509–38. [PubMed] [Google Scholar]
- 4.Organization for Economic Co-operation and Development. Value for Money in Health Spending, OECD Health Policy Studies. OECD Publishing; Paris, France,; 2010. [Google Scholar]
- 5.Preston SH. The changing relation between mortality and level of economic development. Popul Stud (Camb) 1975;29:231–41. [PubMed] [Google Scholar]
- 6.Skolnik R. Health Determinants, Measurements, and Trends. Global Health 101. 2nd edition. Burlington: MA: Jones & Bartlett; 2012. [Google Scholar]
- 7.McMunn A, Nazroo J, Breeze E. Inequalities in health at older ages: a longitudinal investigation of the onset of illness and survival effects in England. Age Ageing. 2009;38:181–7. doi: 10.1093/ageing/afn236. [DOI] [PMC free article] [PubMed] [Google Scholar]
- 8.Grundy E, Sloggett A. Health inequalities in the older population: the role of personal capital, social resources and socio-economic circumstances. Soc Sci Med. 2003;56:935–47. doi: 10.1016/s0277-9536(02)00093-x. [DOI] [PubMed] [Google Scholar]
- 9.Koster A, Pennix B, Bosma H, et al. Socioeconomic differences in cognitive decline and the role of biomedical factors. Ann Epidemiol. 2005;15:564–71. doi: 10.1016/j.annepidem.2005.02.008. [DOI] [PubMed] [Google Scholar]
- 10.Gill T, Taylor AW, Pengelly A. A population-based survey of factors relating to the prevalence of falls in older people. Gerontology. 2005;51:340–5. doi: 10.1159/000086372. [DOI] [PubMed] [Google Scholar]
- 11.Mishra GD, Ball K, Dobson AJ, et al. Do socioeconomic gradients in women's health widen over time and with age? Soc Sci Med. 2004;58:1585–95. doi: 10.1016/S0277-9536(03)00368-X. [DOI] [PubMed] [Google Scholar]
- 12.Rockwood K, Song X, Mitnitski A. Changes in relative fitness and frailty across the adult lifespan: evidence from the Canadian National Population Health Survey. CMAJ. 2011;183:E487–94. doi: 10.1503/cmaj.101271. [DOI] [PMC free article] [PubMed] [Google Scholar]
- 13.Rockwood K, Mitnitski A. Frailty defined by deficit accumulation and geriatric medicine defined by frailty. Clin Geriatr Med. 2011;27:17–26. doi: 10.1016/j.cger.2010.08.008. [DOI] [PubMed] [Google Scholar]
- 14.Romero-Ortuno R, Kenny RA. The frailty index in Europeans: association with age and mortality. Age Ageing. 2012;41:684–9. doi: 10.1093/ageing/afs051. [DOI] [PMC free article] [PubMed] [Google Scholar]
- 15.Theou O, Rockwood K. Should frailty status always be considered when treating the elderly patient? Aging Health. 2012;8:261–71. [Google Scholar]
- 16.Dupre ME, Gu D, Warner DF, et al. Frailty and type of death among older adults in China: prospective cohort study. BMJ. 2009;338:b1175. doi: 10.1136/bmj.b1175. [DOI] [PMC free article] [PubMed] [Google Scholar]
- 17.Mitnitski A, Song X, Skoog I, et al. Relative fitness and frailty of elderly men and women in developed countries and their relationship with mortality. J Am Geriatr Soc. 2005;53:2184–9. doi: 10.1111/j.1532-5415.2005.00506.x. [DOI] [PubMed] [Google Scholar]
- 18.Gu D, Dupre ME, Sautter J, et al. Frailty and mortality among Chinese at advanced ages. J Gerontol B Psychol Sci Soc Sci. 2009;64:279–89. doi: 10.1093/geronb/gbn009. [DOI] [PMC free article] [PubMed] [Google Scholar]
- 19.Shi J, Song X, Yu P, et al. Analysis of frailty and survival from late middle age in the Beijing Longitudinal Study of Aging. BMC Geriatr. 2011;11:17. doi: 10.1186/1471-2318-11-17. [DOI] [PMC free article] [PubMed] [Google Scholar]
- 20.Szanton SL, Seplaki CL, Thorpe RJ, Jr, et al. Socioeconomic status is associated with frailty: the Women's Health and Aging Studies. J Epidemiol Community Health. 2010;64:63–7. doi: 10.1136/jech.2008.078428. [DOI] [PMC free article] [PubMed] [Google Scholar]
- 21.Andrew MK, Mitnitski AB, Rockwood K. Social vulnerability, frailty and mortality in elderly people. PLoS One. 2008;3:E2232. doi: 10.1371/journal.pone.0002232. [DOI] [PMC free article] [PubMed] [Google Scholar]
- 22.United Nations, Department of Economic and Social Affairs, Population Division. 2011. World Population 2010 (Wall Chart) ST/ESA/SER.A/307.
- 23.Santos-Eggiman B, Cuénoud P, Spagnoli J, et al. Prevalence of frailty in middle-aged and older community-dwelling Europeans living in 10 countries. J Gerontol A Biol Sci Med Sci. 2009;64:675–81. doi: 10.1093/gerona/glp012. [DOI] [PMC free article] [PubMed] [Google Scholar]
- 24.United Nations Statistics Division. Composition of Macro Geographical (continental) Regions, Geographical Sub-regions, and Selected Economic and Other Groupings. 2011. http://unstats.un.org/unsd/methods/m49/m49reg.htm . (14 December 2012, date last accessed) [Google Scholar]
- 25.Searle SD, Mitnitski A, Gahbauer EA, et al. A standard procedure for creating a frailty index. BMC Geriatr. 2008;8:24. doi: 10.1186/1471-2318-8-24. [DOI] [PMC free article] [PubMed] [Google Scholar]
- 26.Rockwood K, Andrew M, Mitnitski A. A comparison of two approaches to measuring frailty in elderly people. J Gerontol A Biol Sci Med Sci. 2007;62:738–43. doi: 10.1093/gerona/62.7.738. [DOI] [PubMed] [Google Scholar]
- 27.Kulminski AM, Ukraintseva SV, Kulminskaya IV, et al. Cumulative deficits better characterize susceptibility to death in elderly people than phenotypic frailty: lessons from the Cardiovascular Health Study. J Am Geriatr Soc. 2008;56:898–903. doi: 10.1111/j.1532-5415.2008.01656.x. [DOI] [PMC free article] [PubMed] [Google Scholar]
- 28.Theou O, Rockwood MR, Mitnitski A, et al. Disability and co-morbidity in relation to frailty: how much do they overlap? Arch Gerontol Geriatr. 2012;55:e1–e8. doi: 10.1016/j.archger.2012.03.001. [DOI] [PubMed] [Google Scholar]
- 29.de Vries NM, Staal JB, van Ravensberg CD, et al. Outcome instruments to measure frailty: a systematic review. Ageing Res Rev. 2011;10:104–14. doi: 10.1016/j.arr.2010.09.001. [DOI] [PubMed] [Google Scholar]
- 30.Suhrcke M, McKee M, Sauto Arce R, et al. The contribution of health to the economy in the European Union. Public Health. 2006;120:994–1001. doi: 10.1016/j.puhe.2006.08.011. [DOI] [PubMed] [Google Scholar]
Associated Data
This section collects any data citations, data availability statements, or supplementary materials included in this article.