Abstract
We designed and fabricated microfluidic devices with serpentine separation channels and asymmetrically tapered turns, thus allowing high efficiency separations and minimizing band broadening associated with the “racetrack” effect. We evaluated the performance of these devices by measuring the variation in separation efficiency with separation length, electric field strength, taper ratio of the turns, and number of turns. N-Glycans derived from ribonuclease B (RNase B) and labeled with 8-aminopyrene-1,3,6-trisulfonic acid were electrophoretically separated on serpentine channels with separation lengths of 11, 18, 22, and 36 cm at electric field strengths from 750 to 1750 V/cm. Separations on the 36-cm channel produced plate numbers up to 940,000 with an analysis time under 3.1 min, whereas separations on the 22-cm channel had a shorter analysis time (less than 1.25 min), still with respectable efficiencies (up to 600,000 plates). Turn-induced dispersion was minimized with taper ratios 2 and 3, whereas having two or four 180° turns along the separation length did not impact the overall efficiency. The developed device was used to analyze native and desialylated N-glycans derived from the blood serum of an ovarian cancer patient and a disease-free individual. Separation efficiencies similar to that achieved with the model glycans from RNase B were attained for these biological samples.
Keywords: microchip electrophoresis, asymmetric turns, serpentine microchannels, N-glycans, ovarian cancer
1 Introduction
Glycans have long been viewed as essential parts of biomolecules for many living organisms, and more recently, are receiving substantial attention because alteration in the glycosylation of proteins has been implicated in many inflammatory diseases and cancer [1–6]. Glycan-protein and glycan-glycan interactions are fundamentally important in protein structure modulation and localization, transporting signals in multicellular systems, and cell-cell recognition, including bacterial and viral infections and cancer pathogenesis [7–9]. The field of analytical glycobiology has recently begun to focus on the quantitative aspects of glycan substitution and structure.
Many glycans have high molecular masses and complex chemical structures stemming from their vast diversity in composition, branching, and linkages. A small change in these structures may be indicative of significant pathological alterations. Recent studies on the glycan structures found in complex biological mixtures, such as physiological fluids [10–12], illustrate the demand for separation methods with excellent structural resolution and detection and measurements at high sensitivity. Chromatographic modes of separation, including reversed phase and hydrophilic interactions, as well as ion-exchange chromatography, have been used for carbohydrate determinations [13]. Capillary electrophoresis [14–17] and electrochromatography [18–22] have also been applied to the separation of glycans and other glycoconjugates. More recently, capillary electrophoresis combined with mass spectrometry [23] has been used in several applications because of high separation efficiency, ability to resolve structural isomers, and provide direct mass and structural information at high sensitivity.
Microfluidic devices have also been demonstrated in separating glycan mixtures [24–26] with the benefits of shorter analysis times and a more precise sample introduction. These studies showed lower separation efficiencies compared to capillary separations, which occurred primarily due to the shorter channel lengths. To increase the component resolution for these microfluidic separations, longer separation channels need to be fabricated on microchips where turns must be integrated in the channels without introducing significant sample dispersion, i.e., the “racetrack” effect. A spiral channel is one such design that minimizes turn-induced band broadening by incorporating large radius turns [27]. Previously, we reported high efficiency electrophoretic separations of N-glycans on a 22-cm spiral microchannel [28] and demonstrated comparable performance to conventional capillary electrophoresis, but with shorter analysis times. Serpentine channels with symmetric [29] and asymmetric [30, 31] turns not only minimize turn-induced dispersion but also reduce the device footprint. Consequently, serpentine channels can easily be multiplexed [32] to increase the sample throughput, and additional separation length can be incorporated without substantially increasing the overall device size.
In this study, we designed and fabricated microfluidic devices with serpentine separation channels and asymmetric turns that have taper ratios of 1, 2, and 3. We define the taper ratio as the ratio of the width of the straight channel (straight width) to the width of the channel in the turn (turn width). The primary goals of this study were (i) to evaluate the contribution of different taper ratios to band dispersion, (ii) to push separations of N-glycans to higher electric field strengths and longer separation lengths, and (iii) to demonstrate that separations of clinically relevant N-glycan samples had similar efficiencies as the model samples. We show that serpentine channels with turn taper ratios 2 and 3 did not exhibit a substantial “racetrack” effect, excellent separation efficiencies were achieved at 750–1750 V/cm field strengths, and 22- and 36-cm long serpentine channels allowed analysis times less than 1.25 and 3.1 min, respectively.
2 Materials and Methods
2.1 Materials
We purchased acetic acid, acetonitrile (ACN), ammonium bicarbonate, ammonium persulfate, citric acid, dimethylsulfoxide (DMSO), 4-(2-hydroxyethyl)-1-piperazine-ethanesulfonic acid (HEPES), β-mercaptoethanol, γ-methacryloxypropyltrimethoxysilane (MAPTOS), methanol, methylene dichloride, potassium phosphate monobasic, ribonuclease B (RNase B), sodium cyanoborohydride, N,N,N’,N’-tetramethylethylenediamine (TEMED), and trifluoroacetic acid (TFA) from Sigma-Aldrich (St Louis, MO); sodium hydroxide from Fisher Scientific (Pittsburgh, PA); high-purity 8-aminopyrene-1,3,6-trisulfonic acid (APTS) from Beckman Coulter, Inc. (Brea, CA) ; peptide-N-glycosidase F (PNGase F) of Chryseobacterium menigosepticum (EC 3.2.2.18) from Northstar BioProducts (East Falmouth, MA); sialidase from ProZyme, Inc. (Hayward, CA); Microposit MF-319 developer from Rohm and Haas Electronic Materials (Midland, MI); Chromium Etchant 1020 and 8002-A, and buffered oxide etchant (BOE) from Transene Co. (Danvers, MA); 353NDT Epoxy from Epoxy Technology (Billerica, MA); and B270 glass substrates and cover plates from Telic Co. (Valencia, CA).
2.2 Microfluidic device fabrication and channel coating
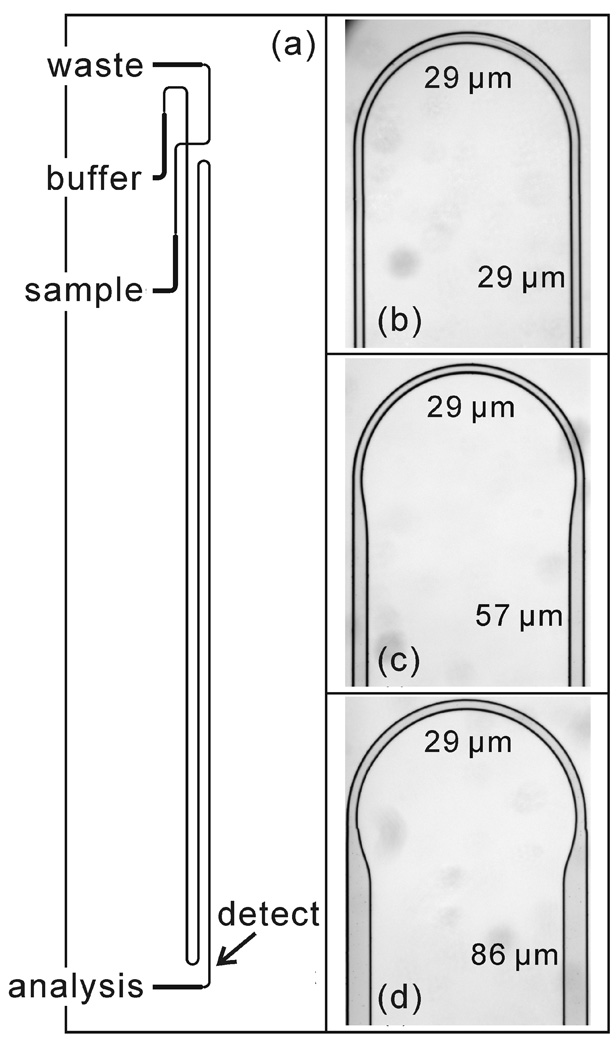
Microfluidic devices, similar in design to what is depicted in Figure 1a, were fabricated from B270 glass substrates coated with Cr and AZ1518 photoresist as described previously [33]. The substrates were exposed to UV radiation (365 nm, 200 mJ/cm2) through a photomask (HTA Photomask, San Jose, CA) on a mask aligner (205S, Optical Associates, Inc., San Jose, CA), developed for 2 min in MF-319 developer, and rinsed with water. After development, the channel pattern was transferred to the chromium layer by etching in Cr Etchant 8002-A, and subsequently, to the glass layer by etching in BOE until the channels were 15 µm deep. Channel dimensions were measured using a stylus-based profiler (Dektak 6M, Veeco Instruments, Inc., Plainview, NY), which are listed in Table 1. Fluid access holes were sandblasted at the ends of the channels (AEC Air Eraser, Paasche Airbrush Co., Chicago, IL). Following sandblasting, the unexposed photoresist layer was removed by rinsing in acetone for 2 min, after which the remaining Cr layer was removed in Cr Etchant 1020. The drilled substrate was then bonded to a cover plate by hydrolyzing both pieces in a solution of NH4OH, H2O2, and H2O (2:1:2) and bringing the substrate and coverplate into contact prior to annealing at 545° C for 10 h. Short segments of glass tubing (6 mm o.d. x 4 mm i.d. x 6 mm tall) were affixed over the sandblasted holes with 353NDT epoxy.
Figure 1.
(a) Photomask design of a microfluidic device (serp-22-1-2) with a 22-cm serpentine separation channel and two 180° turns with taper ratio 1. See Tables 1 and 2 for device dimensions and details. White light images of asymmetrically tapered, 180° turns with taper ratios (b) 1, (c) 2, and (d) 3.
Table 1.
Channel widths, taper ratios of 180° turns, and injection lengths.
| Taper ratio of 180° turns |
|||
|---|---|---|---|
| 1 | 2 | 3 | |
| Channels on photomask | |||
| Straight width (µm) | 5 | 33 | 62 |
| Turn width (µm) | 5 | 5 | 5 |
| Channels after etching | |||
| Straight width (µm) | 29 | 57 | 86 |
| Turn width (µm) | 29 | 29 | 29 |
| Taper ratio | 1.0 | 2.0 | 3.0 |
| Injection lengtha) (µm) | 43 | 71 | 106 |
Injection length is based on the straight channel width at the cross intersection and increases with taper ratio.
The microchannels were coated with linear poly(acrylamide) to minimize electroosmotic flow and to prevent analyte adsorption to the channel walls. The microchannels were cleaned sequentially with 1.0 M sodium hydroxide solution, water, and methanol for 20 min each. The microchannels were then filled with a solution of 45 µL MAPTOS dissolved in 1.5 mL methylene dichloride with 0.02 M acetic acid. After 45 min, the microchannels were rinsed with methanol and water for 15 min each to remove residual silane solution. The channels were then filled with an aqueous solution containing 2.4% (w/w) acrylamide, 1.0 µL/mL TEMED, and 1.0 mg/mL ammonium persulfate. After 2 h, the microchannels were flushed with water for 20 min and filled with the separation buffer.
2.3 N-glycan sample preparation and desialylation
N-glycans were cleaved from RNase B and glycoproteins in the blood sera of an ovarian cancer patient and a disease-free individual with PNGase F [28] and subsequently labeled with APTS [34]. For the RNase B samples, 1-µg amounts of dried glycoprotein were suspended in 2.5 µL of phosphate buffer (pH 7) with 1% β-mercaptoethanol and denatured at 95 °C for 10 min. The solution was cooled to room temperature, and a 0.5-µL aliquot of PNGase in phosphate buffer was added. The reaction mixture was incubated overnight at 37 °C.
For the serum samples, a 10-µL aliquot of human blood serum was lyophilized and then resuspended in 100 µL of 25 mM ammonium bicarbonate. All serum samples were lyophilized to prevent degradation during storage and to maintain a consistent sample processing protocol. Next, a 5 mU aliquot of PNGase F was added to the reaction mixture and incubated overnight (18–22 h) at 37 °C. Deionized water was then added to the enzymatically released glycans to bring the total volume of the reaction mixture to 1 mL. Samples were then applied to both C18 Sep-Pak® cartridges (Waters, Milford, MA) and activated carbon cartridges (Harvard Apparatus, Holliston, MA). The use of C18 Sep-Pak® cartridges is necessary to isolate the glycans from peptides and proteins, which would otherwise interfere with trapping on the activated carbon cartridges. The reaction mixture was first applied to C18 Sep-Pak® cartridge that had been preconditioned with ethanol and deionized water, as recommended by the manufacturer. The reaction mixture was circulated through the C18 Sep-Pak® cartridge 5-times prior to washing with water. Peptides and O-linked glycopeptides were retained on the C18 Sep-Pak® cartridge, while the released glycans were collected as eluent. Next, the C18 Sep-Pak® cartridge was washed with 1 mL of deionized water. The combined eluents containing the released N-glycans were then passed over activated carbon microcolumns. The columns were preconditioned with 1 mL of ACN and 1 mL of 0.1% TFA aqueous solution, as recommended by the manufacturer. After applying the sample, the microcolumn was washed with 1 mL of 0.1% TFA aqueous solution. The samples were then eluted with a 1-mL aliquot of 50% ACN aqueous solution containing 0.1% TFA. Finally, the purified glycans were evaporated to dryness with a vacuum CentriVap Concentrator (Labconco Corporation, Kansas City, MO).
Additionally, the N-glycan samples derived from the blood serum samples were desialylated with sialidase. The glycans were lyophilized and then resuspended in 10 mM phosphate buffer (pH 6). A 0.2-µL aliquot of sialidase was added, and the mixture was incubated at 37 °C for 6 h. The desialylated glycans were dried prior to APTS derivatization.
The native and desialylated glycans were labeled with APTS by adding a 2-µL aliquot of 100 µM APTS solution prepared in 0.9 M citric acid and a 1-µL aliquot of 1 M sodium cyanoborohydride prepared in DMSO. The reaction was allowed to proceed for 2 h at 55 °C. The derivatization mixture was dialyzed overnight at room temperature with a 1000-Da cut-off cellulose membrane to reduce the amount of unreacted APTS. Finally, the dialyzed mixture was dried and resuspended in 15 µL of 1 mM phosphate and 20 mM HEPES buffer (pH 6.8) prior to electrophoretic analysis.
2.4 Microchip electrophoresis
For the electrophoretic separations, a power supply with independent high-voltage outputs sourced the potentials to the sample, buffer, and waste reservoirs. The power supply consisted of a single 10-kV voltage source (10A12-P4-M-C, UltraVolt, Inc., Ronkonkoma, NY) and pairs of optical resistors (OC100, Voltage Multipliers, Inc., Visalia, CA) used as voltage dividers to establish the output potentials. A commercial high-voltage power supply (0–30 kV; CZE 1000R, Spellman High Voltage Electronics Corp., Hauppauge, NY) was used to supply the potential applied to the analysis reservoir. Applied potentials were controlled with a LabView program and an analog output board (PCI-6713, National Instruments Corp., Austin, TX). Electric field strengths of 750–1750 V/cm in the analysis channel were used to evaluate the separation performance of the microfluidic devices. Standard pinched injections [35] were used to introduce sample into the analysis channel. At the highest applied potentials (30 kV applied to the analysis reservoir), a 20-ms delay was inserted between sample loading and injection to minimize high voltage transients when the potentials applied to the sample, buffer, and waste reservoirs were switched from positive to negative values. The buffer used for the microchip separations was 1 mM phosphate and 20 mM HEPES (pH 6.8). The resistivity of the buffer solution in the microchannels was evaluated by applying potentials from 2–28.5 kV and measuring the current with a picoammeter (6485, Keithley Instruments, Inc., Cleveland, OH).
Separations at a single point in the analysis channel were monitored with an inverted optical microscope (TE-2000U, Nikon, Inc., Melville, NY) equipped with a 20x objective and an HQ FITC filter cube (Chroma Technology Corp., Bellows Falls, VT). The 488-nm line of an argon ion laser (CVI Melles Griot, Inc., Carlsbad, CA) was attenuated to 1.0 mW with neutral density filters and focused to a point in the analysis channel. The fluorescence signal was spatially filtered with a 600-µm pinhole, detected with a photomultiplier tube (H5783-01, Hamamatsu Corp., Bridgewater, NJ), amplified by a low-noise current preamplifier (SR570, Stanford Research Systems, Inc., Sunnyvale, CA), and recorded with a multifunction data acquisition board (PCI-6032E, National Instruments Corp.) and the software written with LabView. The sampling frequency was 100 Hz. To determine separation efficiencies, the data for selected peaks were fitted with a Gaussian function in OriginPro 7.5 software (OriginLab Corp., Northampton, MA). The peak parameters were then used to calculate the velocity, plate height, and plate number (separation efficiency).
3 Results and Discussion
3.1 Turn and channel designs
The asymmetrically tapered turns were designed similar to those described previously [30, 31]. The inside wall of the 180° turns with taper ratios 2 and 3 were constructed from three arcs that were tangent to one another to provide a smooth transition from the wide straight channel to the narrow turn channel [31]. The first arc reduced the channel width from the wide straight channel to the narrow turn channel. The second arc maintained the narrow turn width. The third arc mirrored the first arc and increased the channel width from the turn channel to the straight channel. The first and third arcs were 300 µm long. The turn radii were 0.5 mm, and thus, the straight channels were spaced 1 mm center-to-center.
The glass substrates etched isotropically with wet chemical etching, and consequently, the channel width depended on the etch rate and time. We defined the average width of an etched channel, wavg, as
| (1) |
where wph is the channel width on the photomask and d is the channel depth. The channel widths on the photomask were designed such that with a channel depth of 15 µm, the straight channel widths to turn channel widths have taper ratios of 1, 2, and 3. On the photomask, the turn width for the three taper ratios was 5 µm, and the straight widths were 5, 33, and 62 µm to produce taper ratios 1, 2, and 3, respectively, after etching. The channel widths for the photomasks and etched channels are summarized in Table 1, and bright-field images of turns with taper ratios 1, 2, and 3 are shown in Figure 1b–d.
To evaluate the impact of taper ratio on dispersion, we fabricated devices with 22-cm serpentine channels, two 180° turns, and taper ratios 1, 2, and 3. A schematic of the device with the 22-cm serpentine channel is shown in Figure 1. In addition, devices were fabricated with serpentine channels that were 11-cm long with two turns, 18-cm long with four turns, and 36-cm long with four turns to test how the separation length and number of turns influenced performance. These devices were similar in design to Figure 1a. The microchip designs, taper ratios, number of turns, and effective separation lengths are summarized in Table 2.
Table 2.
Device names, separation lengths, taper ratios, and number of 180° turns.
| Devicea) | Separation length (cm) |
Taper ratio | Number of 180° turns |
|---|---|---|---|
| serp-22-1-2 | 21.6 | 1 | 2 |
| serp-22-2-2 | 21.6 | 2 | 2 |
| serp-22-3-2 | 21.6 | 3 | 2 |
| serp-11-3-2 | 11.0 | 3 | 2 |
| serp-18-3-4 | 18.2 | 3 | 4 |
| serp-36-3-4 | 35.8 | 3 | 4 |
| spiral-22 | 22.0 | – | – |
Device names are “channel design – separation length – taper ratio – number of turns” for the serpentine (serp) and spiral channel designs.
3.2 Turn-induced sample dispersion
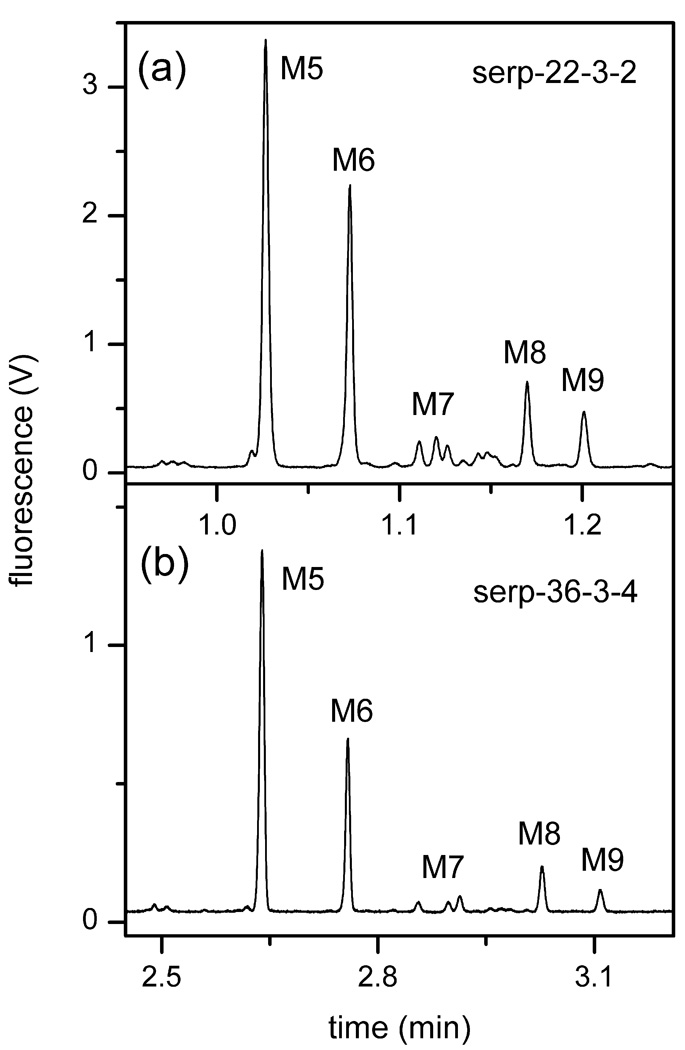
N-Glycans derived from RNase B were analyzed to evaluate the separation performance of the devices listed in Table 2. Figure 2 depicts electropherograms acquired with the 22-cm serpentine channel (serp-22-3-2) at 1530 V/cm and 36-cm serpentine channel (serp-36-3-4) at 990 V/cm. Applied field strengths for separations on the 36-cm channel were limited to 990 V/cm because of the maximum output of the power supplies. However, we were able to achieve baseline resolution for the structural isomers of mannose 7 and 8 on the 36-cm channel, but not on the 22-cm channel. Of note, samples prepared similarly, but stored for longer periods of time exhibited a decrease in the ratio of peak area for mannose 9 (M9) to mannose 5 (M5). For example, the electropherograms in Figure 2 were obtained ~6 months apart, and the M9-M5 ratio decreased from 0.15 in Figure 2a to 0.08 in Figure 2b. From the electropherograms, the plate heights of mannose 5, 6, and 9 were calculated and plotted as a function of the analyte velocity. These data are also compared to our previous work on the 22-cm spiral separation channel [28]. The primary difference is that field strengths of 750–1750 V/cm were applied on the serpentine channels, compared to 75–750 V/cm for the spiral channels. Overall, the data in Figure 3 for the serpentine channel devices had relative standard deviations (RSDs) of 0.36% (n = 106) for the migration velocity and 4.6% (n = 106) for the peak variance.
Figure 2.
Electropherograms of the N-glycans derived from RNase B separated on serpentine channels (a) 22-cm long (serp-22-3-2) and (b) 36-cm long (serp-36-3-4). The separation field strengths on serp-22-3-2 and serp-36-3-4 were 1530 and 990 V/cm, respectively. See Table 2 for device details. The labeled peaks are mannose 5 (M5), mannose 6 (M6), mannose 7 (M7), mannose 8 (M8), and mannose 9 (M9).
Figure 3.
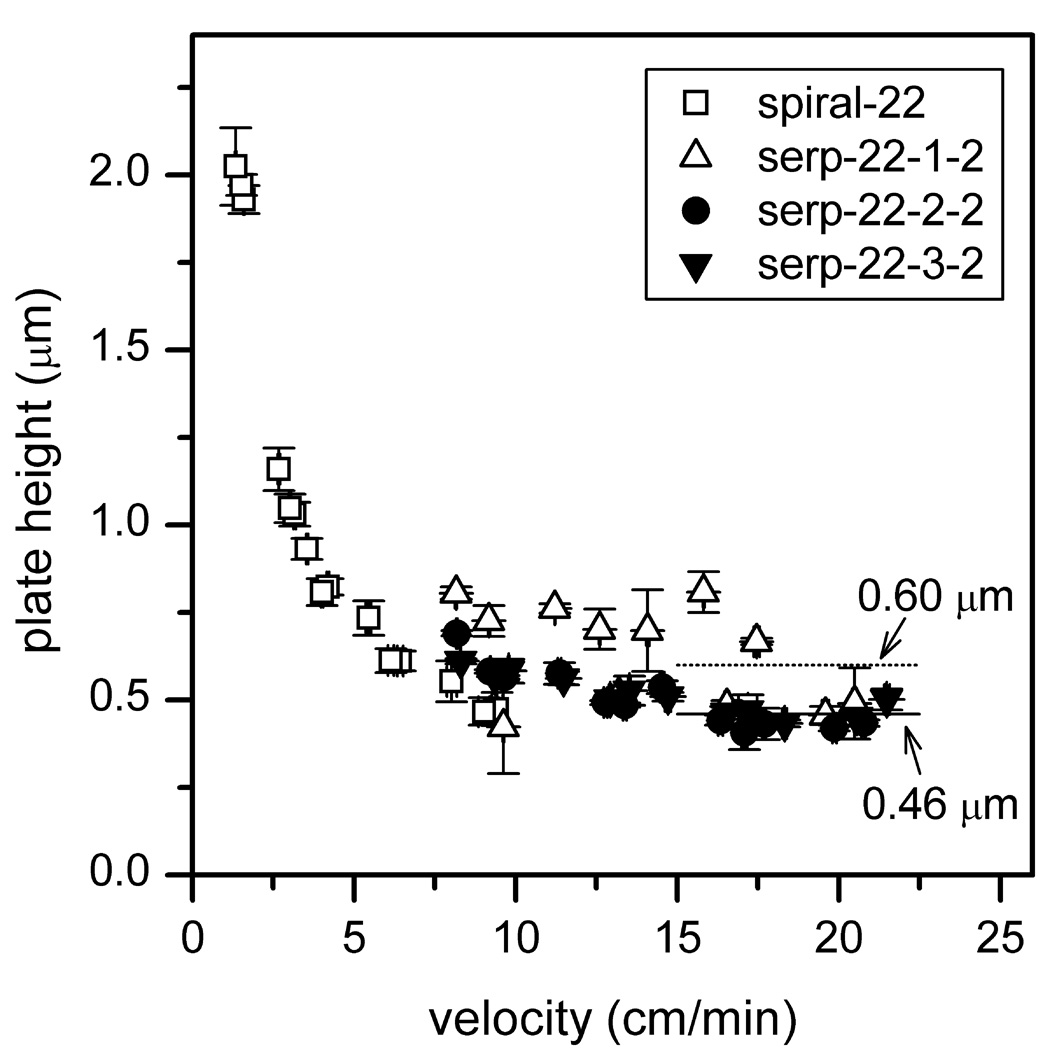
Variation of plate height with velocity for serpentine channels with taper ratios 1, 2, and 3. See Table 2 for device details. The solid and dashed lines compare the average plate heights of taper ratio 1 and taper ratios 2 and 3, respectively. Results are compared with data from the 22-cm spiral channel in [28]. Data are from mannose 5, 6, and 9, and error bars are ±σ for n = 3 for plate height and velocity.
From Figure 3, the separations on the serpentine channel with taper ratio 1 had an average plate height that was ~30% larger than the separations on the channels with taper ratios 2 and 3. The average plate heights at field strengths of 1270 and 1530 V/cm were 0.60 µm for taper ratio 1 and 0.46 µm for the taper ratios 2 and 3. Interestingly, the separation performance was comparable for the channels with taper ratios 2 and 3, and turn-induced band dispersion was minimized. Based on our chip design and previously published work [30], we expected the plate heights from the channel with taper ratio 2 to fall between those for the channels with taper ratios 1 and 3. However, the more general trend of the plate heights approaching an asymptote at field strengths >750 V/cm and linear velocities >8 cm/min was expected as axial diffusion contributed less to the total plate height. Although the devices with taper ratios 2 and 3 had similar separation performance, the experiments described below were performed on devices with taper ratio 3, because the cross-section of the straight channel on the device with taper ratio 3 was 50% larger (see Table 1), which made the device easier to fill with reagents for channel modification and with buffer and sample for electrophoresis experiments.
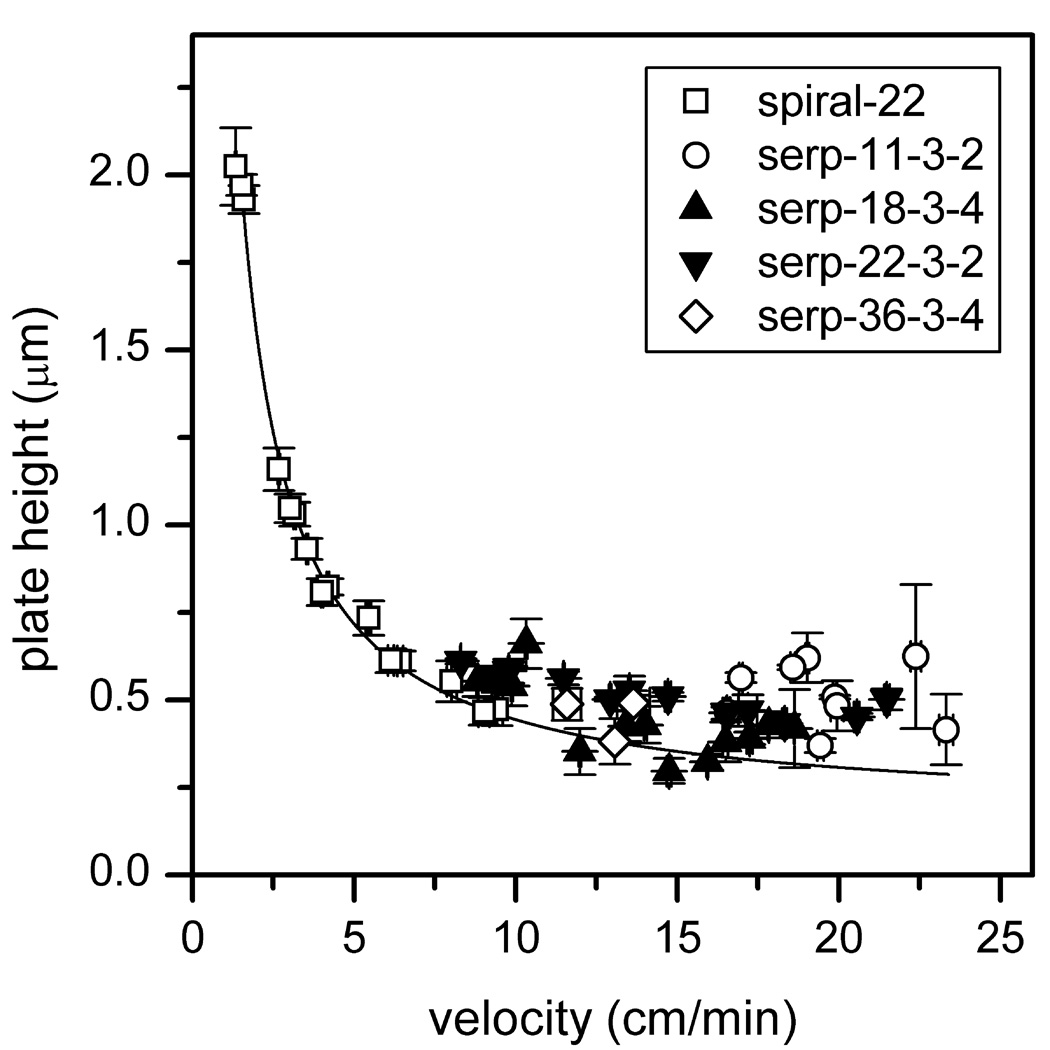
To study the influence of separation length and number of turns on separation performance, we tested serpentine channels with separation lengths of 11 cm with two turns (serp-11-3-2), 18 cm with four turns (serp-18-3-4), and 36 cm with four turns (serp-36-3-4). Figure 4 compares the plate heights from these channels with the 22-cm serpentine channel with two turns (serp-22-3-2). As seen in the figure, the plate heights for the four channel designs were similar. More importantly, devices with similar separation lengths (22 cm and 18 cm), but twice as many turns (2 and 4) provided similar performance, albeit in a 50% smaller footprint for serp-18-3-4. If there was a significant amount of turn-induced dispersion, poorer performance would have resulted on the 18-cm channel with four turns (serp-18-3-4).
Figure 4.
Variation of plate height with velocity for the 11, 18, 22, and 36-cm serpentine channels with taper ratio 3. See Table 2 for device details. Results are compared with data from the 22-cm spiral channel in [28], and the solid line is a fit to the spiral channel data and extrapolated to higher velocities. Data are from mannose 5, 6, and 9, and error bars are ±σ for n = 3 for plate height and velocity.
3.3 Contributions to the plate height
Equation 2 was fitted to the plate height data from the 22-cm spiral channel shown in Figure 4 to provide an estimate of the dispersion coefficient, D, for mannose 5, 6, and 9.
| (2) |
where A includes constant contributions from the injection, detector, and channel geometry, and u is the linear velocity. With the fit parameters (A = 1.71 × 10⁻⁵ cm and D = 2.28 × 10⁻⁶ cm2/min), Equation 2 was extrapolated to higher velocities (≥10 cm/min) to compare the plate heights from the serpentine channels. As seen in the figure, a majority of the plate height data lie above the extrapolated curve.
In microchip electrophoresis, contributions to the plate height include axial diffusion (Hdiff), injection length (Hinj), detector path length (Hdet), geometry (Hgeo), Joule heating (HJ), and adsorption (Hads) [36]. The dispersion sources in our system can be estimated with Equation 3.
| (3) |
where linj is the injected sample plug length, ldet is the detection length in the separation channel, L is the separation length, θ is the included angle (180°), CJ is a coefficient for Joule heating, μ is the apparent mobility of the analyte, E is the field strength, d is the depth of the microchannel, and CA is a coefficient for adsorption.
For the 22-cm serpentine channel (serp-22-3-2), contributions to the plate height are estimated to be 4.3 nm for a 106-µm long injection plug (see Table 1) and 0.039 nm for a laser spot with a 10-µm diameter. From Equation 5c in [31], the geometrical dispersion for two 180° turns with taper ratio 3 is calculated to be 25 nm. Although these contributions are negligible, the plate heights for velocities >15 cm/min were ~40% larger than predicted by Equation 2. The two most probable sources are Joule heating and adsorption.
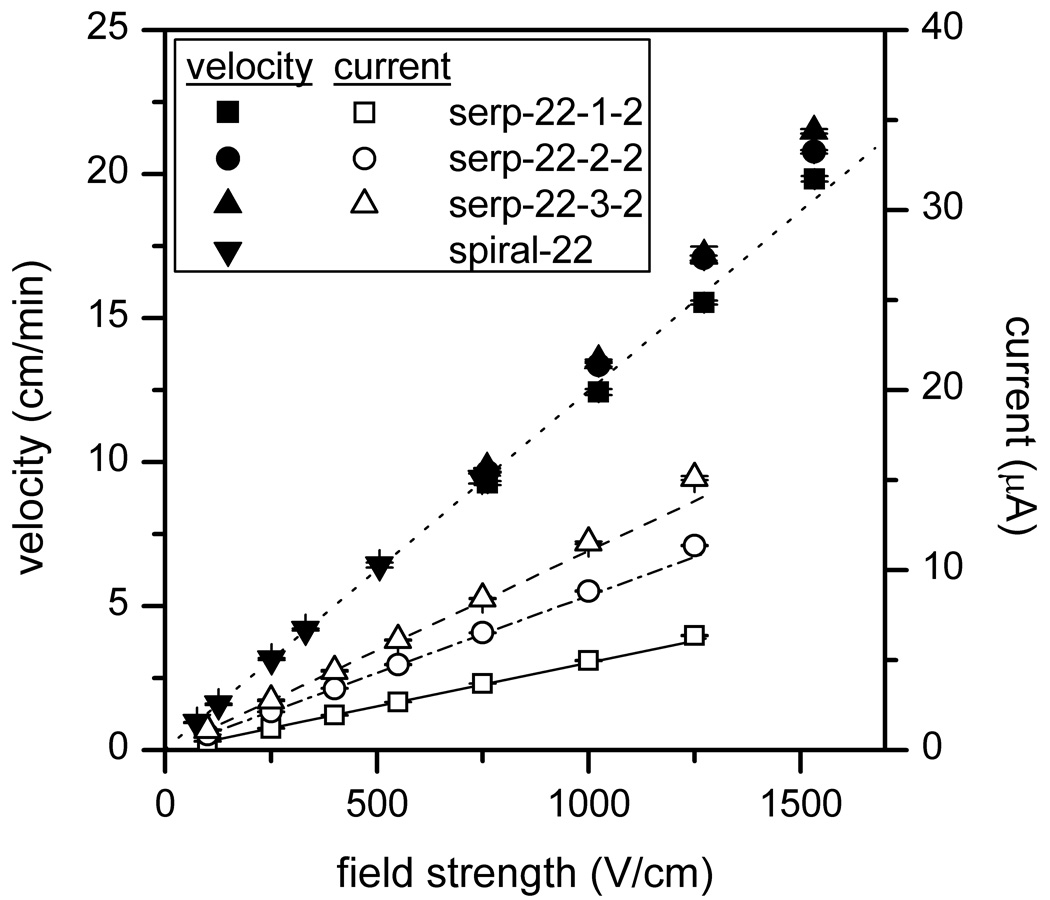
To investigate the extent of Joule heating in our system, the velocity of mannose 5 is plotted against the electric field strength as shown in Figure 5. Above 1000 V/cm, the velocity deviated from linearity for the channels with taper ratios 2 and 3. Moreover, to evaluate the power dissipation, we measured the ion currents for field strengths up to 1250 V/cm on the 22-cm channels with taper ratios 1, 2, and 3 (see Figure 5). The field strength at 1530 V/cm was not included due to the input potential limit of the picoammeter. At 1250 V/cm, the power dissipations (power per unit length) for the channels with taper ratios 1, 2, and 3 were 0.80, 1.42, and 1.89 W/m, respectively. In conventional capillaries, Joule heating starts to contribute significantly to the plate height above 1 W/m [37], and in microfluidic devices, separation efficiency begins to degrade at 3 W/m [38].
Figure 5.
Variation of velocity and current with electric field strength for the 22-cm serpentine channels with taper ratios 1, 2, and 3. See Table 2 for device details. For the velocity data, a linear fit of the data from serp-22-1-2 and spiral-22 [28] is shown, and for the current data, linear fits of the first four data points are included. The error bars are ±σ for n = 3 for velocity and n = 30 for current.
Another source of the band dispersion is solute adsorption to the channel walls. In earlier studies on capillaries [39], the onset of adsorption occurred at relatively low field strengths, e.g., 300–400 V/cm. In the studies presented here, adsorption was a relatively minor contribution even at high electric field strengths, e.g., >1000 V/cm. In fact, the plate height did not increase at high field strengths, as observed previously, but simply did not continue to improve. Presently, we are not able to push the separations to higher field strengths to differentiate between Joule heating and adsorption, although both may be involved in band dispersion.
3.4 Cancer sample separation
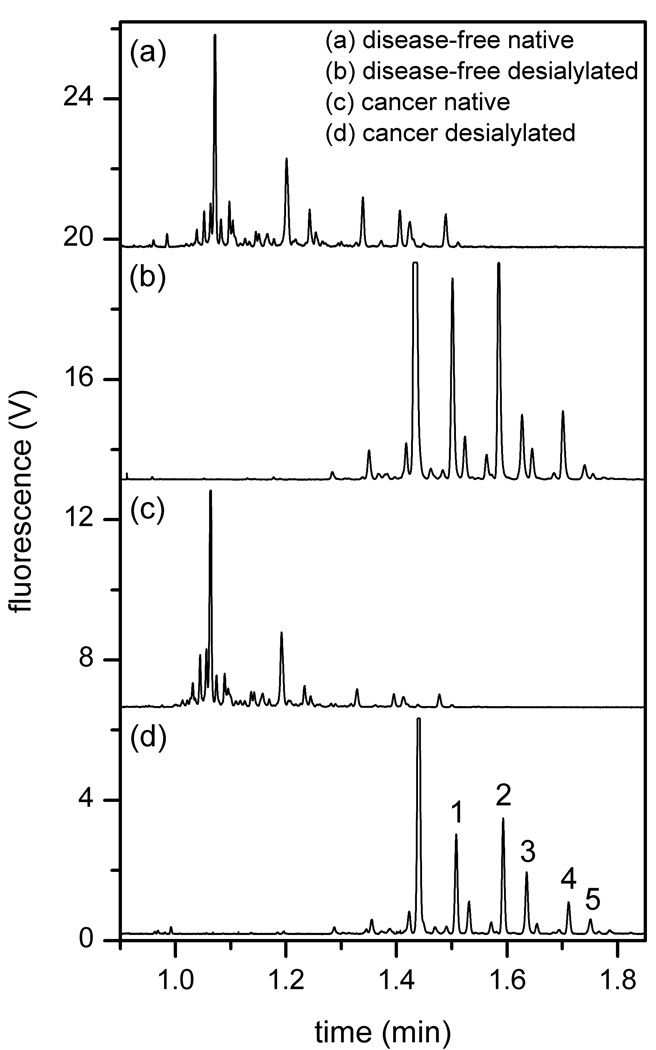
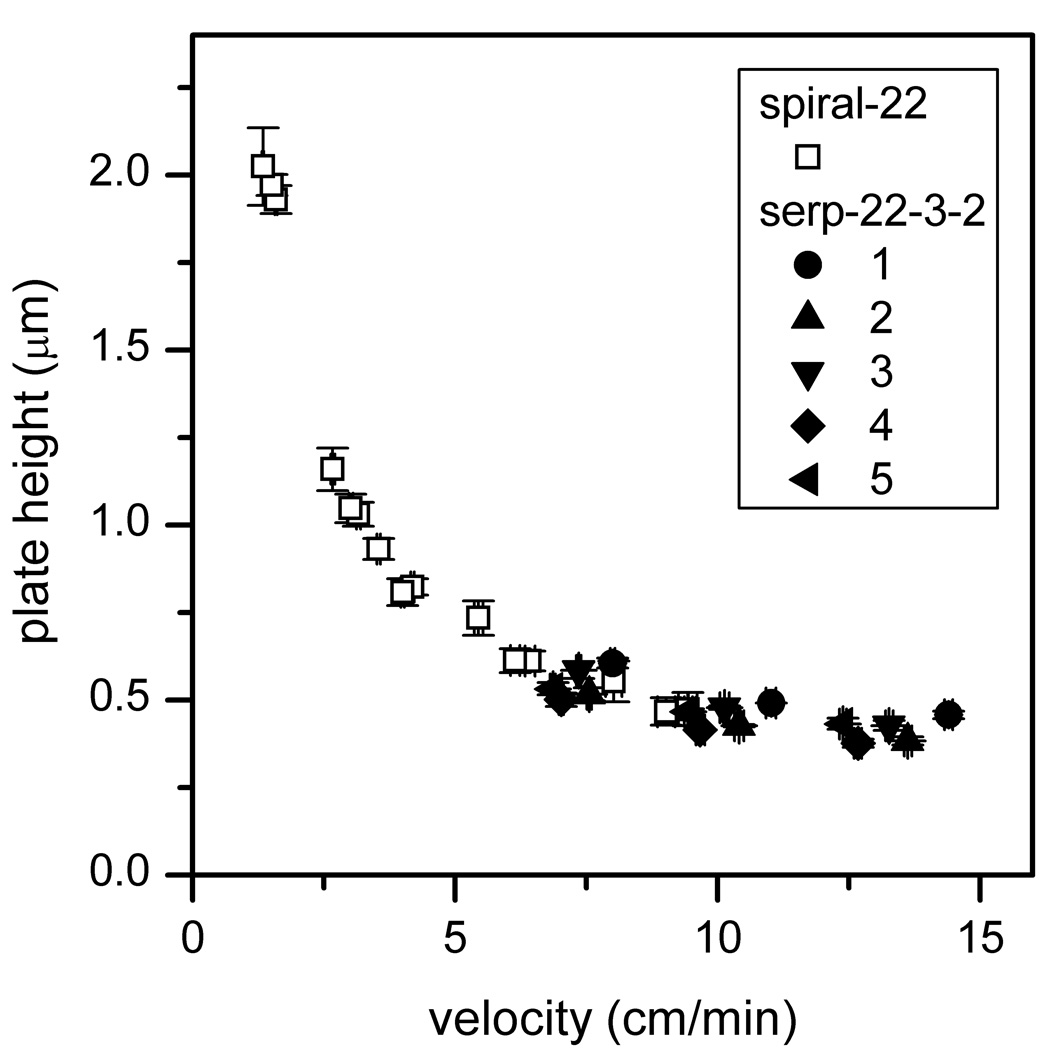
To demonstrate that glycans from biologically relevant samples can be analyzed on these devices with separation efficiencies similar to model glycans (e.g., RNase B), N-glycans derived from the blood serum of an ovarian cancer patient and a disease-free individual were separated on a 22-cm serpentine channel with taper ratio 3 (serp-22-3-2). In addition, portions of both glycan samples were desialylated, separated under similar conditions, and compared to the native samples. The electropherograms of the four N-glycan samples (cancer native, cancer desialylated, disease-free native, and disease-free desialylated) are shown in Figure 6. When comparing the native and desialylated samples, the desialylated sample separation contained fewer peaks, and the peak intensities were higher due to the reduced sample complexity. The plate heights for five glycan components (labeled 1–5 in Figure 6d) are plotted in Figure 7. As seen in the figure, the plate heights were similar to those obtained with RNase B, and the 22-cm separation length easily resolved the primary components for both the native and desialylated samples. From the blood serum data summarized in Figure 7, the RSDs were 0.67% (n = 45) for the migration velocity and 2.4% (n = 45) for the peak variance. These data demonstrated that clinically derived sample can be separated with similar separation efficiencies as the model glycans.
Figure 6.
Electropherograms of native and desialylated N-glycan samples derived from blood serum samples from an ovarian cancer patient and a disease-free individual. Device serp-22-3-2 and an electric field strength of 1270 V/cm were used. The electropherograms are offset for clarity. Components 1–5 are used to evaluate separation efficiency in Figure 7.
Figure 7.
Variation of plate height with velocity for the desialylated N-glycan components 1–5 from Figure 6. See Table 2 for device details of serp-22-3-2. Results are compared with data from the 22-cm spiral channel in [28]. Error bars are ±σ for n = 3 for plate height and velocity.
4 Conclusions
Serpentine channels with asymmetrically tapered turns were evaluated as a function of separation length, electric field strength, taper ratio of the turns, and number of turns. Separations on the 36-cm channel provided the best performance with plate numbers up to 940,000, but separations on the 22-cm channel offered a reasonable compromise between the analysis time (under 1.25 min) and separation efficiency (up to 600,000 plates). Interestingly, turns with taper ratios 2 and 3 produced similar efficiencies and minimized turn-induced dispersion, especially compared to turns with taper ratio 1. The separations of N-glycans derived from the blood sera of an ovarian cancer patient and a disease-free individual showed that glycans from clinically relevant samples can be analyzed with performance similar to model glycans from RNase B.
Acknowledgments
This work was supported in part by NIH U01 CA128535, NIH P41 RR018942, and the Indiana METACyt Initiative of Indiana University, funded in part through a major grant from the Lilly Endowment, Inc. We thank the Hoosier Oncology Group for the ovarian cancer samples.
Abbreviations
- APTS
8-aminopyrene-1,3,6-trisulfonic acid
- MAPTOS
γ-methacryloxypropyltrimethoxy-silane
- PNGase F
peptide-N-glycosidase F
- RNase B
ribonuclease B
Footnotes
Conflict of Interest Statement. The authors have no known conflict of interest.
References
- 1.Fukui S, Feizi T, Galustian C, Lawson AM, Chai WG. Nat. Biotechnol. 2002;20:1011–1017. doi: 10.1038/nbt735. [DOI] [PubMed] [Google Scholar]
- 2.Dennis JW, Granovsky M, Warren CE. Bioessays. 1999;21:412–421. doi: 10.1002/(SICI)1521-1878(199905)21:5<412::AID-BIES8>3.0.CO;2-5. [DOI] [PubMed] [Google Scholar]
- 3.Lowe JB, Marth JD. Annu. Rev. Biochem. 2003;72:643–691. doi: 10.1146/annurev.biochem.72.121801.161809. [DOI] [PubMed] [Google Scholar]
- 4.Miyoshi E, Moriwaki K, Nakagawa T. J. Biochem. 2008;143:725–729. doi: 10.1093/jb/mvn011. [DOI] [PubMed] [Google Scholar]
- 5.Meuwis MA, Fillet M, Geurts P, de Seny D, Lutteri L, Chapelle JP, Bours V, Wehenkel L, Belaiche J, Malaise M, Louis E, Merville MP. Biochem. Pharmacol. 2007;73:1422–1433. doi: 10.1016/j.bcp.2006.12.019. [DOI] [PubMed] [Google Scholar]
- 6.Kirmiz C, Li BS, An HJ, Clowers BH, Chew HK, Lam KS, Ferrige A, Alecio R, Borowsky AD, Sulaimon S, Lebrilla CB, Miyamoto S. Mol. Cell. Proteomics. 2007;6:43–55. doi: 10.1074/mcp.M600171-MCP200. [DOI] [PubMed] [Google Scholar]
- 7.Ferrier RJ. In: The Organic Chemistry of Sugars. Levy DE, Fügedi P, editors. Boca Raton: Taylor & Francis; 2006. p. 17. [Google Scholar]
- 8.Bradley WP, Blasco AP, Weiss JF, Alexander JC, Silverman NA, Chretien PB. Cancer. 1977;40:2264–2272. doi: 10.1002/1097-0142(197711)40:5<2264::aid-cncr2820400537>3.0.co;2-3. [DOI] [PubMed] [Google Scholar]
- 9.Mrochek JE, Dinsmore SR, Tormey DC, Waalkes TP. Clin. Chem. 1976;22:1516–1521. [PubMed] [Google Scholar]
- 10.An HJ, Miyamoto S, Lancaster KS, Kirmiz C, Li BS, Lam KS, Leiserowitz GS, Lebrilla CB. J. Proteome Res. 2006;5:1626–1635. doi: 10.1021/pr060010k. [DOI] [PubMed] [Google Scholar]
- 11.Kyselova Z, Mechref Y, Al Bataineh MM, Dobrolecki LE, Hickey RJ, Vinson J, Sweeney CJ, Novotny MV. J. Proteome Res. 2007;6:1822–1832. doi: 10.1021/pr060664t. [DOI] [PMC free article] [PubMed] [Google Scholar]
- 12.Kyselova Z, Mechref Y, Kang P, Goetz JA, Dobrolecki LE, Sledge GW, Schnaper L, Hickey RJ, Malkas LH, Novotny MV. Clin. Chem. 2008;54:1166–1175. doi: 10.1373/clinchem.2007.087148. [DOI] [PubMed] [Google Scholar]
- 13.El Rassi Z, editor. Carbohydrate Analysis: High Performance Liquid Chromatography and Capillary Electrophoresis. Amsterdam: Elsevier Science B.V; 1995. [Google Scholar]
- 14.Liu JP, Shirota O, Wiesler D, Novotny M. Proc. Natl. Acad. Sci. U. S. A. 1991;88:2302–2306. doi: 10.1073/pnas.88.6.2302. [DOI] [PMC free article] [PubMed] [Google Scholar]
- 15.Nashabeh W, El Rassi Z. J. Chromatogr. A. 1992;600:279–287. doi: 10.1016/0021-9673(92)85559-c. [DOI] [PubMed] [Google Scholar]
- 16.Kakehi K, Susami A, Taga A, Suzuki S, Honda S. J. Chromatogr. A. 1994;680:209–215. doi: 10.1016/0021-9673(94)80069-3. [DOI] [PubMed] [Google Scholar]
- 17.Hutterer KM, Birrell H, Camilleri P, Jorgenson JW. J. Chromatogr. B. 2000;745:365–372. doi: 10.1016/s0378-4347(00)00301-7. [DOI] [PubMed] [Google Scholar]
- 18.Palm A, Novotny MV. Anal. Chem. 1997;69:4499–4507. [Google Scholar]
- 19.Yang CM, El Rassi Z. Electrophoresis. 1998;19:2061–2067. doi: 10.1002/elps.1150191204. [DOI] [PubMed] [Google Scholar]
- 20.Suzuki S, Yamamoto M, Kuwahara Y, Makiura K, Honda S. Electrophoresis. 1998;19:2682–2688. doi: 10.1002/elps.1150191518. [DOI] [PubMed] [Google Scholar]
- 21.Que AH, Mechref Y, Huang YP, Taraszka JA, Clemmer DE, Novotny MV. Anal. Chem. 2003;75:1684–1690. doi: 10.1021/ac025985c. [DOI] [PubMed] [Google Scholar]
- 22.Tegeler TJ, Mechref Y, Boraas K, Reilly JP, Novotny MV. Anal. Chem. 2004;76:6698–6706. doi: 10.1021/ac049341b. [DOI] [PubMed] [Google Scholar]
- 23.Mechref Y, Novotny MV. Mass Spectrom. Rev. 2009;28:207–222. doi: 10.1002/mas.20196. [DOI] [PubMed] [Google Scholar]
- 24.Dang FQ, Zhang LH, Jabasini M, Kaji N, Baba Y. Anal. Chem. 2003;75:2433–2439. doi: 10.1021/ac034110a. [DOI] [PubMed] [Google Scholar]
- 25.Callewaert N, Contreras R, Mitnik-Gankin L, Carey L, Matsudaira P, Ehrlich D. Electrophoresis. 2004;25:3128–3131. doi: 10.1002/elps.200406020. [DOI] [PubMed] [Google Scholar]
- 26.Dang FQ, Kakehi K, Nakajima K, Shinohara Y, Ishikawa M, Kaji N, Tokeshi M, Baba Y. J. Chromatogr. A. 2006;1109:138–143. doi: 10.1016/j.chroma.2005.11.133. [DOI] [PubMed] [Google Scholar]
- 27.Culbertson CT, Jacobson SC, Ramsey JM. Anal. Chem. 2000;72:5814–5819. doi: 10.1021/ac0006268. [DOI] [PubMed] [Google Scholar]
- 28.Zhuang Z, Starkey JA, Mechref Y, Novotny MV, Jacobson SC. Anal. Chem. 2007;79:7170–7175. doi: 10.1021/ac071261v. [DOI] [PubMed] [Google Scholar]
- 29.Paegel BM, Emrich CA, Weyemayer GJ, Scherer JR, Mathies RA. Proc. Natl. Acad. Sci. U. S. A. 2002;99:574–579. doi: 10.1073/pnas.012608699. [DOI] [PMC free article] [PubMed] [Google Scholar]
- 30.Griffiths SK, Nilson RH. Anal. Chem. 2001;73:272–278. doi: 10.1021/ac000936q. [DOI] [PubMed] [Google Scholar]
- 31.Molho JI, Herr AE, Mosier BP, Santiago JG, Kenny TW, Brennen RA, Gordon GB, Mohammadi B. Anal. Chem. 2001;73:1350–1360. [Google Scholar]
- 32.Emrich CA, Tian HJ, Medintz IL, Mathies RA. Anal. Chem. 2002;74:5076–5083. doi: 10.1021/ac020236g. [DOI] [PubMed] [Google Scholar]
- 33.Zhuang Z, Jacobson SC. Anal. Chem. 2009;81:1477–1481. doi: 10.1021/ac801774p. [DOI] [PMC free article] [PubMed] [Google Scholar]
- 34.Guttman A, Pritchett T. Electrophoresis. 1995;16:1906–1911. doi: 10.1002/elps.11501601314. [DOI] [PubMed] [Google Scholar]
- 35.Jacobson SC, Hergenröder R, Koutny LB, Warmack RJ, Ramsey JM. Anal. Chem. 1994;66:1107–1113. [Google Scholar]
- 36.Jacobson SC, Culbertson CT. In: Separation Methods in Microanalytical Systems. Kutter JP, Fintschenko Y, editors. Boca Raton, FL: CRC Press; 2006. [Google Scholar]
- 37.Monnig CA, Jorgenson JW. Anal. Chem. 1991;63:802–807. doi: 10.1021/ac00008a013. [DOI] [PubMed] [Google Scholar]
- 38.Fan ZH, Harrison DJ. Anal. Chem. 1994;66:177–184. [Google Scholar]
- 39.Liu JP, Dolnik V, Hsieh YZ, Novotny M. Anal. Chem. 1992;64:1328–1336. doi: 10.1021/ac00037a006. [DOI] [PubMed] [Google Scholar]


