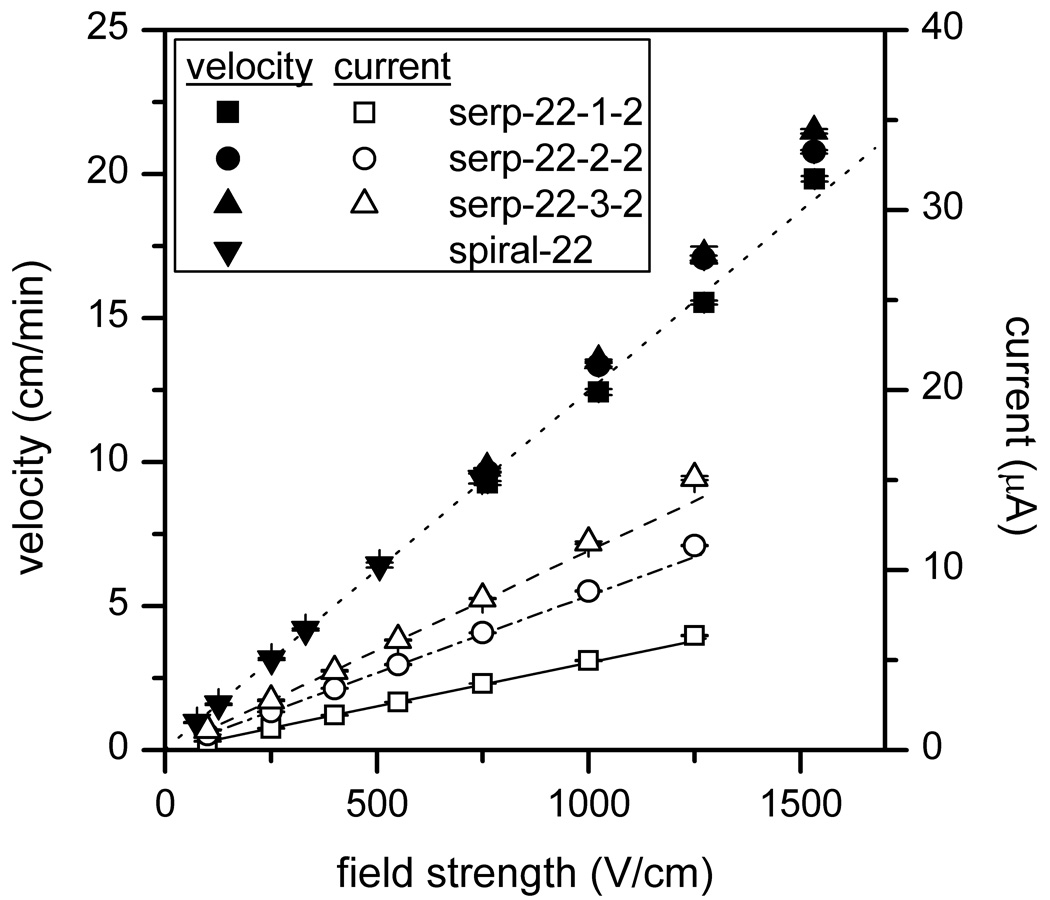
Figure 5.
Variation of velocity and current with electric field strength for the 22-cm serpentine channels with taper ratios 1, 2, and 3. See Table 2 for device details. For the velocity data, a linear fit of the data from serp-22-1-2 and spiral-22 [28] is shown, and for the current data, linear fits of the first four data points are included. The error bars are ±σ for n = 3 for velocity and n = 30 for current.

