

Background: Aggregation of mutant huntingtin into inclusion bodies is a pathogenic feature of Huntington disease.
Results: Genetic and pharmacological activation of the heat shock stress response (HSR) promotes inclusion body formation.
Conclusion: Activation of the HSR contributes to mutant huntingtin aggregation.
Significance: HSR activation as a therapeutic strategy may promote rather than suppress aggregation of proteins implicated in neurodegenerative disease.
Keywords: Flow Cytometry, Heat Shock Protein, Huntington Disease, Molecular Chaperone, Protein Aggregation, Heat Shock Response
Abstract
The cellular heat shock response (HSR) protects cells from toxicity associated with defective protein folding, and this pathway is widely viewed as a potential pharmacological target to treat neurodegenerative diseases linked to protein aggregation. Here we show that the HSR is not activated by mutant huntingtin (HTT) even in cells selected for the highest expression levels and for the presence of inclusion bodies containing aggregated protein. Surprisingly, HSR activation by HSF1 overexpression or by administration of a small molecule activator lowers the concentration threshold at which HTT forms inclusion bodies in cells expressing aggregation-prone, polyglutamine-expanded fragments of HTT. These data suggest that the HSR does not mitigate inclusion body formation.
Introduction
Inclusion bodies (IB)5 containing aggregated forms of disease-associated proteins are histopathological features of most neurodegenerative diseases, suggesting an intimate linkage between disease pathogenesis and impaired protein homeostasis (1). This relationship is exemplified in Huntington disease (HD), where the disease-causing mutation results in the synthesis of huntingtin protein (HTT) containing expanded polyglutamine (poly(Q)) tracts that are highly prone to aggregate and accumulate in cytoplasmic and nuclear IB (2–4). The strong correlation between IB formation and disease pathology in HD and other neurodegenerative disorders has spawned interest in potential therapeutic strategies designed to mitigate protein aggregation by activating cellular stress response systems (5).
The heat shock response (HSR) is one pathway that has been proposed to play a protective role in neurodegenerative disease (6, 7). At its core, the HSR is a transcriptional program that controls the expression of a large number of genes, including those encoding molecular chaperones that help to protect cells from the consequences of protein misfolding in response to proteotoxic stress (8). Up-regulation of the HSR by genetic or pharmacological activation of heat shock factor 1 (HSF1), the master transcriptional regulator of the HSR, decreases protein aggregate burden in cell and animal models of poly(Q) and other diseases associated with protein aggregation (9). Exposure to geldanamycin and 17-allylamino-17-demethoxygeldanamycin (10, 11), drugs that activate the HSR indirectly by inhibiting Hsp90, and more recently to “F1,” a small molecule that activates HSR by an Hsp90-independent mechanism (12), reduces the fraction of cells with IB in cell culture models of HD.
Because experimental activation of HSR appears to ameliorate protein aggregate pathology, it seems likely that cells cope with protein aggregation by turning on this endogenous response. However, previous studies failed to detect HSR activation in HD models by chromatin immunoprecipitation (ChIP) of HSF1 (13, 14). Indeed, HTT expression is associated with decreased levels of HSF1-regulated chaperones in striatal neuron (15) and mouse (16) HD models. One possible reason for the failure to detect HSR activation in these models is that the level of HTT aggregation in those studies was insufficient to activate the HSR. Here, we report that cells expressing HTT fail to activate the HSR irrespective of concentration or aggregation status. Surprisingly, our results show that activation of the HSR favors IB formation, suggesting that this pathway does not function to prevent IB pathology.
EXPERIMENTAL PROCEDURES
DNA Constructs
HSE::GFP plasmid was created by inserting the HSP70 promoter from the Hsp70.1-pr-Luciferase plasmid into modified pEGFP-C3 lacking a promoter (Clontech). Plasmids for HTT(Q25)-mCherry and HTT(Q91)-mCherry were previously described (17). The plasmid for mCherry was created by inserting mCherry (a gift from R. Tsien, University of California, San Diego, La Jolla, CA) into pcDNA3.1 (Invitrogen). The plasmid for human HSF1 was a kind gift from R. Voellmy (University of Miami, Miami, FL).
Cell Lines
HSE::GFP cells were created by transfection of U2OS Tet-On cells (Clontech) or HEK293 cells with HSE::GFP plasmid. U2OS cells were cotransfected with linear puromycin marker (Clontech). Transfection for 72 h was followed by selection of transformed cells in DMEM containing 1 mg/ml G418 or 1 μg/ml puromycin for HEK293 and U2OS lines, respectively. U2OS cells were cultured in DMEM supplemented with 10% fetal bovine serum (FBS) and l-glutamine. 10% animal serum was used in place of FBS for HEK293 cells. Following selection, a population of cells expressing low HSE::GFP was sorted by FACS using a sorter equipped with a 488-nm laser (Digital Vantage, BD Biosciences).
Flow Cytometry and Cell Sorting
Cells were harvested 72 h after transfection and analyzed on an LSRII flow cytometer equipped with 488- and 535-nm lasers (BD Biosciences). An interval gate was set at >103-a.u. mCherry intensity, and >20,000 cells in this gate were analyzed for each condition. Data were analyzed using FlowJo (version 8.8.6; Tree Star). A green fluorescent protein (GFP) fluorescence histogram for parental U2OS cells was used to define a GFP-positive interval gate. The mCherry axis was subdivided into 41 bins of equal width, and the percentage of GFP-positive cells was calculated for each bin (see Fig. 1C). For analysis of the fraction of cells with IB by pulse-shape analysis (PulSA), cells with IB were identified using a mCherry peak width versus peak height scatter plot, and a lasso gate was drawn around the IB population. The fraction of cells with IB was plotted against mCherry bin number (see Fig. 3A). In all cases, bins containing <100 cells were not included in the analysis. For cells treated with MG132 (Enzo Life Sciences), celastrol (Sigma-Aldrich), or F1 (12), cells were treated 48 h after transfection and analyzed by flow cytometry. DMSO was used as a negative control. To isolate low and high HTT(Q91)-mCherry-expressing populations, cells were harvested 72 h after transfection and sorted according to HTT(Q91)-mCherry levels using a sorter equipped with a 575–590-nm tunable laser (Digital Vantage, BD Biosciences). To define low and high populations, the photomultiplier tube voltage was set to center the nonexpressing population over the 102-a.u. intensity mark, and an interval gate defining the low-expressing population was set in the 102-103-a.u. interval, whereas an interval gate defining the high-expressing population was set at >103-a.u. 1–2 × 10⁶ cells were collected in each gate and flash-frozen in liquid N2.
FIGURE 1.

Mutant huntingtin does not activate the HSR. A, U2OS cells stably expressing HSE::GFP were treated with 10 μm F1 for 20 h (left-hand panel) or 3 μm celastrol for 15 h (right-hand panel) and analyzed by flow cytometry. The gray and green histograms show HSE::GFP levels of control and treated cells, respectively, and the interval gate indicates HSE::GFP-positive cells. B, HSE::GFP-expressing or parental U2OS cells were transiently transfected with mCherry or HTT(Qn)-mCherry and analyzed by flow cytometry, and fluorescence intensities were plotted on pseudo-color scatter plots. C, the method used to determine the fraction of HSE::GFP-positive cells as a function of mCherry expression. The histogram of mCherry fluorescence levels for the entire population was subdivided into 41 equal bins (left-hand panel), and the fraction of GFP-positive cells in each bin (GFP-positive interval gate and histograms, right-hand panel) was determined. D, transformation of data from panel B showing the fraction of HSE::GFP-positive cells as a function of mCherry fluorescence. E, effect of celastrol on HSR activation in HEK293 cells. HEK293 cells stably expressing HSE::GFP were treated with 3 μm celastrol for 15 h and analyzed by flow cytometry. The green and gray histograms show HSE::GFP levels in treated and control cells, respectively. F, transformation of flow cytometry data from HEK293 HSE::GFP cells transiently transfected with HTT(Qn)-mCherry showing the fraction of HSE::GFP-positive cells as a function of mCherry fluorescence. G, identification of cells containing HTT(Q91)-mCherry IB by PulSA. Pseudo-color scatter plots of mCherry peak height versus peak width of cells transiently transfected with HTT(Qn)-mCherry are shown. The black and red gates indicate cells with or without IB, respectively. H, the fraction of HSE::GFP-positive cells in the gates in panel G. Error bars indicate mean ± S.D. (n = 3).
FIGURE 3.

Activation of the HSR decreases the concentration at which mutant huntingtin forms IB. A, the method used to determine the fraction of cells with IB as a function of mCherry expression. Cells with IB were identified using PulSA (red histogram), and the histogram of total mCherry fluorescence (gray histogram) was subdivided into 41 equal bins. The fraction of cells in each bin that contained IB was determined by dividing the number of cells with IB by the number of total cells in that bin (enlarged histogram, right-hand panel). Note that the y axis of the enlarged histogram reports the absolute numbers of cells, whereas the y axis of the parent histograms is normalized to the total number of cells analyzed. B, the fraction of HTT(Qn)-mCherry-expressing cells with IB was determined by PulSA and transformed from panel A. C, HSE::GFP cells were transiently transfected with HTT(Q91)-mCherry or HTT(Q91)-mCherry and HSF1, and the fraction of cells that were GFP-positive was determined as a function of their mCherry fluorescence. D–G, the fraction of HTT(Q91)-mCherry-expressing cells with IB, determined by PulSA following HSF1 overexpression (D and E) or treatment with F1 (F) or MG132 (G). H, the method used to determine the concentration at which HTT forms IB. Cells expressing HTT(Q91)-mCherry were imaged by time-lapse video microscopy, and a mask indicated in red was drawn in the frame preceding IB formation (white arrowhead). Elapsed time is indicated in minutes. I and J, effect of HSF1 overexpression (I, pcDNA: n = 43; HSF1: n = 51) or 10 μm F1 treatment (J, DMSO: n = 9; F1: n = 22) on the concentration at which HTT(Q91)-mCherry forms IB, analyzed by time-lapse video microscopy. K, effect of HSF1 overexpression (pcDNA: n = 23; HSF1: n = 26) on the concentration of HTT(Q91)-mCherry at which cells die, analyzed by time-lapse video microscopy. The black diamond in the box plots indicates mean calculated value. p values were determined by Student's t test. In I–K, error bars indicate mean ± S.D.
EMSA
Electrophoretic mobility shift assay (EMSA) was performed using a 32P-labeled probe containing the proximal heat shock element from the human Hsp70 promoter, as described previously (18). The mixtures containing nuclear extracts and the 32P-labeled probe were incubated at room temperature for 20 min and analyzed by native electrophoresis on 4% polyacrylamide gels. The intensities of the shifted bands were quantified on a PhosphorImager (GE Healthcare).
Microscopy
Live-cell imaging was performed on U2OS cells, plated in DMEM with 10% FBS and incubated at 37 °C and 5% CO2 in glass bottom 4-well chambered cover glass (Matek). Cells were transfected after 4–6 h with HTT(Q91)-mCherry or cotransfected with HTT(Q91)-mCherry and HSF1 and incubated for an additional 48 h. For F1 imaging experiments, cells were treated with compound F1 for 6 h prior to the start of imaging. Cells were imaged by time-lapse fluorescence video microscopy using an inverted microscope (Zeiss Axiovert 200M) encased in a Perspex chamber that was heated to 37 °C. The chambered cover glass was placed in a secondary chamber perfused with humidified 5% CO2. A motorized stage allowed imaging of multiple fields. Images were acquired with a cooled charge-coupled device (Cool-SNAP HQ) and UV light source (X-Cite; Lumen Dynamics), filters for visualization of mCherry, and a 20× air objective. MetaMorph software was used to control image acquisition, and ImageJ (v1.6, National Institutes of Health) was used for image analysis. Mean fluorescence levels of all cells that formed inclusions or died during the time of imaging were quantified immediately before inclusion formation or cell death. Mean levels were determined by drawing a mask around each cell, defined by the area of mCherry expression, and calculating total fluorescence intensity divided by cell area.
RESULTS AND DISCUSSION
To assess HSR activation in mammalian cells, we generated a reporter cell line that stably expresses enhanced green fluorescent protein (GFP) under transcriptional control of the heat shock element promoter (HSE::GFP). Treatment of these cells with F1, a recently described (12) small molecule activator of the HSR, or the established HSR activator celastrol (Fig. 1A), increased the fraction of cells that exhibited elevated GFP fluorescence, establishing HSE::GFP cells as a valid reporter system of HSR activation. To assess the effect of HTT expression on the HSR, we expressed constructs encoding HTT exon 1 fused to mCherry fluorescent protein (HTT(Qn)-mCherry) containing an expanded (Q91) or wild-type (Q25) poly(Q) tract. Transfection of these HTT constructs into HSE::GFP cells resulted in a small increase in the fraction of GFP-positive cells that was indistinguishable from that obtained by transfection of mCherry alone (Fig. 1, B–F) and negligible when compared with the increase observed in cells treated with F1 or celastrol. To assess the possibility that the HSR is activated only in cells containing aggregated HTT, we used PulSA (19) to identify populations of cells with HTT IB. By analyzing the height and width of fluorescence emission profiles in individual cells passing through the laser beam of the flow cytometer, PulSA provides information about the spatial distribution of fluorescently labeled proteins and accurately identifies cells with IB formed by mutant HTT or other aggregation-prone disease-associated proteins (19). We found that the fraction of HSE::GFP-positive cells in the HTT(Q91)-mCherry subpopulation with IB was indistinguishable from the fraction of HSE::GFP-positive cells with similar total mCherry fluorescence but lacking IB (Fig. 1, G and H). Thus, HTT expression does not lead to detectable HSR activation, irrespective of glutamine length, expression level, or aggregation status.
To investigate the possibility that HTT overexpression could promote increased HSF1 binding to HSE without transcriptional activation of the HSR, we used EMSA (18). Control experiments revealed robust DNA binding activity in lysates of cells in which HSR was induced by heat shock or chemical activators (Fig. 2A). In contrast, DNA binding activity was not detected in lysates from cells transfected with HTT(Q25)-mCherry or HTT(Q91)-mCherry (Fig. 2B), even after enrichment by fluorescence-activated cell sorting for cells expressing the highest levels of HTT(Q91)-mCherry (Fig. 2C). Thus, overexpression of HTT fails to activate the HSR and does not lead to detectable HSF1 DNA binding.
FIGURE 2.
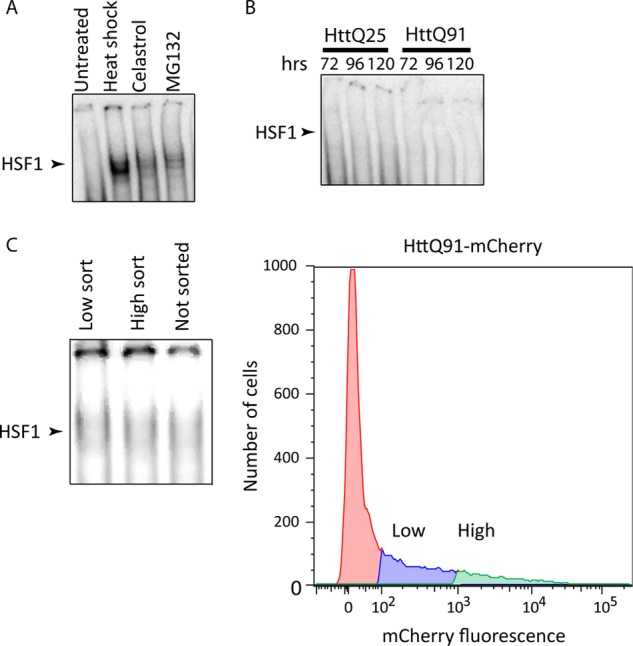
Mutant huntingtin does not induce binding of HSF1 to HSE. A, HSF1 EMSA analysis of lysates from cells incubated at 43 °C for 1 h or treated with 3 μm celastrol or 10 μm MG132 for 15 h. B, HSF1 EMSA analysis of lysates from cells transiently transfected with HTT(Qn)-mCherry for 72, 96, or 120 h. C, HSF1 EMSA analysis (left-hand panel) of lysates from cells transiently transfected with HTT(Q91)-mCherry and sorted according to low or high mCherry expression levels (right-hand panel).
Our inability to detect HSR activation in cells expressing HTT is somewhat surprising in light of studies reporting decreased incidence of IB following genetic and pharmacological activation of the HSR. This ameliorating effect of HSR activation may reflect suppressed aggregation or enhanced clearance of HTT. To distinguish between these possibilities, we used PulSA to assess the effect of HSR activation on the concentration dependence of HTT(Q91)-mCherry aggregation (Fig. 3, A and B). Although we expected that increased proteostasis capacity resulting from HSR activation should reduce the fraction of cells with HTT IB at any given level of HTT(Q91)-mCherry expression, our data revealed that HSF1 overexpression (Fig. 3, C–E) or treatment with compound F1 (Fig. 3F) had the opposite effect, causing the aggregation dose-response curve to shift to the left, similar to the effect observed with proteasome inhibitor (Fig. 3G). To confirm these findings, we used time-lapse fluorescence video microscopy to assess the effect of HSR activation on the concentration at which diffuse HTT(Q91)-mCherry transitions into IB (Fig. 3H) (17). HTT levels prior to its aggregation into IB were significantly lower in cells overexpressing HSF1 (Fig. 3I) or after cells were pretreated with F1 (Fig. 3J), confirming that HSR activation decreases the absolute concentration at which HTT forms IB.
How can we reconcile these findings with studies showing that HSR activation decreases the cytotoxic effects of mutant HTT expression and decreases the frequency of cells containing HTT IB? HSR activation could promote degradation or clearance of soluble (via the proteasome) or insoluble (via autophagy) HTT, resulting in decreased IB formation or increased IB turnover, respectively (11, 20). Alternatively, because HSR activators such as Hsp90 inhibitors increase proteotoxic stress in addition to activating the HSR (21), it is possible that these compounds preferentially kill cells with the highest HTT expression, thereby leading to artifactual underestimation of incidence of IB. Our observation that HSF1 activation decreases the concentration threshold at which HTT aggregates supports the view that the HSR operates mainly as a homeostatic mechanism to oppose the effects of acute proteotoxic stress like heat shock (6) and may not function to reduce the aggregation of proteins such as HTT. Indeed, we observe that prolonged treatment with F1 or HSF1 overexpression in combination with HTT expression does not confer a survival advantage to cells with diffuse HTT(Q91)-mCherry (Fig. 3K) and leads to increased cytotoxicity (data not shown), possibly negating a potential protective role of IB to prevent HTT-induced cell death (22). Therefore, although previous studies suggest that HSR activation, albeit by indirect means, can ameliorate toxicity associated with protein aggregation (10–12), validation of this pathway as an effective therapeutic target in the treatment of neurodegenerative disease awaits the development of small molecules that directly activate HSF1 and deeper mechanistic insights into the physiological processes that regulate the HSR.
Acknowledgments
We are grateful to M. Brandeis for helpful discussions, J. Olzmann for critical reading of the manuscript, and the Stanford University Shared FACS Facility for access to instrumentation.
This work was supported, in whole or in part, by National Institutes of Health Grant 5R01NS042842-10 from the NINDS (to R. R. K.).
- IB
- inclusion body(ies)
- HD
- Huntington disease
- HSR
- heat shock response
- HSE
- heat shock element
- HSF1
- heat shock factor 1
- PulSA
- pulse-shape analysis
- DMSO
- dimethyl sulfoxide
- a.u.
- absorbance units.
REFERENCES
- 1. Ross C. A., Poirier M. A. (2004) Protein aggregation and neurodegenerative disease. Nat. Med. 10, (suppl.) S10–S17 [DOI] [PubMed] [Google Scholar]
- 2. Davies S. W., Turmaine M., Cozens B. A., DiFiglia M., Sharp A. H., Ross C. A., Scherzinger E., Wanker E. E., Mangiarini L., Bates G. P. (1997) Formation of neuronal intranuclear inclusions underlies the neurological dysfunction in mice transgenic for the HD mutation. Cell 90, 537–548 [DOI] [PubMed] [Google Scholar]
- 3. DiFiglia M., Sapp E., Chase K. O., Davies S. W., Bates G. P., Vonsattel J. P., Aronin N. (1997) Aggregation of huntingtin in neuronal intranuclear inclusions and dystrophic neurites in brain. Science 277, 1990–1993 [DOI] [PubMed] [Google Scholar]
- 4. Scherzinger E., Sittler A., Schweiger K., Heiser V., Lurz R., Hasenbank R., Bates G. P., Lehrach H., Wanker E. E. (1999) Self-assembly of polyglutamine-containing huntingtin fragments into amyloid-like fibrils: implications for Huntington's disease pathology. Proc. Natl. Acad. Sci. U.S.A. 96, 4604–4609 [DOI] [PMC free article] [PubMed] [Google Scholar]
- 5. Calamini B., Morimoto R. I. (2012) Protein homeostasis as a therapeutic target for diseases of protein conformation. Curr. Top. Med. Chem. 12, 2623–2640 [DOI] [PMC free article] [PubMed] [Google Scholar]
- 6. Morimoto R. I. (2011) The heat shock response: systems biology of proteotoxic stress in aging and disease. Cold Spring Harbor Symp. Quant. Biol. 76, 91–99 [DOI] [PubMed] [Google Scholar]
- 7. Vabulas R. M., Raychaudhuri S., Hayer-Hartl M., Hartl F. U. (2010) Protein folding in the cytoplasm and the heat shock response. Cold Spring Harb. Perspect. Biol. 2, a004390. [DOI] [PMC free article] [PubMed] [Google Scholar]
- 8. Trinklein N. D., Murray J. I., Hartman S. J., Botstein D., Myers R. M. (2004) The role of heat shock transcription factor 1 in the genome-wide regulation of the mammalian heat shock response. Mol. Biol. Cell 15, 1254–1261 [DOI] [PMC free article] [PubMed] [Google Scholar]
- 9. Nagai Y., Fujikake N., Popiel H. A., Wada K. (2010) Induction of molecular chaperones as a therapeutic strategy for the polyglutamine diseases. Curr. Pharm. Biotechnol. 11, 188–197 [DOI] [PubMed] [Google Scholar]
- 10. Sittler A., Lurz R., Lueder G., Priller J., Lehrach H., Hayer-Hartl M. K., Hartl F. U., Wanker E. E. (2001) Geldanamycin activates a heat shock response and inhibits huntingtin aggregation in a cell culture model of Huntington's disease. Hum. Mol. Genet. 10, 1307–1315 [DOI] [PubMed] [Google Scholar]
- 11. Waza M., Adachi H., Katsuno M., Minamiyama M., Sang C., Tanaka F., Inukai A., Doyu M., Sobue G. (2005) 17-AAG, an Hsp90 inhibitor, ameliorates polyglutamine-mediated motor neuron degeneration. Nat. Med. 11, 1088–1095 [DOI] [PubMed] [Google Scholar]
- 12. Calamini B., Silva M. C., Madoux F., Hutt D. M., Khanna S., Chalfant M. A., Saldanha S. A., Hodder P., Tait B. D., Garza D., Balch W. E., Morimoto R. I. (2012) Small-molecule proteostasis regulators for protein conformational diseases. Nat. Chem. Biol. 8, 185–196 [DOI] [PMC free article] [PubMed] [Google Scholar]
- 13. Labbadia J., Cunliffe H., Weiss A., Katsyuba E., Sathasivam K., Seredenina T., Woodman B., Moussaoui S., Frentzel S., Luthi-Carter R., Paganetti P., Bates G. P. (2011) Altered chromatin architecture underlies progressive impairment of the heat shock response in mouse models of Huntington disease. J. Clin. Invest. 121, 3306–3319 [DOI] [PMC free article] [PubMed] [Google Scholar]
- 14. Riva L., Koeva M., Yildirim F., Pirhaji L., Dinesh D., Mazor T., Duennwald M. L., Fraenkel E. (2012) Poly-glutamine expanded huntingtin dramatically alters the genome wide binding of HSF1. J. Huntingtons. Dis. 1, 33–45 [PMC free article] [PubMed] [Google Scholar]
- 15. Chafekar S. M., Duennwald M. L. (2012) Impaired heat shock response in cells expressing full-length polyglutamine-expanded huntingtin. PLoS One 7, e37929. [DOI] [PMC free article] [PubMed] [Google Scholar]
- 16. Hay D. G., Sathasivam K., Tobaben S., Stahl B., Marber M., Mestril R., Mahal A., Smith D. L., Woodman B., Bates G. P. (2004) Progressive decrease in chaperone protein levels in a mouse model of Huntington's disease and induction of stress proteins as a therapeutic approach. Hum. Mol. Genet. 13, 1389–1405 [DOI] [PubMed] [Google Scholar]
- 17. Hipp M. S., Patel C. N., Bersuker K., Riley B. E., Kaiser S. E., Shaler T. A., Brandeis M., Kopito R. R. (2012) Indirect inhibition of 26S proteasome activity in a cellular model of Huntington's disease. J. Cell Biol. 196, 573–587 [DOI] [PMC free article] [PubMed] [Google Scholar]
- 18. Mosser D. D., Theodorakis N. G., Morimoto R. I. (1988) Coordinate changes in heat shock element-binding activity and HSP70 gene transcription rates in human cells. Mol. Cell. Biol. 8, 4736–4744 [DOI] [PMC free article] [PubMed] [Google Scholar]
- 19. Ramdzan Y. M., Polling S., Chia C. P., Ng I. H., Ormsby A. R., Croft N. P., Purcell A. W., Bogoyevitch M. A., Ng D. C., Gleeson P. A., Hatters D. M. (2012) Tracking protein aggregation and mislocalization in cells with flow cytometry. Nat. Methods 9, 467–470 [DOI] [PubMed] [Google Scholar]
- 20. Gamerdinger M., Kaya A. M., Wolfrum U., Clement A. M., Behl C. (2011) BAG3 mediates chaperone-based aggresome-targeting and selective autophagy of misfolded proteins. EMBO Rep. 12, 149–156 [DOI] [PMC free article] [PubMed] [Google Scholar]
- 21. Gupta R., Kasturi P., Bracher A., Loew C., Zheng M., Villella A., Garza D., Hartl F. U., Raychaudhuri S. (2011) Firefly luciferase mutants as sensors of proteome stress. Nat. Methods 8, 879–884 [DOI] [PubMed] [Google Scholar]
- 22. Arrasate M., Mitra S., Schweitzer E. S., Segal M. R., Finkbeiner S. (2004) Inclusion body formation reduces levels of mutant huntingtin and the risk of neuronal death. Nature 431, 805–810 [DOI] [PubMed] [Google Scholar]