

Background: A recent study reported that Caulobacter crescentus FtsZ (CcFtsZ) required 10 min to reach a plateau, 10–100 times slower than other bacteria.
Results: We assayed assembly of CcFtsZ and found that it reached steady state in 5–10 s.
Conclusion: The slow kinetics in the previous study may have resulted from nucleotide deprivation.
Significance: CcFtsZ assembly kinetics are similar to those of other bacteria.
Keywords: Bacteria, Cell Division, Electron Microscopy (EM), Fluorescence, GTPase, Tubulin
Abstract
FtsZ from most bacteria assembles rapidly in vitro, reaching a steady-state plateau in 5–10 s after addition of GTP. A recent study used a novel dynamic light-scattering technique to assay the assembly of FtsZ from Caulobacter crescentus (CcFtsZ) and reported that assembly required 10 min, ∼100 times slower than for related bacteria. Previous studies had indicated normal, rapid assembly of CcFtsZ. We have reinvestigated the assembly kinetics using a mutant L72W, where assembly of subunits into protofilaments results in a significant increase in tryptophan fluorescence. We found that assembly reached a plateau in 5–10 s and showed no change in the following 10 min. This was confirmed by 90° light scattering and negative-stain electron microscopy. The very slow kinetics in the dynamic light-scattering study may be related to a refractory state induced when the FtsZ protein is stored without nucleotide, a phenomenon that we had observed in a previous study of EcFtsZ. We conclude that CcFtsZ is not an outlier, but shows rapid assembly kinetics similar to FtsZ from related bacteria.
Introduction
FtsZ (filamentous temperature-sensitive Z)2 is a bacterial tubulin homologue essential for cell division in almost all bacteria and in many archaea. Individual FtsZ molecules assemble into protofilaments, which further associate to make the Z ring at the site of cytokinesis. The Z ring may be a ribbon of 3–9 parallel protofilaments connected by loose lateral interactions (1) or a more scattered band of protofilaments with sparse association (2, 3). In addition to providing the cytoskeletal framework for the division apparatus, FtsZ appears to generate the constriction force that invaginates the membrane (4, 5). The overall process of cell division has been reviewed by Lutkenhaus et al. (6) and de Boer (7); more focused reviews of FtsZ are by Erickson et al. (8) and Mingorance et al. (9); the proteins that directly bind and regulate FtsZ are reviewed by Adams and Errington (10).
Assembly of FtsZ in vitro was initially characterized by EM, centrifugation, and light scattering. Mukherjee and Lutkenhaus (11) used a centrifugation assay to show that Escherichia coli FtsZ (EcFtsZ) assembled with a critical concentration, characteristic of cooperative assembly, and that polymers disassembled when the supply of GTP was exhausted. 90° light scattering has also been used to monitor assembly (12, 13). A problem with both centrifugation and light scattering is that they are sensitive to polymer size: they underreport short filaments and overreport polymer when filaments bundle.
Chen et al. (14) constructed the EcFtsZ mutant L68W and found that the tryptophan fluorescence increased >2-fold upon assembly. Leu-68 is located on the edge of the longitudinal interface connecting FtsZ subunits into protofilaments, and the Trp at this position is presumably partially buried when it forms the interface with the adjacent subunit, causing the change in fluorescence (15). The fluorescence change reports the number of FtsZ subunits making an interface and is thus a measure of total polymer independent of filament length and bundling. This provided an assay that could be used to follow kinetics of assembly. When assembly was initiated by adding GTP, there was a short lag followed by rapid assembly, which reached a plateau within 5–10 s. Assembly was cooperative, with a critical concentration and a weak dimer nucleus.
Recently Hou et al. (16) reported experiments measuring the assembly kinetics of FtsZ from Caulobacter crescentus (CcFtsZ). They used a novel assay based on dynamic light scattering and reported that assembly of CcFtsZ required 10 min to reach a plateau. This is 5–10 times slower even than MtbFtsZ (17), the slowest assembly so far reported for FtsZ, and 100 times slower than EcFtsZ. Two previous studies of CcFtsZ in vitro had not noted abnormally long assembly times. Thanbichler and Shapiro (18) showed linear hydrolysis of GTP from 5 to 25 min, extrapolating to 0 at 0 min, indicating that steady state was established very rapidly. Goley et al. (19) showed negative stain EM from 30 s to 8 min; they also showed light-scattering reaching a plateau in ∼10 s (their Fig. S3). These reactions contained the FtsZ-interacting protein FzlA, which generated some spiral polymers at later times. But the dense background of single-stranded FtsZ protofilaments was already established at 30 s and showed no change over 8 min. In both of these studies the rate of GTP hydrolysis was close to that of EcFtsZ, suggesting similar assembly dynamics. Hou et al. also reported steady-state GTP hydrolysis similar to that of EcFtsZ (16). The extremely slow assembly reported by the dynamic light-scattering technique appeared contrary to these previous studies and to the relatively rapid GTPase in their own study. We therefore decided to reinvestigate the kinetics of assembly of CcFtsZ using a rapid-readout fluorescence assay.
EXPERIMENTAL PROCEDURES
CcFtsZ Purification and Labeling
CcFtsZ and all mutant proteins were expressed from plasmid pMT219 (18), provided by Dr. Erin Goley, Johns Hopkins University; mutant L72W was engineered in this plasmid using site-directed mutagenesis. Proteins were purified as described previously (18) with the following exceptions. Briefly, the soluble bacterially expressed protein was precipitated with 20% ammonium sulfate followed by chromatography on a Resource Q 10/10 column (GE Healthcare) with a linear gradient of 50–500 mm KCl in 50 mm Tris, pH 7.9, 0.1 mm EDTA, 1 mm mercaptoethanol, 10% glycerol. Peak fractions were identified by SDS-PAGE and stored at −80 °C.
Before each experiment, a round of calcium assembly/disassembly was performed to remove inactive protein. The protein was first dialyzed into 50 mm HEPES, pH 7.2, 50 mm KCl, 0.1 mm EDTA, 1 mm mercaptoethanol. CaCl2 and GTP were added to a final concentration of 10 and 2 mm, respectively. After a 5-min incubation at 37 °C, protein polymers were centrifuged at 60,000 rpm, 30 min, 10 °C (Beckman TLA100 rotor). FtsZ was resuspended in the appropriate buffer and further clarified by centrifugation at 45,000, 20 min, 10 °C. A reducing agent-compatible BCA assay (Pierce) was performed to determine the protein concentration, which was corrected for the 75% color ratio of EcFtsZ/BSA (20).
Buffers Used for Assembly
We studied assembly in two buffers used in previous studies of CcFtsZ. Buffer A contained 50 mm HEPES, pH 7.2, 0.1 mm EDTA, 2.5 mm MgCl2, 50 mm KCl, 1 mm mercaptoethanol, and was equivalent to that used by Thanbichler and Shapiro and Goley et al. Buffer B contained 50 mm MES-NaOH, pH 6.5, 10 mm MgCl2, 50 mm KCl, 1 mm mercaptoethanol, and matched that used by Hou et al. In each case we also tested the effect of Mg at 2.5 and 10 mm.
Negative-stain Electron Microscopy
FtsZ filaments were imaged by negative-stain electron microscopy. 5 μm FtsZ was mixed with 1 mm GTP and incubated for the indicated amount of time at room temperature. A 10-μl sample was placed on a UV-treated carbon-coated grid (1), withdrawn within 10 s, and the grid was stained with 3 drops of 2% uranyl acetate. Images were collected on a Philips 420 electron microscope at ×49,000 magnification.
GTPase Assay
GTP hydrolysis was measured using a continuous, regenerative coupled GTPase assay (17, 21). In this assay, all free GDP in solution is rapidly regenerated into GTP, and the GTP hydrolysis rate is measured by the decrease in absorption of NADH. The reaction mixture contained 1 mm phosphoenolpyruvate, 0.8 mm NADH, 20 units/ml pyruvate kinase/lactate dehydrogenase, and 0.5 mm GTP. A 3-mm path length was used. Measurements were made with a Shimadzu UV-2401PC spectrophotometer in a thermostatically controlled cell at 25 °C. Hydrolysis was plotted as a function of FtsZ concentration, and the slope of the line above the critical concentration was taken as the hydrolysis rate.
Fluorescence Assays
All fluorescence assays were performed with a Shimadzu RF-5301 PC spectrofluorometer in a thermostatically controlled cell at 25 °C. Light-scattering assays (excitation and emission at 350 nm) were performed with 5 μm FtsZ in the appropriate buffer with the addition of 1 mm GTP. Assembly kinetics of the L72W mutant were monitored by measuring the tryptophan emission at 344 nm, with excitation at 295 nm. GTP has an absorbance shoulder at 295 nm, which blocks the excitation at 1 mm concentrations. We found the largest fluorescence change for GTP concentrations of 25–100 μm, and we routinely used 50 μm GTP for these assembly assays.
RESULTS
Light-scattering Assay Suggests Bundle Formation
We first examined CcFtsZ assembly via a light-scattering assay. Here, the FtsZ-GDP signal was recorded for 2 min, followed by the addition of GTP. In all conditions tested, the light-scattering signal changed immediately after GTP was added and remained constant for 25 min (Fig. 1). These data suggest that assembly occurs very quickly, in less than 1 min, and then remains at a steady state. The light-scattering signal was the highest in pH 6.5, 10 mm Mg, suggesting the presence of bundles/protein aggregation (Fig. 1). The light-scattering signal for this condition was also higher in GDP than in all other conditions examined. This result suggests that the pH 6.5, 10 mm Mg buffer causes the protein to form aggregate-like structures even before initiation of assembly. On the other hand, three of the conditions examined (pH 6.5, 2.5 mm magnesium; pH 7.2, 2.5 mm magnesium; and pH 7.2, 10 mm magnesium) had similar light-scattering signals, suggesting less aggregation before assembly and less bundle formation during assembly. Goley et al. (19) also performed a light-scattering assay, showing similar rapid assembly (their Fig. S3F).
FIGURE 1.
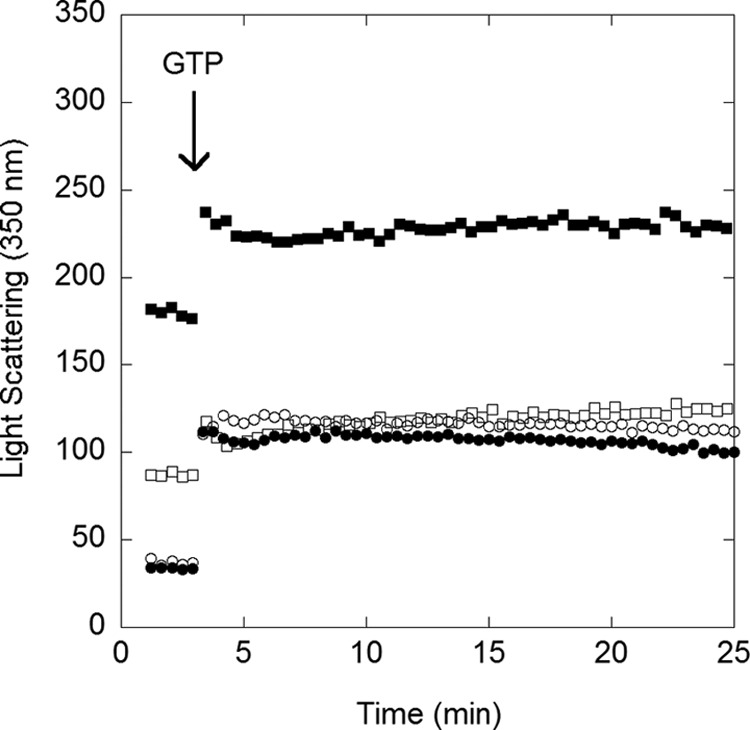
Light-scattering assay showed rapid assembly. The base-line signal of CcFtsZ-GDP was collected for 2 min. Assembly was initiated by the addition of 1 mm GTP, and the signal was monitored for 25 min. The first time point was ∼5–10 s after mixing. Buffer conditions: pH 6.5, 2.5 mm Mg (open squares); pH 6.5, 10 mm Mg (filled squares); pH 7.2, 2.5 mm Mg (open circles); pH 7.2, 10 mm Mg (filled circles).
Negative-stain Electron Microscopy Revealed Protofilaments and Small Bundles
We next investigated FtsZ assembly at various time points with negative-stain EM. At pH 6.5, 10 mm Mg (Fig. 2, A–C), single protofilaments and small bundles were detected as early as 15 s after the addition of GTP. The EM structures were similar at 15 s, 2 and 10 min, in agreement with the light-scattering assays where the initial rapid signal change was followed by a long, flat plateau. Some small bundles were also detected at pH 7.2 in 10 mm Mg (Fig. 2F). At lower Mg concentrations, mostly single-stranded protofilaments were observed (Fig. 2, D and E). These data would suggest that the bundles were a consequence of the high Mg concentration, rather than pH. (Light scattering at pH 7.2 showed an identical response in 2.5 and 10 mm Mg, suggesting no difference in bundling. The EM observation may therefore be detecting a small fraction of bundles in the sample.)
FIGURE 2.

Negative-stain EM. CcFtsZ formed protofilaments and small bundles. CcFtsZ was incubated with 1 mm GTP for the indicated time and then imaged by negative-stain EM. Arrows indicate apparent bundles that are thicker than the thinnest protofilaments. Scale bar, 200 nm.
In all cases the EM showed a mixture of straight and curved protofilamens. The curved protofilaments were especially prominent in the pH 6.5 buffers (Fig. 2, A–D). The protofilaments in our pH 7.2, 2.5 mm Mg sample (Fig. 2E) are very similar to those in Fig. 6a of Goley et al. (19). Our image in Fig. 2C (pH 6.5, 10 mm Mg, 10 min) shows a mixture of curved and straight protofilaments and straight bundles, very similar to Fig. 2b of Hou et al. (16) under the same conditions. Overall our EM is in agreement with previous studies of CcFtsZ. The major difference with EcFtsZ is the abundance of curved protofilaments in the CcFtsZ assembly (see “Discussion”).
GTP Hydrolysis Was Slower in pH 6.5, 10 mm Mg
In our assays, the GTP hydrolysis rate in pH 6.5, 10 mm Mg was 2-fold less than in pH 7.2, 2.5 mm Mg (Fig. 3 and Table 1). At pH 6.5, hydrolysis was similar at 2.5 and 10 mm Mg, suggesting that the GTP hydrolysis is affected more by pH than by Mg concentration. Our hydrolysis rate at pH 7.2, 2.5 mm Mg is somewhat lower than the previously published values (18, 19) (Table 1). The hydrolysis by the mutant L72W was slower than that of wild type FtsZ, consistent with the higher affinity (lower critical concentration) for this mutant. The E. coli mutant L68W had a similarly reduced GTP hydrolysis, about half the rate of wild type FtsZ (22).
FIGURE 3.
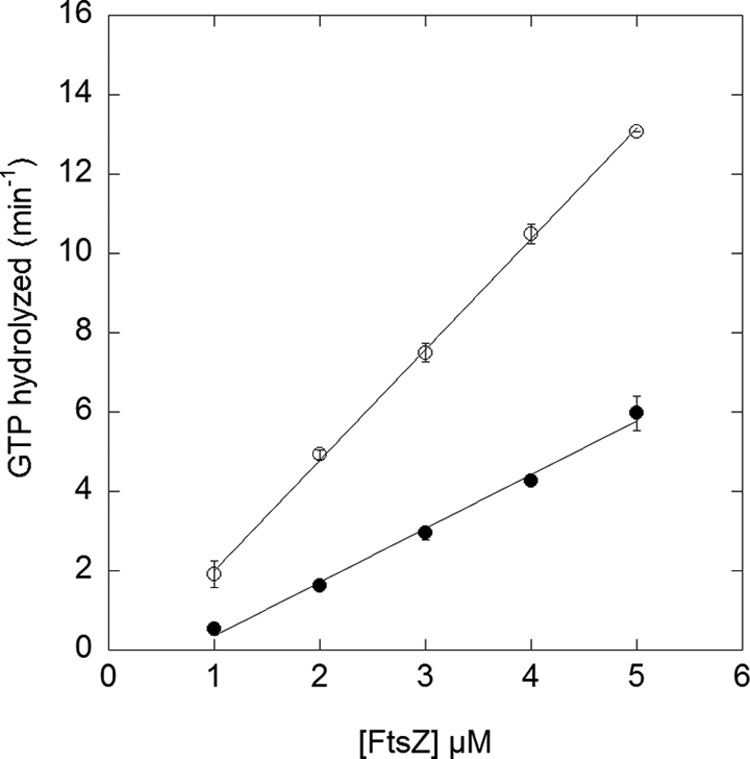
GTPase as a function of CcFtsZ concentration. The buffer was pH 7.2, 2.5 mm Mg (open circles) and pH 6.5, 10 mm Mg (filled circles). Error bars represent the S.D. of duplicate experiments.
TABLE 1.
GTP hydrolysis rates for CcFtsZ in different buffer conditions
| Buffer and source | Pi/min/FtsZ |
|---|---|
| a) pH 7.2, 2.5 Mg (present study) | 2.8 |
| b) pH 7.2, 2.5 Mg (19) | 3.5a |
| c) pH 7.2, 2.5 Mg (18) | 3.8a |
| d) pH 6.5, 10 Mg (16) | 3a |
| d) pH 6.5, 10 mm Mg (present study) | 1.4 |
| e) pH 6.5, 2.5 mm Mg (present study) | 1.5 |
| f) L72W pH 7.2, 2.5 Mg (present study) | 0.80 |
a Published rates were reduced by a factor of 0.75 to account for the ∼0.75 color ratio of EcFtsZ/BSA in the BCA and Bradford protein assays (20), which was not applied to protein concentrations in the published papers.
Fluorescence Assays Show Rapid Assembly
To examine further the kinetics of FtsZ assembly, we prepared the CcFtsZ mutant L72W. This is equivalent to the L68W mutant of EcFtsZ, which reported assembly by a 2-fold increase in the tryptophan fluorescence (14). The CcFtsZ L72W showed normal assembly of protofilaments as detected by negative-stain EM (data not shown). The GTPase of this mutant was 3.5-fold lower than wild type (Table 1), which reflects a slower turnover at steady state, consistent with the lower critical concentration. Fig. 4A shows the assembly kinetics at different concentrations of CcFtsZ L72W. Once assembly was initiated by the addition of GTP, the fluorescence signal increased rapidly and reached a plateau in about 5–10 s. The plateau remained constant for 10 min (data not shown), suggesting that assembly was complete and at a stable steady state. To determine the critical concentration, the signal change was plotted against total CcFtsZ concentration (Fig. 4B). For pH 7.2, 2.5 mm Mg, the critical concentration was determined to be 0.29 μm, whereas at pH 6.5, the critical concentration was higher at 1.1 μm. At pH 6.5 the fluorescence assay showed assembly to be identical in 2.5 and 10 mm Mg. That is consistent with the interpretation that the Trp in L72W is responding to the longitudinal interfaces in the protofilaments and is not influenced by bundling. These values agreed with the critical concentrations determined from the GTPase assay (Fig. 3).
FIGURE 4.
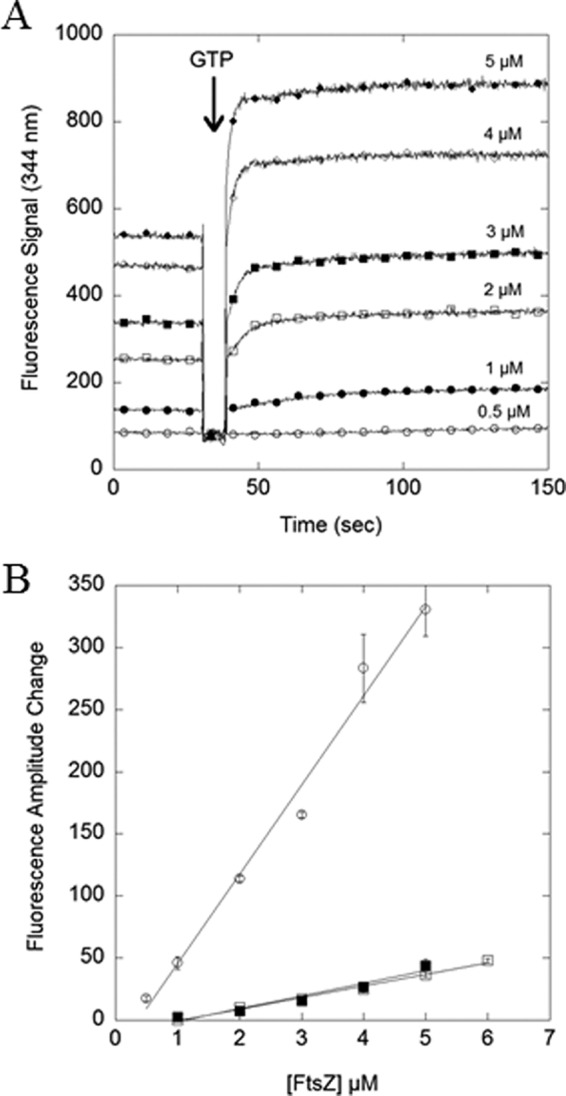
Tryptophan fluorescence assay showed rapid assembly. Assembly was monitored by the change in fluorescence of tryptophan at 334 nm. The CcFtsZ L72W-GDP signal was collected for 30 s at multiple concentrations of CcFtsZ (listed in the figure). A, assembly was initiated by the addition of 50 μm GTP, and the signal was monitored for 150 s. B, the fluorescence amplitude change (plateau value in GTP minus GDP level) was plotted against CcFtsZ concentration. Buffer conditions: pH 7.2, 2.5 mm Mg (open circles, also shown in A); pH 6.5 2.5 mm Mg (filled squares); pH 6.5, 10 mm Mg (open squares). Error bars represent S.D. of three replicates.
DISCUSSION
Our fluorescence and light-scattering assays show that assembly of CcFtsZ is rapid, reaching a steady-state plateau in 5–10 s, at both pH 6.5 and 7.2, and in 2.5 and 10 mm Mg. This is very similar to EcFtsZ and is consistent with the results of Thanbichler and Shapiro (18) and Goley et al. (19). Our results are not consistent with the recent study of Hou et al. (16), who reported that assembly required 10 min to reach a plateau. We note, however, that the dynamic light-scattering technique used in that study required approximately 1 min to acquire the first data point, so the rapid assembly that we observed would only show up in their first data point.
In fact, the data of Hou et al. (16) do show an initial jump in τ at the first time point, and it amounts to one half to two thirds of the final plateau. This suggests that more than half of their protein did assemble very quickly, before their first time point at 1 min. This would correspond to the rapid assembly that we observe. Nevertheless, the slow rise in τ observed by Hou et al. (16) from 1 to 10 min suggests an additional assembly over this period. In contrast, our static light scattering, tryptophan fluorescence, and EM showed no change in assembly from 15 s to 10 min.
A key to the apparent discrepancy is their experiment where assembly was cycled through two or more rounds of assembly, adding fresh GTP after the original assembly had depleted its GTP and depolymerized. After two or more rounds of assembly and disassembly, the slow phase of assembly disappeared; the assembly jumped to its plateau value by the first time point (∼1 min) after addition of GTP. Importantly, the same result was obtained by treating the FtsZ with GDP before initiating assembly with GTP. When 0.75 mm GDP was added to the FtsZ and assembly was induced 5 min later with 0.25 mm GTP, τ jumped immediately to its plateau value.
This is similar to a curious effect we discovered in a recent study, using tryptophan fluorescence of EcFtsZ mutant L189W to monitor assembly (15). We found that protein transferred from a freezer stock to assembly buffer showed complicated, two stage kinetics upon addition of GTP: a rapid assembly in 5–10 s, and a slow phase of 5–10 min. Incubation with GDP for 10 min eliminated the slow phase, as did cycling the protein through Ca assembly. We preferred the Ca assembly because it eliminated any inactive protein and left the FtsZ with a slight excess of GDP. We concluded that storing the protein without nucleotide induced a refractory state that was slowly resolved by addition of GDP or GTP and completely eliminated by the cycle of Ca assembly. The refractory state is probably not physiologically relevant because the cytoplasm maintains a relatively high concentration of nucleotides.
Our light scattering and EM suggest that CcFtsZ shows some tendency to bundle at 10 versus 2.5 mm Mg, especially at pH 6.5. The free Mg in E. coli cytoplasm is about 1 μm (23), suggesting that the bundling at 10 mm Mg is not physiological. pH had a more dramatic effect. At pH 7.2 we reproducibly obtained EM showing thin protofilaments, some straight and some curved, on a clean background. At pH 6.5 similar protofilaments were seen, but the background showed many small particles. Also at pH 6.5 the tryptophan fluorescence change upon assembly was much smaller, and the GTP hydrolysis rate was about half that at pH 7.2. We suggest that the preferred buffer for assembly studies of CcFtsZ is pH 7.2, 2.5 mm Mg, and 50–200 mm potassium.
An interesting aspect of our EM is that CcFtsZ showed a mixture of straight and curved protofilaments. The curvature was relatively uniform, and similar to the curvature of filaments assembled by CcFtsZ in GMPCPP or in GTP plus EDTA (19). In that previous study the assembly and the curved form were greatly enhanced by addition of FzlA, but predominantly curved protofilaments were also seen in EDTA without FzlA (their Fig. S5B). We suggest that this curvature is related to the “intermediate curved” conformation, which is approximately 200 nm in diameter for EcFtsZ (seen in toroids in Ref. 24 and discussed in Ref. 8). The curved filaments of CcFtsZ were approximately 75 nm in diameter in the study of Goley et al. (19). The curved protofilaments in our images varied from ∼60 to 80 nm in diameter. The diameter of the intermediate curved conformation may vary for FtsZ from different bacterial species.
This work was supported, in whole or in part, by National Institutes of Health Grant GM66014 (to H. P. E.).
- FtsZ
- filamentous temperature-sensitive Z
- CcFtsZ
- FtsZ from Caulobacter crescentus
- EcFtsZ
- FtsZ from Escherichia coli.
REFERENCES
- 1. Milam S. L., Osawa M., Erickson H. P. (2012) Negative-stain electron microscopy of inside-out FtsZ rings reconstituted on artificial membrane tubules show ribbons of protofilaments. Biophys. J. 103, 59–68 [DOI] [PMC free article] [PubMed] [Google Scholar]
- 2. Li Z., Trimble M. J., Brun Y. V., Jensen G. J. (2007) The structure of FtsZ filaments in vivo suggests a force-generating role in cell division. EMBO J. 26, 4694–4708 [DOI] [PMC free article] [PubMed] [Google Scholar]
- 3. Fu G., Huang T., Buss J., Coltharp C., Hensel Z., Xiao J. (2010) In vivo structure of the E. coli FtsZ-ring revealed by photoactivated localization microscopy (PALM). PLoS One 5, e12682. [DOI] [PMC free article] [PubMed] [Google Scholar]
- 4. Osawa M., Anderson D. E., Erickson H. P. (2008) Reconstitution of contractile FtsZ rings in liposomes. Science 320, 792–794 [DOI] [PMC free article] [PubMed] [Google Scholar]
- 5. Osawa M., Erickson H. P. (2011) Inside-out Z rings: constriction with and without GTP hydrolysis. Mol. Microbiol. 81, 571–579 [DOI] [PMC free article] [PubMed] [Google Scholar]
- 6. Lutkenhaus J., Pichoff S., Du S. (2012) Bacterial cytokinesis: from Z ring to divisome. Cytoskeleton 69, 778–790 [DOI] [PMC free article] [PubMed] [Google Scholar]
- 7. de Boer P. A. (2010) Advances in understanding E. coli cell fission. Curr. Opin. Microbiol. 13, 730–737 [DOI] [PMC free article] [PubMed] [Google Scholar]
- 8. Erickson H. P., Anderson D. E., Osawa M. (2010) FtsZ in bacterial cytokinesis: cytoskeleton and force generator all in one. Microbiol. Mol. Biol. Rev. 74, 504–528 [DOI] [PMC free article] [PubMed] [Google Scholar]
- 9. Mingorance J., Rivas G., Vélez M., Gómez-Puertas P., Vicente M. (2010) Strong FtsZ is with the force: mechanisms to constrict bacteria. Trends Microbiol. 18, 348–356 [DOI] [PubMed] [Google Scholar]
- 10. Adams D. W., Errington J. (2009) Bacterial cell division: assembly, maintenance and disassembly of the Z ring. Nat. Rev. Microbiol. 7, 642–653 [DOI] [PubMed] [Google Scholar]
- 11. Mukherjee A., Lutkenhaus J. (1998) Dynamic assembly of FtsZ regulated by GTP hydrolysis. EMBO J. 17, 462–469 [DOI] [PMC free article] [PubMed] [Google Scholar]
- 12. Mukherjee A., Lutkenhaus J. (1999) Analysis of FtsZ assembly by light scattering and determination of the role of divalent metal cations. J. Bacteriol. 181, 823–832 [DOI] [PMC free article] [PubMed] [Google Scholar]
- 13. González J. M., Jiménez M., Vélez M., Mingorance J., Andreu J. M., Vicente M., Rivas G. (2003) Essential cell division protein FtsZ assembles into one monomer-thick ribbons under conditions resembling the crowded intracellular environment. J. Biol. Chem. 278, 37664–37671 [DOI] [PubMed] [Google Scholar]
- 14. Chen Y., Bjornson K., Redick S. D., Erickson H. P. (2005) A rapid fluorescence assay for FtsZ assembly indicates cooperative assembly with a dimer nucleus. Biophys. J. 88, 505–514 [DOI] [PMC free article] [PubMed] [Google Scholar]
- 15. Chen Y., Erickson H. P. (2011) Conformational changes of FtsZ reported by tryptophan mutants. Biochemistry 50, 4675–4684 [DOI] [PMC free article] [PubMed] [Google Scholar]
- 16. Hou S., Wieczorek S. A., Kaminski T. S., Ziebacz N., Tabaka M., Sorto N. A., Foss M. H., Shaw J. T., Thanbichler M., Weibel D. B., Nieznanski K., Holyst R., Garstecki P. (2012) Characterization of Caulobacter crescentus FtsZ protein using dynamic light scattering. J. Biol. Chem. 287, 23878–23886 [DOI] [PMC free article] [PubMed] [Google Scholar]
- 17. Chen Y., Erickson H. P. (2008) In vitro assembly studies of FtsZ/tubulin-like proteins (TubZ) from Bacillus plasmids: evidence for a capping mechanism. J. Biol. Chem. 283, 8102–8109 [DOI] [PMC free article] [PubMed] [Google Scholar]
- 18. Thanbichler M., Shapiro L. (2006) MipZ, a spatial regulator coordinating chromosome segregation with cell division in Caulobacter. Cell 126, 147–162 [DOI] [PubMed] [Google Scholar]
- 19. Goley E. D., Dye N. A., Werner J. N., Gitai Z., Shapiro L. (2010) Imaging-based identification of a critical regulator of FtsZ protofilament curvature in Caulobacter. Mol. Cell 39, 975–987 [DOI] [PMC free article] [PubMed] [Google Scholar]
- 20. Lu C., Stricker J., Erickson H. P. (1998) FtsZ from Escherichia coli, Azotobacter vinelandii, and Thermotoga maritima: quantitation, GTP hydrolysis, and assembly. Cell Motil. Cytoskeleton 40, 71–86 [DOI] [PubMed] [Google Scholar]
- 21. Ingerman E., Nunnari J. (2005) A continuous, regenerative coupled GTPase assay for dynamin-related proteins. Methods Enzymol. 404, 611–619 [DOI] [PubMed] [Google Scholar]
- 22. Redick S. D., Stricker J., Briscoe G., Erickson H. P. (2005) Mutants of FtsZ targeting the protofilament interface: effects on cell division and GTPase activity. J. Bacteriol. 187, 2727–2736 [DOI] [PMC free article] [PubMed] [Google Scholar]
- 23. Froschauer E. M., Kolisek M., Dieterich F., Schweigel M., Schweyen R. J. (2004) Fluorescence measurements of free [Mg2+] by use of mag-fura 2 in Salmonella enterica. FEMS Microbiol. Lett. 237, 49–55 [DOI] [PubMed] [Google Scholar]
- 24. Popp D., Iwasa M., Narita A., Erickson H. P., Maéda Y. (2009) FtsZ condensates: an in vitro electron microscopy study. Biopolymers 91, 340–350 [DOI] [PMC free article] [PubMed] [Google Scholar]