Abstract
The authors exposed a non-equilibrium dynamic counterion and coion analyte concentration to an AC electric field to selectively concentrate peptides at the poles of a cation-selective granule. The counterion polarization results from the focusing of the electric field show a discontinuous drop in the intra-granule counterion electromigration flux at the pole. The coion concentration polarization is due to the combined external convective and electromigration fluxes toward the pole that neutralize the accumulating counterions. Because the electromigration mobility of the peptide anion analyte depends on the pH, the authors determined a 20 000-fold high concentration factor for a near-neutral pH of 6.0 to 7.7. Because the peptide is protonated at the acidic pole and its absolute charge ranges from −0.3 to −1.9, the concentration factor scales exponentially with the absolute charge, thus allowing extremely selective concentrations of various peptides, which is demonstrated by fluorescein isothiocyanate tagged angiotensin I (pI ∼ 5.8) and Texas red tagged avidin (pI ∼ 10.5). This dynamic concentration effect can substantially enhance the sensitivity of bio-assays.
INTRODUCTION
Biomarkers, such as stressed (oxidized) lipids, prostaglandins, and steroids, have been suggested for use in the early diagnosis of numerous diseases, including multiple sclerosis, Alzheimer's disease, and Niemann-Pick C.1, 2 Other small molecules, such as natriuretic peptides, have also been used as biomarkers for cardio-vascular diseases. However, despite the available ancillary sample pre-treatment techniques, identifying and quantifying these small molecules by using mass spectrometry, immuno-assays, surface plasmon resonance, or enzyme-linked immunosorbent assay remains difficult because of their miniscule concentrations (below pg/ml) in typical physiological samples with complex matrices such as cerebrospinal fluid. Fundamental improvements in analytical science must be implemented before such biomarker detection is feasible. The dielectrophoretic concentration method does not apply to small molecules, such as peptides, because of the small intensities of their induced dipoles,4 unless this method is conducted in laboriously fabricated nanochannels.6 Other analyte concentration techniques based on electrokinetic mechanisms have been suggested. A DC field induced ion-depleted region in front of an ion-selective membrane has been shown to concentrate both the coions and counterions of the electrolyte pumped across a depleted region by a million fold.3 In a previous study, we showed that a low frequency AC field (<100 Hz), when applied across an ion-selective granule, concentrates the charged counterion and coion dye molecules a million fold at the poles of the granule. Because of the analyte capacitor at the pole of the granule, such dynamic concentration is higher than that of a DC analog.5 Hence, the DC and AC concentration techniques employed near the surface of an ion-selective media are the most promising techniques for assessing small molecules. Despite the charge selectivity of the medium near which the concentrated bands are created, both the DC and AC techniques concentrate cations and anions, albeit by using distinct mechanisms.
Recent fundamental studies of ion transport in and near ion-selective media offer substantial insight into the mechanisms by which such media induce concentration and charge polarization. Charge polarization occurs either on the electrolyte side of the membrane surface or on the granule side because of jumps in ion fluxes across that location. The driving ion fluxes include counterion flux within the medium,7 tangential Debye layer conduction around a particle,8, 9, 10 normal ion charging into the Debye layer,11, 12, 13 and convective ion fluxes on the surface of the medium.14, 15 Recent studies of ion migration in conic nano-pores and nano-conduits in granules7, 16 have also suggested that concentration enrichment and depletion (and charge storage) occurs within an ion-selective medium.
Two recent articles thoroughly discussed the influence of micro-scale hydrodynamics near ion-selective substrates, such as membranes and nano-slots, on the ion flux in nano-conduits.17, 18 In brief, under an external field, the I-V curve consists of three regimes: an Ohmic regime, in which the highest drop in voltage occurs at the substrate; a limiting current regime, in which the current saturates because of the external ion concentration and charge polarization at the two surfaces of the substrate; and an overlimiting current regime, in which the space charge produces micro-vortices at the conduit inlets that enhance the current, creating a voltage function.
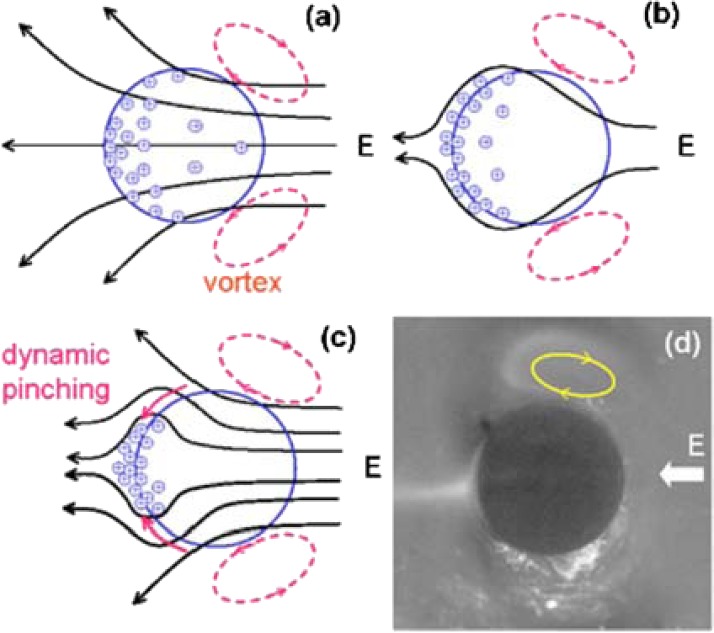
The dynamic concentration technique that used a low-frequency AC field in our previous paper5 also relied on a combination of these intra and external concentration polarization mechanisms in the limiting current regime,14 amplified by the geometrical focusing effect of the spherical granule. Fig. 1 shows that the spherical geometry acts like a lens for the electric field, focusing the intra-granule electromigration flux of counterions (primarily, the highly mobile protons for the cation-selective granule shown in Fig. 1 but also the minority counterion analytes that are small enough to enter the granule) toward the exiting pole. Because of the conductivity jump at the pole, a large buildup of protons and other counter-ions occurs at the pole that must be neutralized by the coions outside the granule, thus increasing the local coion analyte concentration. To prevent excessive charge buildup and to stabilize the concentrated polar region, the neutralizing coion flux must be as large as the counterion flux from the granule. This coion flux does not pass through the ion-selective granule and cannot be sustained by external electromigration or slow diffusion. In significantly large fields (100 V/cm), there is a robust external electro-osmotic convective ion flux toward the pole, bringing sufficient coions to neutralize the protons at the pole. However, in the transient conditions of polar concentration in a low-frequency AC field, the coions that convect to the poles must migrate toward the granule surface by electromigration, driven by the field of the concentrated positive charge at the pole. The involvement of electromigration in coion concentration implies that high-mobility external anions, such as OH− ions, are expected to be preferentially trapped in the concentrated region without entering the granule. However, in near pH neutral conditions, insufficient OH− ions exist to neutralize all the protons at the poles and larger anion peptide coions are expected to concentrate to the same degree as the counterion protons. This near neutral pH dynamic concentration of anions increases with the charge state and mobility of the peptide. Similarly, the selective concentration of higher mobility coions outside the granule should also be observed using this dynamic concentration mechanism, in near neutral pH conditions and near the isoelectric point pI of one peptide.
Figure 1.
The granule funnel: (a) vortices develop at the right of the granule; (b) saturation of the double layer saturates at the pole when counter-ions exiting the granule and field screening occurs; (c) a converging coion electromigration flux toward the positively charged pole neutralizes the concentrated protons; and (d) polar ejection and symmetric vortices on the other hemisphere (the white area in the image in Fig. 1 is due to the scattered light that reflects from a coarse surface). Reprinted with permission from Wang et al. Biomicrofluidics 2, 014102 (2008). Copyright 2008 American Institute of Physics.
This concentration of external coions has a transient nature. As the electro-osmotic velocity field has a stagnation point at the pole with vanishingly small velocity, the dimension of the concentrated region (roughly 100 μm) is determined by normal diffusion, or electromigration and tangential convection.5 Once the concentrated region exceeds this dimension, the neutralizing coions can no longer be trapped at the polar region and a rapid and irreversible charge accumulation occurs. Hence, this polar concentration region has a finite capacitance for the analyte and charge. Our microscopic fluorescence images demonstrate that prolonged charging produces a phenomenon akin to dielectric breakdown [Fig. 1d]. Coulomb repulsion within the polar region irreversibly ejects counter ion dyes, releasing the concentrated load.3 Hence, an optimum loading period exists and our AC previous studies have revealed an optimum frequency at which the concentration factor (CF) can be a million times larger than the DC value after the analyte ejection5 (the supplementary materials detail a film that demonstrates a typical anionic fluorescein concentration when an applied field frequency of approximately 0.5 Hz is applied to a cation exchange granule).19
In this study, we selectively concentrate anion peptides by using the aforementioned AC mechanism. We tuned the concentration factor by varying the charge state and mobility of fluorophore-tagged angiotensin I and Texas red-tagged avidin in various pH conditions.
EXPERIMENT
We obtained angiotensin I from MDBio, Inc. (Taipei, Taiwan), conjugating it by using fluorescence dye fluorescein isothiocyanate (FITC) via one acryl linker. We dissolved FITC-angiotensin I in tris(hydroxymethyl) aminomethane buffer (10 mM; pH 5.8 to pH 10) to prepare the standard solution of anionic dyes at the required concentrations of 0.10 μM, 0.50 μM, 1.0 μM, 5.0 μM, and 50 μM. Table TABLE I. lists the charge states of the FITC-tagged angiotensin I for each pH condition and Appendix A describes the procedures for assigning charge states. Each of the standard solutions at various concentrations was poured into the device reservoir and illuminated using a fluorescence microscopy apparatus (SMZ1500, Nikon). We detected the emitted fluorescence by using a CCD camera (WAT-902H2, Watec, Japan) at a frame rate of 30 Hz for 5 s. The images were collected and the CCD signal intensities at each pixel were averaged. The fluorescence intensity was determined using the difference between the full gray scale of the CCD (255) and the average CCD detected scale at the reservoir area. This difference value was defined as the inverted gray scale.
TABLE I.
List of the charge assignments of each amino acid unit with acidic or basic side chain groups. The carboxylic acid on the C-terminus and the conjugated FITC in the pH solutions are used to estimate the concentration factors of FITC-tagged angiotensin I.
| pH value | FITC (6.4) a | Asp (3.86) | Arg (12.48) | Tyr (10.07) | His (6.04) | His (6.04) | COOH (2.36) | Sum |
|---|---|---|---|---|---|---|---|---|
| 5.85 | −0.22 | −0.99 | 1.00 | 0.00 | 0.61 | 0.61 | −1.00 | 0.01 |
| 6.03 | −0.30 | −0.99 | 1.00 | 0.00 | 0.51 | 0.51 | −1.00 | −0.28 |
| 6.3 | −0.44 | −1.00 | 1.00 | 0.00 | 0.35 | 0.35 | −1.00 | −0.73 |
| 6.46 | −0.53 | −1.00 | 1.00 | 0.00 | 0.28 | 0.28 | −1.00 | −0.98 |
| 6.81 | −0.72 | −1.00 | 1.00 | 0.00 | 0.15 | 0.15 | −1.00 | −1.43 |
| 7.03 | −0.81 | −1.00 | 1.00 | 0.00 | 0.09 | 0.09 | −1.00 | −1.62 |
| 7.3 | −0.89 | −1.00 | 1.00 | 0.00 | 0.05 | 0.05 | −1.00 | −1.79 |
| 7.7 | −0.95 | −1.00 | 1.00 | 0.00 | 0.02 | 0.02 | −1.00 | −1.91 |
| 7.95 | −0.97 | −1.00 | 1.00 | −0.01 | 0.01 | 0.01 | −1.00 | −1.96 |
| 8.01 | −0.98 | −1.00 | 1.00 | −0.01 | 0.01 | 0.01 | −1.00 | −1.96 |
| 8.5 | −0.99 | −1.00 | 1.00 | −0.03 | 0.00 | 0.00 | −1.00 | −2.01 |
| 9 | −1.00 | −1.00 | 1.00 | −0.08 | 0.00 | 0.00 | −1.00 | −2.07 |
| 9.9 | −1.00 | −1.00 | 1.00 | −0.40 | 0.00 | 0.00 | −1.00 | −2.40 |
| 10.52 | −1.00 | −1.00 | 1.00 | −0.74 | 0.00 | 0.00 | −1.00 | −2.74 |
| 10.95 | −1.00 | −1.00 | 1.00 | −0.88 | 0.00 | 0.00 | −1.00 | −2.88 |
The number in the parenthesis indicates the pKa value of the functional group on FITC or side chain of angiotensin I.
We used mm-size commercial conducting cation-exchange granules (made of polystyrene resins) from Bayer. The negatively charged conducting granule was placed in a reservoir with a radius of 0.15 cm and a volume of 10 μl. An external electric field of approximately 100 V/cm was applied to the granule by using a pair of electrodes (separated by 3 cm and housed in side channels of the reservoir), a broad band (0.01 Hz–5000 Hz) power amplifier (Model 10/10B, Trek, NY), and a waveform generator (33220 A, Agilent). The FITC-conjugated angiotensin I (5 μM) in a 10 mM pH buffer was poured into the reservoir prior to applying the field. The chip was housed under the lens of a fluorescence microscope (SMZ1500, Nikon) that used a mercury lamp light source. A monochrome CCD camera (WAT-902H2, Watec, Japan) was used to record images of the process that were digitized and transferred to graphic analysis software (Scion image). We used a fluorescence CCD camera (ProRes MF, Jenoptik, Germany) to acquire color images and employed a built-in software package to digitally filter the fill colors.
RESULTS AND DISCUSSION
We calculated the relation between the inverted gray scale and logarithmic value of the FITC-tagged angiotensin I concentration at various buffer acidities (pH 6.0 to pH 10.0). The regression result for pH 7.0 showed a linear relation with a correlation coefficient of 0.9245.
Fig. 2 shows the fluorescence images of trapping coion FITC-tagged angiotensin I in a pH 7.7 solution (5 μM) within the first half-cycle of applying 100 V/cm at an AC frequency of 0.1 Hz. By using the linear correlation, we estimated the fluorescence intensity at the most concentrated spot in the central image of Fig. 2 corresponded to a concentration factor of 15 000.
Figure 2.

The sequential images of the evolving solute concentration for a cation exchange granule, following an applied field 100 V/cm at an AC frequency of 0.1 Hz. By using FITC tagged angiotensin I in a buffer solution of pH 7.7. The images were taken at 0 s, 1.3 s, and 2 s. The granule image is replaced with a circle filled with brown color.
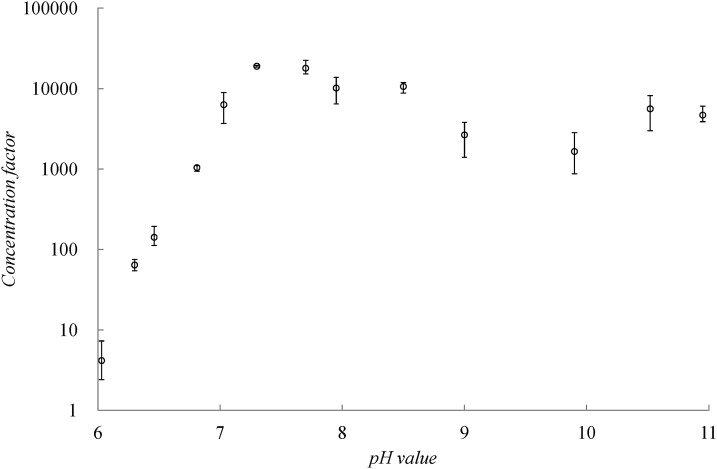
FITC-tagged angiotensin I samples at various pH conditions were also concentrated using the same AC field strength and imaged to estimate the concentration factor. Fig. 3 indicates that the concentration factor increased dramatically at near-pH neutral conditions (pH 6.0 to pH 7.7) when the buffer became more basic. Because the peptide charge and electromigration mobility are expected to increase with pH, this general trend is consistent with the suggested dynamic concentration mechanism for coion peptides. As expected, the concentration factor saturates and even slightly diminishes when the buffer pH is higher than 8 and an excess of high mobility OH− ions exists. When the buffer pH value was 10 and the OH− concentration was 100 μM, the peptide concentration factor of 5 μM decreased approximately 1000 fold. Similarly, when the solute concentration decreased to 0.1 μM, the concentration factor became one order of magnitude lower (approximately 1000 fold) because of the competing OH− ions. To maintain an efficient concentration at 1000 fold or higher, the sample concentration must retain a minimal OH− concentration of 1/100 in the buffer. The concentration factor later recovered to nearly the same level when the buffer pH value was extremely alkaline (pH 11). Under high basicity, the Tris molecules became electrically neutral and absorbed onto the surfaces of the granule, thereby shielding the surface charge. Consequently, the change in conductivity increased at the pole where the analytes were trapped20 and the corresponding higher conductivity jump produced a larger concentration factor to compensate for the loss in concentration factor when the abundant OH− ions competed with the solutes. Compared with the vortices at pH 8, the Dukhin's vortices at pH 11 were less well-defined and their velocity was lower (Fig. 7, Appendix B). By tracking the fluorescent particle trajectories, the speeds of the vortex flows at pH 11 and pH 8 were estimated at 0.45 mm/s and 0.7 mm/s, respectively, when a field strength of 70 V/cm was applied. Slower vortices reduce the convection mechanism for analyte concentration at the pole.
Figure 3.
The concentration factors of FITC tagged angiotensin I in various pH buffer solutions. The concentration factor increases from a moderately acidic condition (pH 6) above the pI to moderately basic condition (pH 7.7), and then decreases slightly when the pH condition becomes more alkaline (pH 8 or greater).
Figure 7.
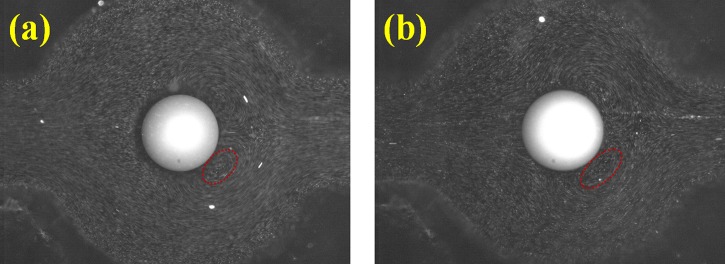
Dukhins vortices near the cation-exchange granules that were generated by a 70 V/cm external field were visualized using fluorescent microspheres (latex micro-particles of 2 μm inner diameter (i.d.) tagged with fluorescein dyes) in buffers with differing basicity: (a) buffer pH 8 and (b) buffer pH 11. The red dashed-line circles indicate the vortex size. The larger vortex size at pH 11 became less defined.
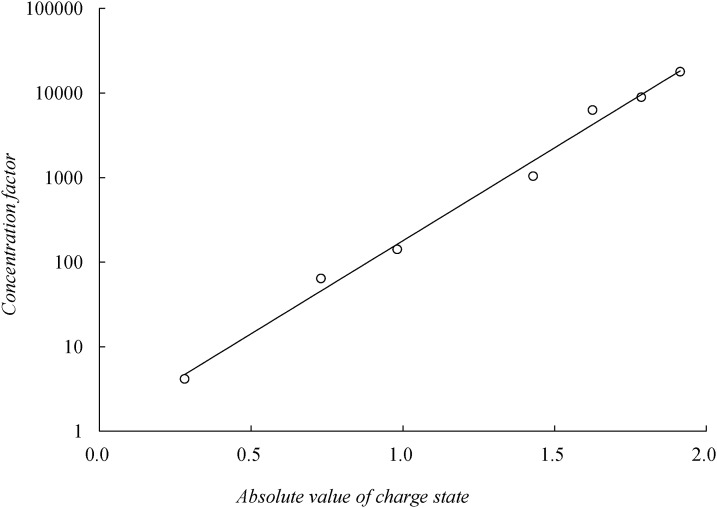
Fig. 4 shows the linear relation between the logarithmic values of the concentration factor, log (CF), and the absolute value of FITC-tagged angiotensin I charge states (z) for pH conditions of 6.0 to 7.7, which produce a correlation of log (CF) = 5.06 z and a correlation coefficient of 0.992, showing that the concentration factor scales exponentially to the charge state. This CF most likely results from the Boltzmann equilibrium at the pole. It is quite likely that at maximal concentration, most of the protons at the pole are mobile space charges. They form a positively charged layer at the pole and the neutralizing (protonated) peptides form another negatively charged layer outside, thus forming an induced double layer. As in classical equilibrium double layer theories, the maximal counterion and coion concentrations abide by an exponential Boltzmann dependence on the potential drop and charge state: exp (zΔV/kBT).
Figure 4.
The linear relation between the logarithmic values of the concentration factor of FITC tagged angiotensin I peptide and the absolute value of tagged peptide charge state (y = 1.074 e5.06x, R2 = 0.992).
Our previous study indicated that the electric field entering the granule was focused toward the pole.5 Hence, the entire voltage drop across the granule at the concentration region is roughly 100 μm, or approximately ΔV ∼ 100 mV. The slope of log (CF) versus z is therefore ΔV/kBT. When ΔV = 100 mV, we estimate the slope to be 7.7, which is close to the empirical slope of 5.06 from Fig. 4.
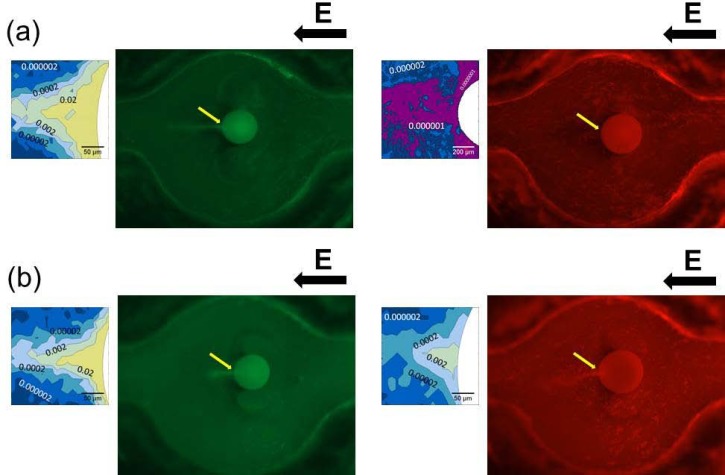
Because the concentration factor increases exponentially with respect to the solute charge state, the difference in the concentration factors between the two ampholytes should be sensitive to the pI values. A mixture of FITC-tagged angiotensin I (pI ∼ 5.8) and Texas red-tagged avidin (pI ∼ 10.5) was concentrated at pH 8.5 and pH 12, respectively, demonstrating the pI-selective trapping capability of this method. The images in Fig. 5a, taken of pH 8.5 solutions, were digitally filtered at 525 nm and 615 nm, which are the maximal emission wavelengths of FITC and Texas red, which were colored in green and red, respectively. The images in Fig. 5b of a pH of 12 were filtered at the same wavelengths. In a moderate alkaline condition of pH 8.5, below the pI value of avidin, the monochrome fluorescence image magnified from the solute trapping spot near the granule was used to construct a concentration level contour map, which is indicated next to the color image with a pointed arrow. Only the tagged angiotensin I was found to concentrate approximately 10 000 fold. The red image shows that tagged avidin was not trapped at this pH. By contrast, according to the concentration level contour maps next to the color images in Fig. 5b, in a strongly alkaline solution of pH 12, above the pI values of both trapped species, the angiotensin I and avidin were estimated to concentrate approximately 7000 and 1000 fold, respectively.
Figure 5.
(a) The concentrated mixture of FITC-tagged angiotensin I and Texas red-tagged avidin at pH 8.5; (b) images of the same mixture at pH 12. The images were digitally filtered at the emission maximal wavelengths of FITC and Texas red, which were 525 nm and 615 nm and were colored in green and red, respectively. The electric field direction is shown by the black arrow above each color image. The monochrome fluorescence images, magnified from the solute trapping spot near the granule, are used to construct concentration level contour maps, shown next to the color images with a pointed arrow. The granules are shaded in white on the contour maps.
CONCLUSION
After using FITC-tagged angiotensin I as one model for a peptide trapped at the pole of a nanoporous conducting cation-exchange granule in an AC electric field (0.1 Hz) at various pH conditions (pH 6 to pH 10), we observed that the concentration factor of coionic solutes dramatically increased at a near neutral pH from less than 100 to 20 000. A selective concentration of peptides of distinct charges was also demonstrated in neutral conditions without substantial protonation by using a mixture of FITC-tagged angiotensin I and Texas red-tagged avidin at various pH conditions. Abundant OH− ions eventually replace the negatively charged peptides at alkaline pH values above 10, reducing the concentration factor for peptide concentrations below nM; however, molecular absorption on the granule can produce a substantial concentration of peptide in extremely alkaline conditions.
ACKNOWLEDGEMENTS
This work was supported by the National Science Council of Taiwan (Grant Nos. 101-2627 -M-194-001 and 100-2113 -M-194-001-MY3).
APPENDIX A: CHARGE STATE ASSIGNMENTS OF FITC-ANGIOTENSIN I
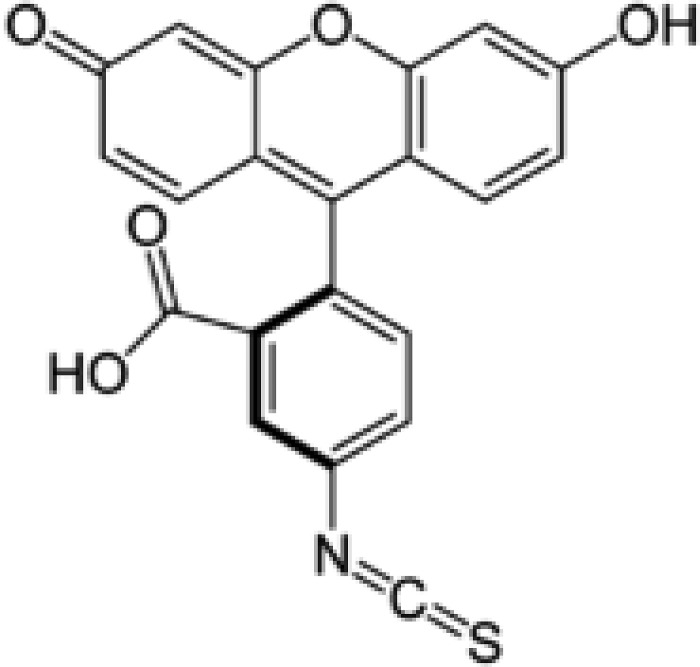
The sequence of angiotensin I is as follows: Asp-Arg-Val-Tyr-Ile-His-Pro-Phe-His–Leu. The side chain groups with acidic or basic moiety include aspartic acid (pKa 3.86), histidine (pKa 6.04), tyrosine (pKa 10.07), and arginine (pKa 12.48). Fig. 6 shows the chemical structure of fluorophore tag FITC, the pKa value of which is 6.4. The FITC is conjugated with angiotensin I via one linear acyl linker, the two ends of which are carboxylic acid and amine groups. The amine group end of this linker is conjugated with the isothiocyanate group of FITC, while the carboxylic group end is condensed with the amine group of amino acid Asp at the N-terminus of angiotensin I. Therefore, the Asp end loses its basicity and the angiotensin I peptide extends by conjugating with the FITC via the linker.
Figure 6.
The chemical structure of fluorescein isothiocyanate
By using the Henderson–Hasselbalch equation, we estimated the fractions of each charged species, either the anionic conjugate base or protonated conjugate acid, found on FITC-tagged angiotensin I at various pH conditions. The fraction of one charged species can be also used to designate its partial charge. Table TABLE I. lists the charge assignments of each amino acid unit in addition to acidic or basic side chain groups, the carboxylic acid on the C-terminus, and the conjugated FITC in the pH solutions that were used to estimate the concentration factors of FITC-tagged angiotensin I.
APPENDIX B: DUKHIN VORTEX IMAGES
Fig. 7 shows Dukhins vortices near the cation-exchange granules that were generated by a 70 V/cm external field and visualized using fluorescent microspheres.
References
- Kornhuber J., Tripal P., Reichel M., Muhle C., Rhein C., Muehlbacher M., Groemer T. W., and Gulbins E., Cell. Physiol. Biochem. 26, 9 (2010). 10.1159/000315101 [DOI] [PubMed] [Google Scholar]
- Adibhatla R. M. and Hatcher J. F., Future Lipidol. 2, 403 (2007). 10.2217/17460875.2.4.403 [DOI] [PMC free article] [PubMed] [Google Scholar]
- Wang Y.-C., Stevens A. L., and Han J. Y., Anal. Chem. 77, 4293 (2005). 10.1021/ac050321z [DOI] [PubMed] [Google Scholar]
- Cheng I.-F., Senapati S., Cheng X.-G., Basuray S., Chang H.-C., and Chang H.-C., Lab Chip 10, 828 (2010). 10.1039/b925854j [DOI] [PubMed] [Google Scholar]
- Wang S.-C., Wei H.-H., Chen H.-P., Tsai M.-H., Yu C.-C., and Chang H.-C., Biomicrofluidics 2, 014102 (2008). 10.1063/1.2904640 [DOI] [PMC free article] [PubMed] [Google Scholar]
- Liao K.-T. and Chou C.-F., J. Am. Chem. Soc. 134, 8742 (2012). 10.1021/ja3016523 [DOI] [PubMed] [Google Scholar]
- Leinweber F. C. and Tallarek U., J. Phys. Chem. B 109, 21481 (2005); 10.1021/jp055491u [DOI] [PubMed] [Google Scholar]; Tallarek U., Leinweber F. C., and Nischang I., Electrophoresis 26, 391 (2005). 10.1002/elps.v26:2 [DOI] [PubMed] [Google Scholar]
- Dukhin S. S., Adv. Colloid Interface Sci. 35, 173 (1991). 10.1016/0001-8686(91)80022-C [DOI] [PubMed] [Google Scholar]
- Tsukahara S., Sakamoto T., and Watarai H., Langmuir 16, 3866 (2000). 10.1021/la980441k [DOI] [Google Scholar]
- Basuray S. and Chang H.-C., Phys. Rev. E 75, 060501 (2007). 10.1103/PhysRevE.75.060501 [DOI] [PubMed] [Google Scholar]
- Brunet E. and Ajdari A., Phys. Rev. E 73, 056306 (2006). 10.1103/PhysRevE.73.056306 [DOI] [PubMed] [Google Scholar]
- Green N. G., Ramos A., Gonzalez A., Morgan H., and Castellanos A., Phys. Rev. E 66, 026305 (2002); 10.1103/PhysRevE.66.026305 [DOI] [PubMed] [Google Scholar]; Green N. G., Ramos A., Gonzalez A., Morgan H., and Castellanos A., Phys. Rev. E 61, 4011 (2000); 10.1103/PhysRevE.61.4011 [DOI] [PubMed] [Google Scholar]; Gonzalez A., Ramos A., Green N. G., Castellanos A., and Morgan H., Phys. Rev. E 61, 4019 (2000). 10.1103/PhysRevE.61.4019 [DOI] [PubMed] [Google Scholar]
- Bazant M. Z. and Squires T. M., Phys. Rev. Lett. 92, 066101 (2004). 10.1103/PhysRevLett.92.066101 [DOI] [PubMed] [Google Scholar]
- Ben Y. and Chang H.-C., J. Fluid Mech. 461, 229 (2002); 10.1017/S0022112002008662 [DOI] [Google Scholar]; Ben Y. X., Demekhin E. A., and Chang H.-C., J. Colloid Interface Sci. 276, 483 (2004). 10.1016/j.jcis.2004.04.004 [DOI] [PubMed] [Google Scholar]
- Dhopeshwarkar R., Crooks R. M., Hlushkou D., and Tallarek U., Anal. Chem. 80, 1039 (2008); 10.1021/ac7019927 [DOI] [PubMed] [Google Scholar]; Hlushkou D., Dhopeshwarkar R., Crooks R. M., and Tallarek U., Lab Chip 8, 1153 (2008). 10.1039/b800549d [DOI] [PubMed] [Google Scholar]
- Stein D., Kruithof M., and Dekker C., Phys. Rev. Lett. 93, 035901 (2004). 10.1103/PhysRevLett.93.035901 [DOI] [PubMed] [Google Scholar]
- Chang H.-C. and Yossifon G., Biomicrofluidics 3, 012001 (2009). 10.1063/1.3056045 [DOI] [PMC free article] [PubMed] [Google Scholar]
- Chang H.-C., Yossifon G., and Demekhin E. A., Annu. Rev. Fluid Mech. 44, 401 (2012). 10.1146/annurev-fluid-120710-101046 [DOI] [Google Scholar]
- See supplementary material at http://dx.doi.org/10.1063/1.4817492 for this film.
- Slouka Z., Senapati S., Yan Y., and Chang H.-C., Langmuir 29, 8275 (2013). 10.1021/la4007179 [DOI] [PubMed] [Google Scholar]


