Abstract
A multiphysics computational model of the focusing of an acoustic pulse and subsequent shock wave formation that occurs during extracorporeal shock wave lithotripsy is presented. In the electromagnetic lithotripter modeled in this work the focusing is achieved via a polystyrene acoustic lens. The transition of the acoustic pulse through the solid lens is modeled by the linear elasticity equations and the subsequent shock wave formation in water is modeled by the Euler equations with a Tait equation of state. Both sets of equations are solved simultaneously in subsets of a single computational domain within the BEARCLAW framework which uses a finite-volume Riemann solver approach. This model is first validated against experimental measurements with a standard (or original) lens design. The model is then used to successfully predict the effects of a lens modification in the form of an annular ring cut. A second model which includes a kidney stone simulant in the domain is also presented. Within the stone the linear elasticity equations incorporate a simple damage model.
INTRODUCTION
Extracorporeal shock wave lithotripsy (ESWL) is a noninvasive medical procedure that uses focused acoustic waves to break up kidney stones into small enough pieces for a patient to pass naturally. In an ESWL procedure a strong acoustic pulse is generated outside of the patient in a water-filled casing and is then focused toward the kidney stone by one of several standard methods. The pulse either begins as a shock wave or forms into one during transit due to nonlinear steepening, depending on the type of lithotripter. The stone is fractured and subsequently comminuted by a variety of mechanisms including compression-induced tensile fracture, spallation, squeezing, and cavitation effects.1
The three common types of lithotripters are based on electrohydraulic (EH), electromagnetic (EM), and piezoelectric (PE) principles and the use of various devices for pulse generation and focusing. In an EM lithotripter, an acoustic pulse is formed by an electromagnetic actuator and is usually focused by an acoustic lens or parabolic reflector. In contrast, an EH lithotripter uses a spark discharge between electrodes and an ellipsoid reflector and a PE lithotripter uses piezoelectric actuators arranged on a spherical cap.
Since the 1980 development of the procedure2 and the 1984 clinical introduction of the Dornier, Wessling, Germany, HM3 EH lithotripter,3 ESWL has become the preferred treatment of choice for most stones with size less than 2.5 cm.4 Despite much success, EH lithotripters suffer from the short lifespan of the electrodes as well as high variability in shock features such as rise time and peak pressures.5 This led to the popularity of EM lithotripters which greatly improved on these issues.1 In fact, most lithotripters developed during the 1990s were EM lithotripters.4 PE lithotripters also addressed these problems, but poorer clinical showings have kept them from gaining popularity.4
Unfortunately, modern EM lithotripters do not achieve the stone-free success rates of the HM3 and have lead to a higher re-treatment rate.5, 6 Some reasons for the successful efficacy of the HM3 likely include the wider beam width and cavitation resulting from the long tensile portion of the pulse. These features can potentially be addressed in refracting EM lithotripters through introduction of new lens designs. Qin7 proposed a design with an annular ring cut which increases the beam width and reduces the secondary compression of the pulse profile resulting in pressure waveforms, and therefore cavitation behavior, closer to that of the HM3. Zhong and colleagues8 have reported a prototype design of this new lens that demonstrates improved stone comminution both in vitro and in vivo compared to the original lens. One benefit of designing new lenses as a means to increase EM lithotripter efficacy is the ease of replacing existing lenses while leaving the remainder of the lithotripter intact. In this paper, a computational model of an EM lithotripter is presented to aid in the design of improved lenses.
Despite the prevalence of EM lithotripters, almost all existing numerical models of acoustic wave propagation in lithotripsy have either been of EH or PE lithotripters and none model refracting EM lithotripters. Coleman et al.9 solved the one-dimensional Khokhlov–Zabolotskaya–Kuznetsov (KZK) equation, similar to Burgers' equation, with the HM3 geometry. Hamilton10 developed a linear focusing solution on the axis of symmetry of a concave ellipsoidal mirror following the production of a spherical wave at the first focus. This model was later used by Sankin et al.11 to investigate optical breakdown as a shock wave generation mechanism. Christopher12, 13 developed a nonlinear acoustic model accounting for diffraction and attenuation and applied it to the HM3. This model also solved Burgers' equation to account for nonlinear effects. Steiger14 presented a finite difference model of a reflecting EM lithotripter and accounted for attenuation in tissue. Averkiou and Cleveland15 solved the two-dimensional (2D) KZK equation to model an EH lithotripter. Zhou and Zhong16 expanded on this model to investigate reflector geometry modifications. Ginter et al.17 modeled a reflecting EM lithotripter by solving nonlinear acoustic equations by a 2D FDTD method. Tanguay18 used a weighted essentially non-oscillatory method to solve the Euler equations for two phase flow in order to investigate the bubble cloud that forms due to the shock wave. Krimmel, Colonius, and Tanguay19 expanded on this model to investigate the effect of bubbles on the focusing and shock wave formation in both EH and PE lithotripters. Iloreta et al.20 investigated possible inserts into an EH lithotripter and the effect on cavitation potential by solving the Euler equations using CLAWPACK.21
The majority of the works in the preceding paragraph involve computational solutions of wave propagation and nonlinear steepening in water. These solutions allow modeling of EH, PE, and reflecting EM lithotripters where the focusing and steepening occur in water. To model a refracting EM lithotripter, the wave propagation within the solid lens must also be computed. This requires the computation to have a multiphysics aspect. In this work, a multiphysics computational model is developed and validated against pressure measurements from an EM lithotripter. The experimental setup that is modeled is aimed at testing different lens designs and does not include tissue or kidney stone material or simulant. The region normally occupied by the patient is approximated in the experiment by additional water. Further details of the experimental procedure used to collect data for comparison are described in Sec. 2. Following this, the numerical model will be described. This model is first validated by comparing to experiment for a standard lens design. Then, it is shown that the model correctly predicts parameters of the pulse, including peak pressures, beam width, acoustic energy, and pulse durations, for a modified lens. Finally, the model is extended to include a cylindrical kidney stone simulant in the domain.
EXPERIMENTAL METHODS
The processes in an experimental EM lithotripter can be segmented into stages. First is the creation of the acoustic pulse by the electromagnetic actuator (i.e., the shock wave source). After traveling through a small portion of water the acoustic pulse enters the lens and refracts. Upon exiting the lens, the pulse is directed toward the geometrical focus of the lens. Up to this point all wave propagation has been approximately linear. As the pulse proceeds through the water and converges toward the focus, the amplitude increases. Eventually, the pressures are high enough to cause significant nonlinear steepening of the pulse and finally, shock wave formation.
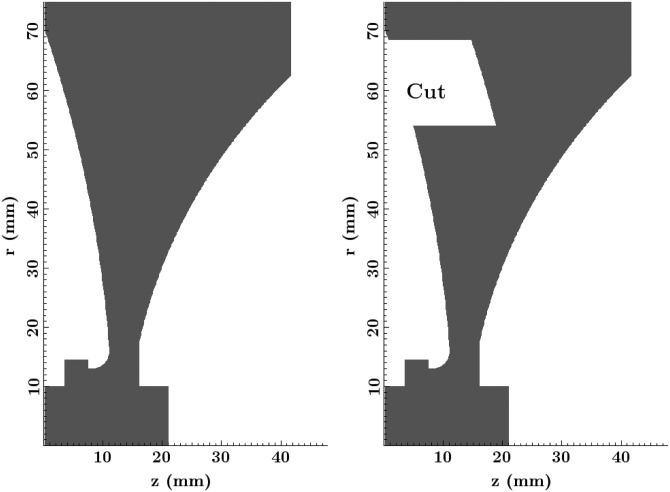
The essential components of the experiment are a tank of water, an electromagnetic actuator, an acoustic lens, and a hydrophone. These components can be seen in the diagram in Fig. 1. Cross section diagrams of the original lens used for validation of the model and the new lens used to show the predictive capabilities of the model are shown in Fig. 2. The acoustic lens fits directly on top of the actuator with a small fraction of water in between. The lenses are made from polystyrene and its material properties are given in Sec. 3. Dimensions in the experiment and computation are given in cylindrical coordinates , where is the center axis of the actuator and lens and is the surface of the actuator. The actuator extends from to mm, the lens extends to mm, and the geometrical focus of the lens is at mm.
Figure 1.
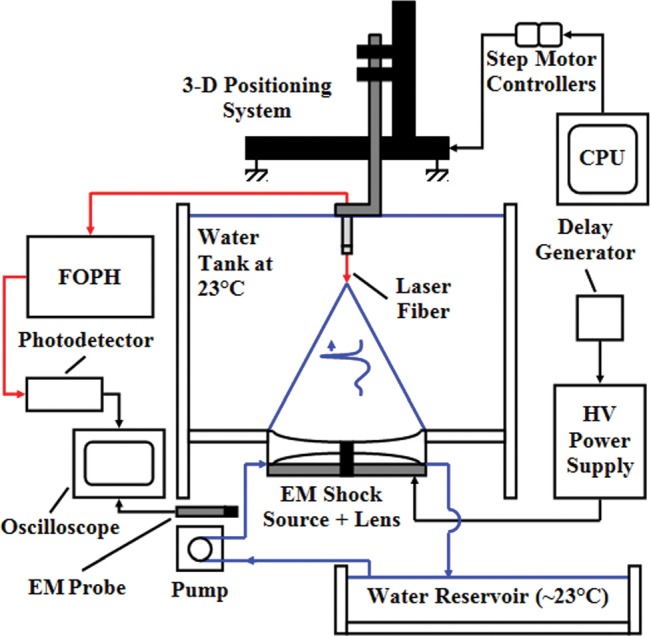
(Color online) Diagram of the experimental setup with the tank, actuator, and lens in the center. Arrows show the FOPH setup and the flow of water to the space behind the lens. Also shown is the 3D positioning system used to position the FOPH for pressure measurement.
Figure 2.
Cross section diagrams of the two lenses used. On the left is the original lens used for validation of the model. On the right is the new lens with the cut, a feature of clinical interest, which exhibits a longer axial extent of the focal region. corresponds to the central axis of the lenses.
The 40 × 30 × 30 cm Lucite, Southampton, United Kingdom, tank is filled with 0.2 micrometer-filtered and degassed water ( mg/L oxygen concentration, ). The electromagnetic actuator is powered by a high voltage pulse generator with a 1.2 microfarad capacitor and a dynamic range of 9.5–19.3 kV. Pressure measurements are recorded by a fiber optic hydrophone (FOPH) 500 from RP Acoustics, Leutenbach, Germany. Pressure is sampled at 100 MHz from the photovoltage signal by a LeCroy, Chestnut Ridge, New York, oscilloscope.
A similar experimental setup is used to measure the pulse input for the computational model. This input consists of pressure data as a function of the radial coordinate , time , and the source voltage . This data corresponds to the direct wave created by the actuator. In this experiment the lens is removed and the optical fiber of the hydrophone is placed close to the actuator at mm.
To create the input pressure data, three source voltages (12.8, 15.8, and 18.8 kV) were used. The radial profile of the pulse was characterized by FOPH pressure measurements at mm steps over the interval mm. Near the edges of the actuator where the profile changes more rapidly, mm and mm, a smaller step size of mm was used. Elsewhere, mm and mm, the incoming pressure is assumed to be zero. This data was curve fitted as functions of r, t, and V in order to interpolate and extrapolate input pressure data over these variables (Sec. 4).
Post-processing of data
The hydrophone measurements are averaged over four samples, which reduces noise to an acceptable level for comparison to the model. Measurements are post-processed using matlab. The lithotripter field parameters are calculated following the International Electrotechnical Commission standard 61846. The compressive and tensile pulse durations, and , respectively, are calculated based on the first and last point where 10% of the peak pressure of that portion of the wave is encountered. The rise time, , is calculated as the time for the leading compressive wave to increase from 10% to 90% of the peak pressure. Beam width is calculated as the diameter of the circle in the focal plane, perpendicular to the propagation axis, defined by where the pressure is 50% of the peak pressure of the leading compressive wave.
The effective acoustic pulse energies are defined as
| (1) |
where is the radius of the region over which the energy is calculated. In this work, mm which encompasses most stones treated with ESWL. is the pulse intensity integral given by
| (2) |
where is pressure, is the acoustic impedance of water, and and are the first and final crossing points, respectively, of 10% of the peak pressure of the region in question. Here, acoustic energies are calculated only in the geometric focal plane of the lens so that mm. Numerical data is produced in the same format [pressure over time at certain coordinates] and therefore the same post-processing of parameters is used.
NUMERICAL MODEL
The computational model described in this section simulates the focusing of an acoustic pulse by a lens and the subsequent shock wave formation as would occur in a refracting EM lithotripter. The model can also include a stone region in order to simulate the interaction of the shock wave and stone. The developing shock wave in the solution requires the use of numerical methods capable of handling this discontinuity. Here, a finite-volume conservative-law Riemann solver21, 22 is used within the BEARCLAW framework developed by Mitran.23 The user of BEARCLAW supplies the system matrix decomposition and the appropriate waves and speeds in the Riemann solver sense. The user also specifies other details of the computation such as initial conditions, boundary conditions, source term solutions, and spatially dependent coefficients of the equations.
The model presented here solves the linear elasticity equations and the Euler equations simultaneously in arbitrary subsets of the full computational domain. Figure 3 shows the extent of the domain, and the location and orientation of the lens and stone as well as the regions in which either the elasticity equations or the Euler equations are solved. Essentially, both sets of equations are solved across the entire domain. Where solution values of one set of equations are not needed, they are discarded and replaced with transformed versions of the other solution values. For example, Euler values within the lens are not needed and so only the elasticity values are kept in that region. A small portion of elastic water is needed as a transition area between the elastic solids and the Euler water. This is because the transformation of solution values between elasticity and Euler is only valid for water, where there is no shear stress.
Figure 3.

(Color online) Diagram of the computational domain. The z-axis is the axis of symmetry. The incoming pulse enters along the left boundary. The geometric focus of the acoustic lens is near the proximal surface of the stone at z = 181.8 mm. The thickness of the elasticity water regions are exaggerated.
For ease of application programming, the linear elasticity equations are first solved across the entire domain to model the transition of the pulse through the lens and relatively small portions of water surrounding the lens. At a later time, , the computation is switched and the Euler equations are solved once the pulse has passed completely through the lens in order to model the shock wave formation. For the results given in this paper, . This value allows just enough time for the pulse to pass completely through the lens and into the water. At later times, the computational model tracks penetration of the shock wave into a kidney stone simulant where the heterogeneous elasticity equations are solved with a simple damage model.
In the computation, the electromagnetic actuator is not modeled explicitly. Instead the pulse enters the domain through an elasticity boundary condition at , representing the surface of the actuator near the proximal surface of the lens, as seen in Fig. 3. The stability condition for the solver is the Courant–Friedrichs–Lewy condition, , where is the time step and is the spatial step. A variable timestepping technique is used here with a desired CFL of 0.98. The time step is chosen based on the desired CFL and maximum wave speed () encountered on the previous time step. The lenses currently being modeled are axisymmetric and so the axisymmetric versions of the elasticity and Euler equations are used.
Linear elasticity equations
The axisymmetric linear elasticity equations in cylindrical coordinates are
| (3) |
where , , , and are elements of the stress tensor, u and v are displacement velocities in the z and r directions, respectively, ρ is density, and λ and μ are the first and second Lamé parameters, respectively (μ is also called the shear modulus).22, 24, 25 The Lamé parameters are related to Poisson's ratio, ν, and Young's modulus, E, by
| (4) |
and to the longitudinal wave speed, , and the shear wave speed, , by
| (5) |
The hyperbolic system of equations 3 models longitudinal waves and shear waves with motion in the plane. The main elements of the employed Riemann solver will briefly be discussed. Consider Eq. 3 written in vector form as
| (6) |
where
| (7) |
An analytic eigendecomposition of the system matrices, A and B, before the computation, reveals the waves and wave speeds of the system, which are the eigenvectors and eigenvalues, respectively. The wave speeds in this system are , , , and . The form of the coefficients of this decomposition, when applied to the solution differences between adjacent cells, is also computed beforehand. Along with the eigensystem values, these coefficients are used to form the flux terms at the cell boundaries, and , in the update formula given by
| (8) |
where are the solutions values at the time step and in finite volume cell , is the time step, and and are the spatial steps. and are the correction terms which incorporate the higher order wave limiters and the transverse waves. The basic iteration used here is described by LeVeque.21, 22
In this simulation, the lens, stone, and regions of water surrounding the lens and stone are modeled with the elasticity equations. The elasticity equations will not capture the nonlinear steepening effect that occurs in water. Over the small regions of water where the elasticity equations are used, this effect is negligible due to the short distance traveled and the low amplitude of the wave.
The variable coefficient elasticity equations must be used to differentiate between the water, lens, and stone areas. The material parameters become
| (9) |
If a finite volume cell is completely within the lens, the cell receives lens material parameters; if it is completely within the water, it receives water material parameters. If the cell covers both lens and water, then averaging of the material properties is used. The density is found by arithmetic averaging and the Lamé parameters are found by harmonic averaging.26 The wave speeds are then computed from these averaged values. The formulas are
| (10) |
where the subscripts A, L, and W refer to averaged, lens, and water values, respectively, and and are the lens and water fractions. Near the stone, cells are simply defined by which material the cell center falls within.
The material property values used for these simulations are given in Table TABLE I.. The stone material properties are based on Ultracal-30 gypsum.27 The water values are set so that the water regions will not support shear waves. Without shear waves, the elasticity equations revert to the wave equation. A strictly zero value for the shear modulus in water creates instabilities at the lens-water boundary and so a small non-zero value is chosen. The exact value is not crucial because a very small wave speed will cause the waves to dissipate quickly due to numerical viscosity and the effect will be negligible. That being said, a value of the shear modulus consistent with what is found in the literature is used.28
TABLE I.
Material properties used in the linear elasticity equations for water, lens (polystyrene), and kidney stone simulant (Ultracal-30).
| Material | ρ (kg/ ) | λ (Pa) | μ (Pa) | (m/s) | (m/s) |
|---|---|---|---|---|---|
| Water | 1000 | 1489 | |||
| Lens | 1060 | 2337 | 1157 | ||
| Stone | 1700 | 2840 | 1430 |
Within the stone, a damage model is included which influences the material parameters.29 At every time step, the maximum principal stress, , is calculated in every cell in the stone and surrounding water. The maximum principal stress is the largest eigenvalue found from an eigendecomposition of the stress tensor in each cell. The simple isotropic damage growth model used here is
| (11) |
where D is the damage variable, is a critical stress value, and α is a scalar multiplier. The damage can range from an undamaged state to some critical value, i.e., . The damage only increases if , otherwise . The inclusion of damage here is preliminary and is meant to show capabilities of the model. For that reason, little emphasis is placed on selecting the damage parameters in this work. For these computations, , MPa, and are chosen. The damage variable affects the wave propagation through the Lamé parameters. The two parameters become functions of time as the damage changes
| (12) |
The initial pulse enters entirely into the elasticity domain. The exact shape of this pulse will be discussed in Sec. 4. The pulse is modeled by setting the values of the ghost cells along the boundary. The input is generally formatted as pressure values for certain radial positions and times. These values are interpolated in space and time to match the current time of the simulation and the radial positions of the cell centers. Let be the interpolated pressure value for the time step and finite volume cell along the boundary. Assuming isotropy, the solution values in the ghost cell region are set by
| (13) |
The pressure values are doubled because the initial pulse will split into left-going and right-going halves and only the right-going half will enter the domain.
Euler equations
The Euler equations describe sound wave propagation and fluid flow in compressible inviscid fluids and are used here to model the transition of the focused acoustic pulse through water which includes a nonlinear steepening effect. The equations are derived from the conservation of mass, momentum, and energy. The axisymmetric equations are found from the cylindrical equations by removing θ derivatives and assuming no flow in the θ direction. The equations are
| (14) |
Closing the equations requires an equation of state (EOS) relating pressure to the solution variables. A commonly used EOS for compressible water is the modified Tait EOS, also called the stiffened EOS.30 This is the EOS used by Krimmel et al.19 and Iloreta et al.20 when solving the Euler equations to model shock wave lithotripsy. Here, the following forms of the EOS are used:
| (15) |
and
| (16) |
where γ and B are the two parameters of the EOS. This EOS is a simple translation by B of the ideal gas law and γ takes the place of the adiabatic index. This means a standard Riemann solver for the Euler equations with the ideal gas law can be used here as long as the variables are initialized with the modified Tait EOS. Typical values of the parameters for water are and MPa. In this simulation, so that the speed of sound, given by
| (17) |
will be approximately equal to 1489 m/s with the atmospheric conditions, MPa and kg/.
Like the elasticity equations, the Euler equations can be written in vector form as
| (18) |
where the system matrices are now functions of the solution variables. A linearized Riemann solver is used here which employs the Jacobian to transform Eq. 18 into
| (19) |
The solution values within the Jacobian matrices are approximated by Roe averages and the standard entropy fix is used.
Multiphysics
To connect the elasticity and Euler regions, the stresses and displacement velocities of the elasticity equations must be transformed to the mass, momentum, and energy of the Euler equations and vice versa. In the following equations, the E subscript denotes elasticity values and the F subscript denotes fluid or Euler values. To convert from elasticity to Euler, the pressure is first calculated from the average of the normal stresses. The negative is taken because of the opposite conventions in elasticity and fluids. The equations for determining the density and energy are the modified Tait EOS. The momentum values simply come from the density and velocities. The transformation is
| (20) |
where and refer to the initial water density and initial pressure, respectively. To convert from Euler to elasticity the displacement velocities are first calculated and then the EOS is used to determine the pressure. The normal stresses are set to the negative of the pressure and the shear stress is set to zero. The transformation is
| (21) |
These transformations are only valid for the solution values within water, i.e., cells with no appreciable shear stress. Therefore a small boundary region of water modeled with elasticity between the elastic solids and the fluid is needed. This ensures that cells in the Euler region are only influenced by elasticity cells with a physically correct transformation. The cells adjacent to any Euler cell must either be Euler or elastic water so that the Riemann solves which influence the Euler cell contain the correct values.
The CFL is based on the highest wave speed, so parts of the solution moving at lower wave speeds essentially run at a lower CFL and see more numerical viscosity as a result. To avoid a low CFL while the shock is developing, the lens is switched to have water wave speeds once the pulse has completely passed through. Similarly, the stone region is not given stone wave speeds until the shock has almost reached it.
Other details
Dynamic adaptive mesh refinement (AMR) is used in this simulation in a physically inspired fashion. A single area of refinement is manually controlled to move along with the pulse, left to right, across the domain. The root level grid has a grid spacing of 1.5 mm. The refinement ratio is 48 leading to a grid spacing of 31.25 on the fine grid. Any results that include a stone were run with a refinement ratio of 32. The lower refinement ratio was chosen to reduce computational time. As these results are not compared to experiment but are meant to showcase capabilities of the method, the full resolution is not used.
As stated earlier, the time step is chosen based on a desired CFL and the maximum wave speed encountered on the previous time step. With a refinement ratio of 48, this leads to a timestep of about 13.1 ns during the elasticity portion. Early in the Euler portion the timestep is about 20.7 ns, but as the pulse focuses and the shock develops the time step decreases to account for the increase in wave speed.
The initial conditions are hydrostatic atmospheric conditions. In the elasticity regions the normal stresses are set to MPa and the remaining variables, the shear stress, and displacement velocities, are set to zero. In the Euler regions, the variables are set using kg/ and MPa with zero initial momentum. The boundary sets the incoming pulse. Once the pulse has finished, that boundary is set to a solid wall boundary condition where the ghost values equal the corresponding interior values except for the velocity normal to the boundary which is negated. The same condition is used along the boundary to enforce the axisymmetry. The remaining two boundaries at mm and mm are set to zero-order extrapolation outflow conditions to simulate that the tank in the experiment is larger than the computational domain.
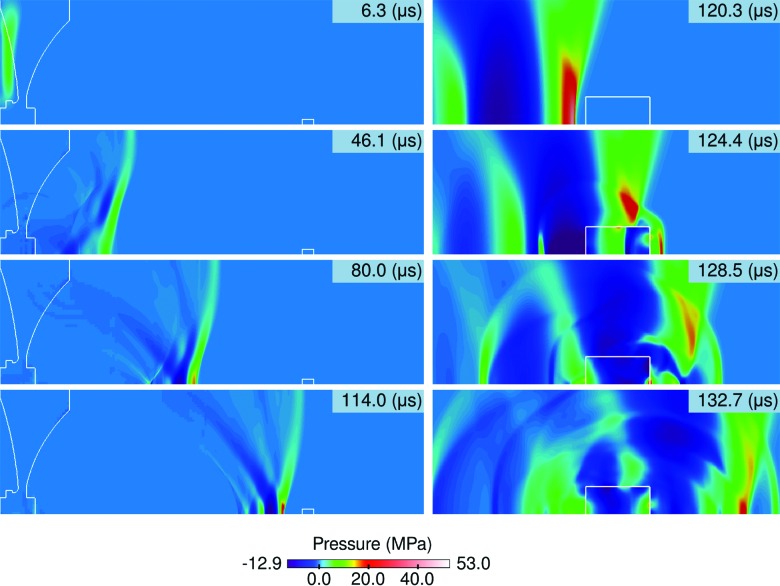
The source terms for both sets of equations are updated with Strang splitting using the exact solutions of the ordinary differential equations after removing spatial derivatives from the partial differential equations. The method is second order and uses the monotized central-difference wave limiter. The simulations are run in serial with a 3.3 GHz Intel (Santa Clara, California) Xeon X5680 CPU and take about 70 h to complete. Figure 4 shows results at select times during an example simulation with the original lens and a stone simulant.
Figure 4.
Progression of the computational solution at selected times. On the left, the focusing and shock wave formation over the entire computational domain is shown. On the right, the interaction of the shock wave in the fluid region and elastic stone is shown. The original lens and 15.8 kV input is used here. Within the elastic regions, the average of the normal stresses is displayed as pressure.
RESULTS
The first result presented is the characterization of the direct pulse produced by the electromagnetic actuator, as mentioned in Sec. 2. This is used to create the input for the computational model. The peak pressure of the plane wave created by the actuator,
| (22) |
is approximately proportional to the square of the source voltage .31 The radial profile of the pulse is fit by
| (23) |
where mm, mm, and mm. Finally, the function
| (24) |
is used to define the pressure over the time interval , where , rad/s, and . Example plots of the pressure over time and radial distance are shown in Fig. 5.
Figure 5.
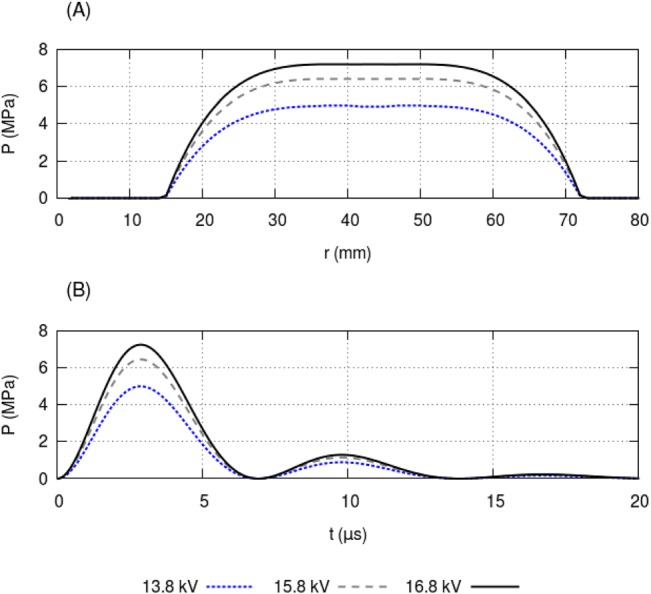
(Color online) Example plots of the incoming pulse for the three voltage levels predominantly used here. (a) Pressure distribution in the radial direction at . (b) Pressure over time at mm.
Validation using original lens
Comparisons of pressure profiles, peak pressures, and calculated lithotripter parameters are presented in order to validate the computational model against experiment. In this section and Sec. 4B, the plots showing pressure profiles have had the numerical data shifted slightly left or right to align the shock front for aiding visualization. These shifts in time vary from plot to plot and are less than 0.3 . No significant change in the shape of the pulse would occur from correcting for this by using small changes in the wave speed parameters, so a simple translation is used.
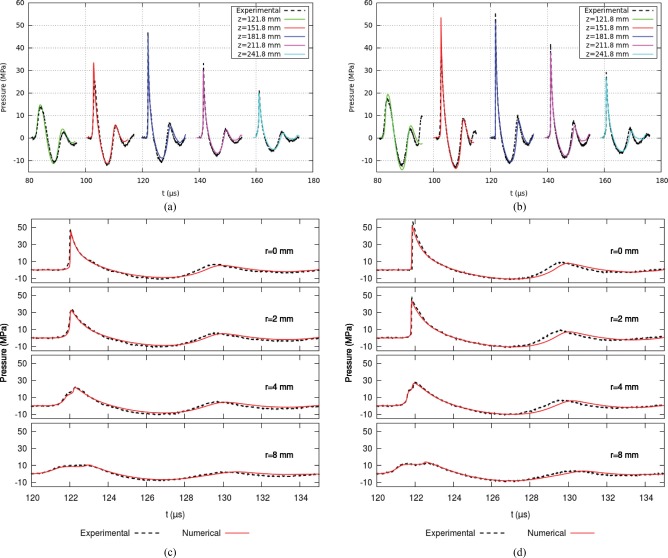
Figure 6 shows good agreement between experimental and numerical pressure profiles including easily discernible parameters such as peak pressures, and , and pulse durations, and . Figures 6a, 6b show pressure profiles along the propagation axis ( mm), at 121.8, 151.8, 181.8 (focus), 211.8, and 241.8 mm, with 13.8 kV and 15.8 kV input, respectively. Figures 6c, 6d show pressure profiles in the focal plane ( mm), at 0, 2, 4, 8 mm, with 13.8 kV and 15.8 kV input, respectively. In these latter images it is apparent that the duration of the tensile portion of the pulse () is less in experiment than in the model. This may be due to the effect of tensile wave shortening from the cavitation that is produced by the tensile portion.32, 33, 34, 35 Since the computation does not include cavitation, this effect is not modeled and the numerical result contains the full non-attenuated tensile portion.
Figure 6.
(Color online) Plots of experimental and numerical pressure profiles along the propagation axis, , and in the focal plane, mm for the original lens. (a) Propagation axis with 13.8 kV input. (b) Propagation axis with 15.8 kV input. (c) Focal plane with 13.8 kV input. (d) Focal plane with 15.8 kV input.
Figure 7 shows that the distribution of peak pressures in the focal plane for 13.8 and 15.8 kV input is well captured by the model except for an approximate 10% difference in near the focus. These plots can also provide a visual estimate of the beam width. Figure 8 shows the peak positive and negative pressures and the beam width in the focal plane over the dynamic range of the lithotripter. This plot also shows fitted polynomial curves of the data. Peak negative pressures are very well matched with numerical values consistently only slightly lower (in absolute value) than experimental values. Although less data is available, beam width values match very well. Peak positive pressure matches well for the mid range input voltages which are typical of the source voltages used in the medical procedure.36 Experimental is up to 30% lower than numerical for lower voltage input pulses ( kV) which may be due to extrapolation error in the numerical input. For the strongest input pulses, the experimental is up to 13% higher than the numerical . This may be improved by further refinement of the finite volume grid. Though in order to retain moderate runtimes for the most relevant input voltages, finer grids were not used.
Figure 7.
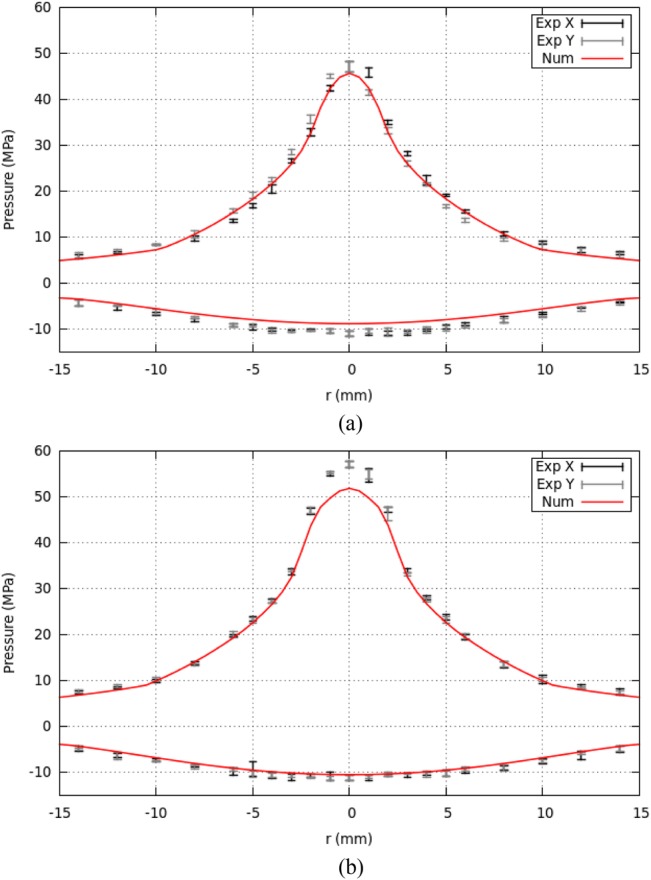
(Color online) Plots of peak positive and peak negative pressure in the focal plane ( mm) for the original lens. Experimental data is recorded in four directions from the z-axis . Numerical data is mirrored across to aid in visualization. (a) 13.8 kV. (b) 15.8 kV.
Figure 8.
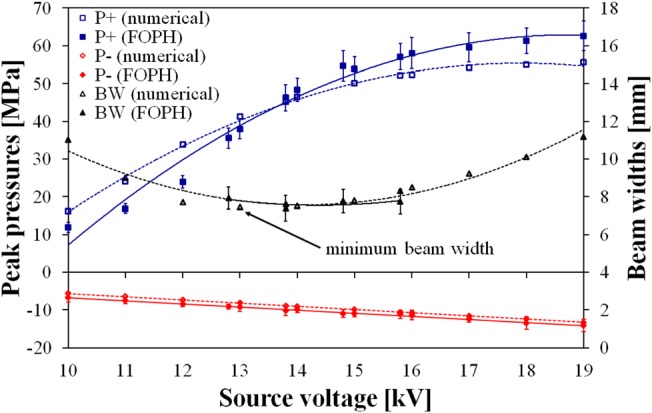
(Color online) Comparison of peak positive pressure , peak negative pressure , and beam width for the original lens over the dynamic range of the lithotripter. Polynomial fits are also shown (dotted lines for numerical and solid lines for experiment).
Table TABLE II. presents lithotripter parameters calculated from the experimental and numerical pressure profiles at the focus and in the focal plane. The pulse parameters, , , , and , match very well for both input voltages. Percent error for these parameters ranges from 2.4% to 12.7%. The larger discrepancy in the rise time may be attributed to the chosen coarseness of the grid since this involves a measurement of the shock. Beam width error ranges from 2.7% to 10.7% over the input values and acoustic energy error ranges from 4.3% to 34.9%. The FOPH pressure measurements are estimated to have at least 5% error.35 Since FOPH measurements were used to create the input, the numerical model is considered to carry the same degree of uncertainty.
TABLE II.
Comparison of lithotripter parameters calculated from experimental and numerical pressure profiles at the focus for the original lens design. Energy subscripts , , and refer to the first compressive, first tensile, and second compressive wave, respectively. mm was used for all pulse energy calculations.
| Source voltage (kV) | (MPa) | (MPa) | () | () | (ns) | |
|---|---|---|---|---|---|---|
| Experimental | 13.8 | 46.3 | −10.2 | 1.62 | 3.49 | 145.0 |
| 15.8 | 56.4 | −11.0 | 1.59 | 3.31 | 16.2 | |
| Numerical | 13.8 | 45.2 | −8.9 | 1.57 | 3.40 | 50.2 |
| 15.8 | 52.2 | −10.6 | 1.63 | 3.69 | 37.3 |
| Source voltage (kV) | Beam width (mm) | (mJ) | (mJ) | (mJ) | (mJ) | |
|---|---|---|---|---|---|---|
| Experimental | 13.8 | 7.4 | 33.2 | 17.2 | 1.5 | 53.2 |
| 15.8 | 7.5 | 51.7 | 18.3 | 4.3 | 74.7 | |
| Numerical | 13.8 | 7.6 | 30.1 | 13.5 | 1.6 | 45.3 |
| 15.8 | 8.3 | 48.0 | 20.3 | 2.8 | 71.5 |
Prediction of new lens parameters
In this section the model is shown to accurately predict pressure profiles near the focus with the new lens design. This model was developed and its parameters were established using the original lens geometry. For modeling the shock wave focusing produced by the new lens, the only model parameters that are changed govern the geometry of the lens. All other aspects of the model remain the same. The new lens geometry is tested using 15.8 and 16.8 kV input, as opposed to the lower amplitude input used for the original lens. The interference from the delayed wave caused by the lens cut leads to reduced acoustic pressures at the focus. In order to compare pulses with similar effective acoustic energies, higher amplitude inputs are used.
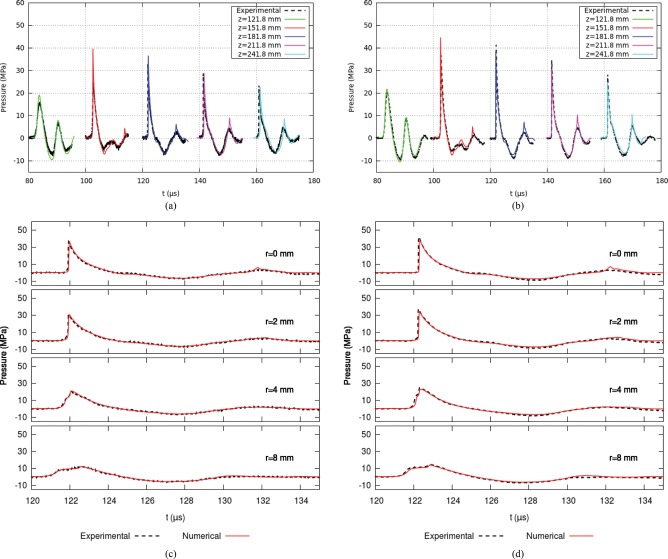
This section will present data in the same manner as in the original lens section. Figure 9 shows pressure profiles along the propagation axis and in the focal plane for 15.8 and 16.8 kV input. As with the original lens there is good agreement between the overall shapes of the profiles. The model accurately captures the weakening and elongation of the tensile portion caused by the lens cut. Also noticeable in the radial plots, Figs. 9c, 9d, is the agreement of the suppressed secondary compressive wave. Except for a small spike in the numerical solution better overall agreement is seen compared to the same plots for the original lens. The numerical spike does not substantially contribute to the effective acoustic energy as seen in Table TABLE III. and appears exaggerated in the propagation axis plots, Figs. 9a, 9b.
Figure 9.
(Color online) Plots of experimental and numerical pressure profiles along the propagation axis, , and in the focal plane, mm for the new lens. (a) Propagation axis with 15.8 kV input. (b) Propagation axis with 16.8 kV input. (c) Focal plane with 15.8 kV input. (d) Focal plane with 16.8 kV input.
TABLE III.
Comparison of lithotripter parameters calculated from experimental and numerical pressure profiles at the focus for the new lens design. Energy subscripts , , and refer to the first compressive, first tensile, and second compressive wave, respectively. mm was used for all pulse energy calculations.
| Source voltage (kV) | (MPa) | (MPa) | () | () | (ns) | |
|---|---|---|---|---|---|---|
| Experimental | 15.8 | 38.2 | −8.3 | 1.82 | 3.11 | 51.8 |
| 16.8 | 42.2 | −9.0 | 1.80 | 3.13 | 18.6 | |
| Numerical | 15.8 | 36.7 | −6.6 | 1.80 | 3.07 | 44.7 |
| 16.8 | 38.7 | −7.3 | 1.89 | 3.24 | 40.9 |
| Source voltage (kV) | Beam width (mm) | (mJ) | (mJ) | (mJ) | (mJ) | |
|---|---|---|---|---|---|---|
| Experimental | 15.8 | 10.4 | 29.9 | 9.8 | 0.0 | 39.9 |
| 16.8 | 10.8 | 38.7 | 12.1 | 0.0 | 51.3 | |
| Numerical | 15.8 | 10.0 | 27.5 | 7.7 | 0.1 | 35.6 |
| 16.8 | 10.7 | 34.0 | 9.4 | 0.1 | 43.9 |
Figure 10 shows the peak positive and peak negative pressures in the focal plane, again for 15.8 and 16.8 kV input. These plots show that the model correctly predicts the increase in beam width caused by the lens cut. Figure 11 shows numerical peak positive pressure, peak negative pressure, and beam width over the dynamic range of the lithotripter. The numerical parameter results appear to match the available experimental data.
Figure 10.
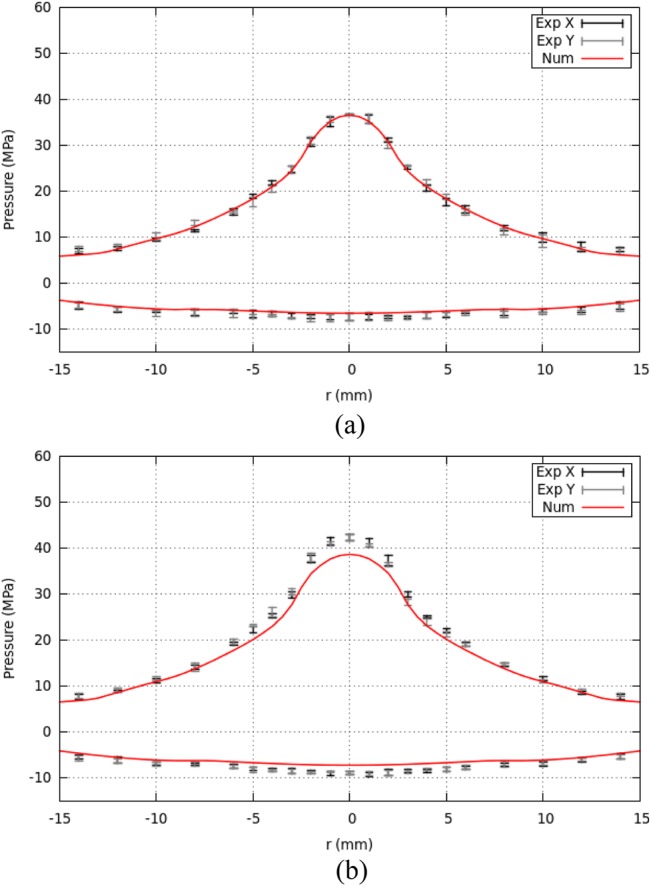
(Color online) Plots of peak positive and peak negative pressure in the focal plane ( mm) for the new lens. Experimental data is recorded in four directions from the z-axis . Numerical data is mirrored across to aid in visualization. (a) 15.8 kV. (b) 16.8 kV.
Figure 11.
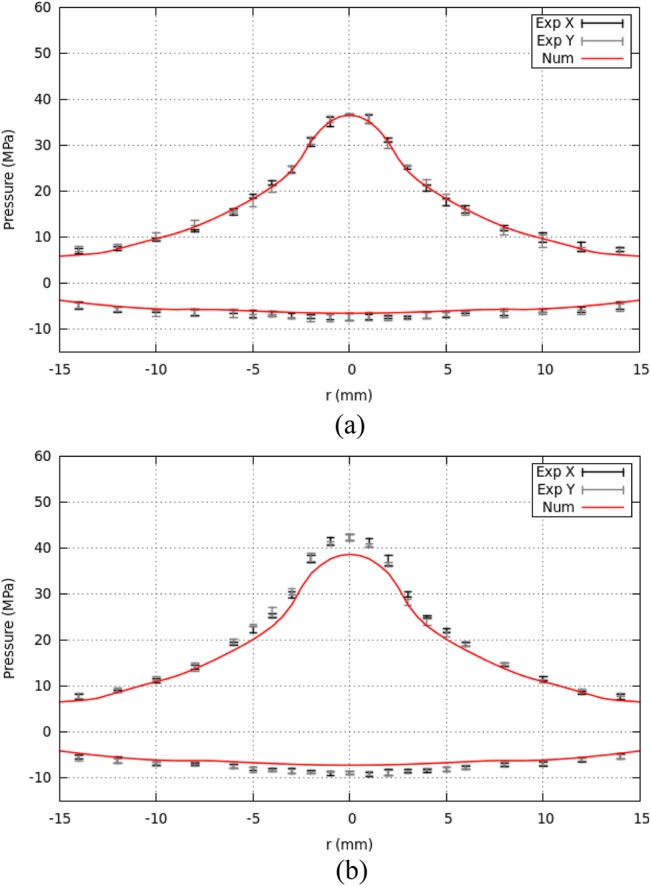
(Color online) Comparison of peak positive pressure , peak negative pressure , and beam width for the new lens with available experimental data over the dynamic range of the lithotripter. Polynomial fits are also shown (dotted lines for numerical and solid lines for experiment).
Lithotripter parameters calculated from pressure profiles taken from the focus and focal plane are presented in Table TABLE III.. There is good agreement between model and experiment for , , and . Error ranges from 1.1% to 8.3%. Error for is slightly higher at 18.9% and 20.5%. As with the original lens, error is high for rise time presumably due to grid refinement. Beam width is captured very well at 0.9% and 3.8% error and acoustic energy has error ranging from 8.0% to 22.3%.
Inclusion of kidney stone simulant
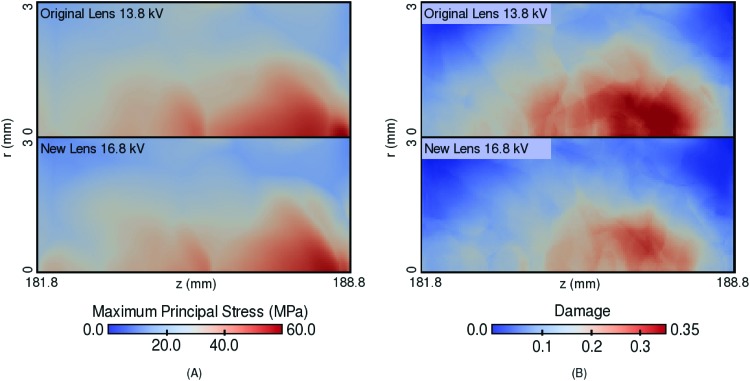
Last, results which include a cylindrical kidney stone simulant in the domain are shown. The stone has height 7 mm and radius 3 mm and is placed so that the proximal surface is at the geometrical focus of the lens, mm, as shown in Figs. 34. Figure 12 shows a comparison of the maximum principal stress over time and the damage for the original lens with 13.8 kV input and the new lens with 16.8 kV input. These inputs are used since they provide similar acoustic energy at the focus. The original lens appears to cause more damage in the stone, but this is expected in this case. While the acoustic energy is similar for mm, the stone has a radius of 3 mm and so the smaller beam width from the original lens leads to more acoustic energy encountering the stone. Also recall that the greater efficacy of the new lens includes cavitation effects which are not modeled here.
Figure 12.
Comparison of the maximum over time of the maximum principal stress (a) and the damage (b) in a cylindrical kidney stone simulant with height 7 mm and radius 3 mm for the original lens with 13.8 kV input versus the new lens with 16.8 kV input after the pulse has passed completely through.
The stress and damage results are preliminary work meant to show the capabilities of the model. Rigorous comparison to fracture experiments is left for future work. Nevertheless, this model gives similar distributions of maximum principal stress to that of Cleveland and Sapozhnikov37 and Sapozhnikov et al.38
DISCUSSION
In this work, a multiphysics computational model of a refracting EM lithotripter was presented. Many computational models of the wave propagation and nonlinear shock wave formation in ESWL have been developed, but none up to now have modeled this common type of lithotripter. This is most likely due to the fact that the focusing occurs by refraction inside a solid lens compared to all other lithotripter types where the focusing occurs in water, usually by reflection. This focusing type required a multiphysics approach in order to combine these two domains. In addition, arbitrary boundaries between the elasticity and Euler regions in the model allow for straightforward inclusion of lens modifications, different stone shapes, or any additional elastic solids, e.g., a stone holder. The model works seamlessly with AMR and could be applied to other domains requiring interaction of shock waves in fluids and linear elastic solids.
The model was successfully validated against experimental results for a standard lens design. The predictive capabilities of the model were also shown by comparing to experiment with a modified lens. Numerical and experimental pressure profiles match well and most calculated lithotripter parameters fall within the error estimates of the FOPH and model input. With regard to the chosen lens modification, the model correctly predicts the weakening and lengthening of the tensile wave, suppression of the second compressive wave, and the increase in beam width caused by the lens cut. This modified lens has been shown in other work to create pressure distributions similar to the HM3 which improve the efficacy of refracting EM lithotripters.7, 8, 39 Further modifications of the lens, including sweeps of lens geometry parameters, and the potential effect on stones can now be tested without requiring the fabrication of physical lenses.
ACKNOWLEDGMENTS
This research is supported by the National Institutes of Health through Grant No. 5R37DK052985-16. The authors would also like to acknowledge the support of Siemens, Munich, Germany for providing the electromagnetic shock wave generators and lenses used in this work.
References
- Rassweiler J. J., Knoll T., Kohrmann K.-U., McAteer J. A., Lingeman J. E., Cleveland R. O., Bailey M. R., and Chaussy C., “ Shock wave technology and application: An update,” Eur. Urol. 59, 784–796 (2011). 10.1016/j.eururo.2011.02.033 [DOI] [PMC free article] [PubMed] [Google Scholar]
- Chaussy C., Brendel W., and Schmiedt E., “ Extracorporeally induced destruction of kidney stones by shock waves,” Lancet 316, 1265–1268 (1980). 10.1016/S0140-6736(80)92335-1 [DOI] [PubMed] [Google Scholar]
- Lingeman J. E., Newman D., Mertz J. H., Mosbaugh P. G., Steele R. E., Kahnoski R. J., Coury T. A., and Woods J. R., “ Extracorporeal shock wave lithotripsy: The Methodist Hospital of Indiana experience,” J. Urol. (Baltimore) 135, 1134–1137 (1986). [DOI] [PubMed] [Google Scholar]
- Lingeman J. E., McAteer J. A., Gnessin E., and Evan A. P., “ Shock wave lithotripsy: Advances in technology and technique,” Nat. Rev. Urol. 6, 660–670 (2009). 10.1038/nrurol.2009.216 [DOI] [PMC free article] [PubMed] [Google Scholar]
- Lingeman J. E., Kim S. C., Kuo R. L., McAteer J. A., and Evan A. P., “ Shockwave lithotripsy: Anecdotes and insights,” J. Endourol. 17, 687–693 (2003). 10.1089/089277903770802191 [DOI] [PubMed] [Google Scholar]
- Miller N. L. and Lingeman J. E., “ Treatment of kidney stones: Current lithotripsy devices are proving less effective in some cases,” Nat. Clin. Pract. Urol. 3, 236–237 (2006). 10.1038/ncpuro0480 [DOI] [PubMed] [Google Scholar]
- Qin J., “ Performance evaluation and design improvement of electromagnetic shock wave lithotripters,” Ph.D. thesis, Duke University, 2008. [Google Scholar]
- Zhong P., Smith N., Simmons N., and Sankin G., “ A new acoustic lens design for electromagnetic shock wave lithotripters,” AIP Conf. Proc. 1359, 42–47 (2011). [Google Scholar]
- Coleman A. J., Choi M. J., and Saunders J. E., “ Theoretical predictions of the acoustic pressure generated by a shock wave lithotripter,” Ultrasound Med. Biol. 17, 245–255 (1991). 10.1016/0301-5629(91)90046-Y [DOI] [PubMed] [Google Scholar]
- Hamilton M. F., “ Transient axial solution for the reflection of a spherical from a concave ellipsoidal mirror,” J. Acoust. Soc. Am. 93, 1256–1266 (1993). 10.1121/1.405410 [DOI] [Google Scholar]
- Sankin G. N., Zhou Y., and Zhong P., “ Focusing of shock waves induced by optical breakdown in water,” J. Acoust. Soc. Am. 123, 4071–4081 (2008). 10.1121/1.2903865 [DOI] [PMC free article] [PubMed] [Google Scholar]
- Christopher P. T. and Parker K. J., “ New approaches to nonlinear diffractive field propagation,” J. Acoust. Soc. Am. 90, 488–499 (1991). 10.1121/1.401274 [DOI] [PubMed] [Google Scholar]
- Christopher P. T., “ Modeling the Dornier HM3 lithotripter,” J. Acoust. Soc. Am. 96, 3088–3095 (1994). 10.1121/1.411245 [DOI] [PubMed] [Google Scholar]
- Steiger E., “ FD-TD-modeling of propagation of high energy sound pulses in lithotripter-tissue-arrangements,” Proc.-IEEE Ultrason. Symp. 2, 1361–1364 (1997). [Google Scholar]
- Averkiou M. A. and Cleveland R. O., “ Modeling of an electrohydraulic lithotripter with KZK equation,” J. Acoust. Soc. Am. 106, 102–112 (1999). 10.1121/1.427039 [DOI] [PubMed] [Google Scholar]
- Zhou Y. and Zhong P., “ The effect of reflector geometry on the acoustic field and bubble dynamics produced by an electrohydraulic shock wave lithotripter,” J. Acoust. Soc. Am. 119, 3625–3636 (2006). 10.1121/1.2195074 [DOI] [PMC free article] [PubMed] [Google Scholar]
- Ginter S., Liebler M., Steiger E., Dreyer T., and Riedlinger R. E., “ Full-wave modeling of therapeutic ultrasound: Nonlinear ultrasound propagation in ideal fluids,” J. Acoust. Soc. Am. 111, 2049–2059 (2002). 10.1121/1.1468876 [DOI] [PubMed] [Google Scholar]
- Tanguay M., “ Computation of bubbly cavitating flow in shock wave lithotripsy,” Ph.D. thesis, California Institute of Technology, 2004. [Google Scholar]
- Krimmel J., Colonius T., and Tanguay M., “ Simulation of the effects of cavitation and anatomy in the shock path of model lithotripters,” in 3rd International Urolithiasis Research Symposium (2010), Vol. 38, pp. 505–518. [DOI] [PMC free article] [PubMed]
- Iloreta J. I., Zhou Y., Sankin G. N., Zhong P., and Szeri A. J., “ Assessment of shock wave lithotripters via cavitation potential,” Phys. Fluids 19, 086103 (2007). 10.1063/1.2760279 [DOI] [PMC free article] [PubMed] [Google Scholar]
- LeVeque R. J., “ Wave propagation algorithms for multidimensional hyperbolic systems,” J. Comput. Phys. 131, 327–353 (1997). 10.1006/jcph.1996.5603 [DOI] [Google Scholar]
- LeVeque R. J., Finite Volume Methods for Hyperbolic Problems (Cambridge University Press, New York, 2002), pp. 1–534. [Google Scholar]
- Mitran S., “ BEARCLAW software,” http://mitran.web.unc.edu/codes (Last viewed 8/31/12).
- Ford H., Advanced Mechanics of Materials (Wiley, New York, 1963), Chap. 5. [Google Scholar]
- Timoshenko S. P. and Goodier J. N., Theory of Elasticity (McGraw-Hill, New York, 1970), Chap. 12. [Google Scholar]
- Fogarty T. R. and LeVeque R. J., “ High-resolution finite-volume methods for acoustic waves in periodic and random media,” J. Acoust. Soc. Am. 106, 17–28 (1999). 10.1121/1.428038 [DOI] [Google Scholar]
- McAteer J., Williams J., Cleveland R., Van Cauwelaert J., Bailey M., Lifshitz D., and Evan A., “ Ultracal-30 gypsum artificial stones for research on the mechanisms of stone breakage in shock wave lithotripsy.” Urol. Res. 33, 429–434 (2005). 10.1007/s00240-005-0503-5 [DOI] [PubMed] [Google Scholar]
- Korenchenko A. E. and Beskachko V. P., “ Determining the shear modulus of water in experiments with a floating disk,” J. Appl. Mech. Tech. Phys. 49, 80–83 (2008). 10.1007/s10808-008-0011-9 [DOI] [Google Scholar]
- Lemaitre J. and Chaboche J.-L., Mechanics of Solid Materials (Cambridge University Press, Cambridge, 1990), Chap. 7. [Google Scholar]
- Thompson P. A., Compressible-Fluid Dynamics (McGraw-Hill, New York, 1972), Chap. 2. [Google Scholar]
- Eisenmenger W., “ Elektromagnetische erzeugung von ebenen druckstoessen in fluessigkeiten (Electromagnetic generation of plane pressure pulses in liquids),” Acustica 12, 185–202 (1962). [Google Scholar]
- Arora M., Ohl C. D., and Lohse D., “ Effect of nuclei concentration on cavitation cluster dynamics,” J. Acoust. Soc. Am. 121, 3432–3436 (2007). 10.1121/1.2722045 [DOI] [PubMed] [Google Scholar]
- Liebler M., Dreyer T., and Riedlinger R. E., “ Modeling of interaction between therapeutic ultrasound propagation and cavitation bubbles,” Ultrasonics 44, e319–e324 (2006). [DOI] [PubMed] [Google Scholar]
- Pishchalnikov Y., Sapozhnikov O., Bailey M., Pishchalnikova I., Williams J., and McAteer J., “ Cavitation selectively reduces the negative-pressure phase of lithotripter shock pulses,” ARLO 6, 280–286 (2005). 10.1121/1.2127115 [DOI] [PMC free article] [PubMed] [Google Scholar]
- Smith N., Sankin G. N., Simmons W. N., Nanke R., Fehre J., and Zhong P., “ A comparison of light spot hydrophone and fiber optic hydrophone for lithotripter field characterization” Rev. Sci. Instrum. 83, 014301 (2012). 10.1063/1.3678638 [DOI] [PMC free article] [PubMed] [Google Scholar]
- Egilmez T., Tekin M. I., Gonen M., Kilinc F., Goren R., and Ozkardes H., “ Efficacy and safety of a new-generation shockwave lithotripsy machine in the treatment of single renal or ureteral stones: Experience with 2670 patients,” J. Endourol. 21, 23–27 (2007). 10.1089/end.2006.0174 [DOI] [PubMed] [Google Scholar]
- Cleveland R. O. and Sapozhnikov O. A., “ Modeling elastic wave propagation in kidney stones with application to shock wave lithotripsy,” J. Acoust. Soc. Am. 118, 2667–2676 (2005). 10.1121/1.2032187 [DOI] [PubMed] [Google Scholar]
- Sapozhnikov O. A., Maxwell A. D., Macconaghy B., and Bailey M. R., “ A mechanistic analysis of stone fracture in lithotripsy,” J. Acoust. Soc. Am. 121, 1190–1202 (2007). 10.1121/1.2404894 [DOI] [PubMed] [Google Scholar]
- Mancini J. G., Neisius A., Smith N., Sankin G., Astroza G. M., Lipkin M. E., Simmons W. N., Preminger G. M., and Zhong P., “ Assessment of a modified acoustic lens for electromagnetic shock wave lithotripters in a swine model,” J. Urol., in press (2013), doi: 10.1016/j.juro.2013.02.074. [DOI] [PMC free article] [PubMed] [Google Scholar]


