Abstract
Purpose: Breast CT is an emerging imaging technique that can portray the breast in 3D and improve visualization of important diagnostic features. Early clinical studies have suggested that breast CT has sufficient spatial and contrast resolution for accurate detection of masses and microcalcifications in the breast, reducing structural overlap that is often a limiting factor in reading mammographic images. For a number of reasons, image quality in breast CT may be improved by use of an energy resolving photon counting detector. In this study, the authors investigate the improvements in image quality obtained when using energy weighting with an energy resolving photon counting detector as compared to that with a conventional energy integrating detector.
Methods: Using computer simulation, realistic CT images of multiple breast phantoms were generated. The simulation modeled a prototype breast CT system using an amorphous silicon (a-Si), CsI based energy integrating detector with different x-ray spectra, and a hypothetical, ideal CZT based photon counting detector with capability of energy discrimination. Three biological signals of interest were modeled as spherical lesions and inserted into breast phantoms; hydroxyapatite (HA) to represent microcalcification, infiltrating ductal carcinoma (IDC), and iodine enhanced infiltrating ductal carcinoma (IIDC). Signal-to-noise ratio (SNR) of these three lesions was measured from the CT reconstructions. In addition, a psychophysical study was conducted to evaluate observer performance in detecting microcalcifications embedded into a realistic anthropomorphic breast phantom.
Results: In the energy range tested, improvements in SNR with a photon counting detector using energy weighting was higher (than the energy integrating detector method) by 30%–63% and 4%–34%, for HA and IDC lesions and 12%–30% (with Al filtration) and 32%–38% (with Ce filtration) for the IIDC lesion, respectively. The average area under the receiver operating characteristic curve (AUC) for detection of microcalcifications was higher by greater than 19% (for the different energy weighting methods tested) as compared to the AUC obtained with an energy integrating detector.
Conclusions: This study showed that breast CT with a CZT photon counting detector using energy weighting can provide improvements in pixel SNR, and detectability of microcalcifications as compared to that with a conventional energy integrating detector. Since a number of degrading physical factors were not modeled into the photon counting detector, this improvement should be considered as an upper bound on achievable performance.
Keywords: breast CT, photon counting, energy weighting
INTRODUCTION
Mammography is the most commonly used method to screen women for breast cancer, and is thought to greatly reduce the breast cancer mortality rate.1, 2 Even though mammography has saved many lives, it is far from perfect. One of its’ major limitations is that mammography is a 2D imaging device, and the superposition of the 3D breast structure onto the 2D imaging plane makes it difficult for radiologists to visualize important diagnostic structures. In an effort to reduce this structural overlap, a number of researchers are investigating the feasibility of dedicated breast CT systems.3, 4, 5, 6, 7, 8, 9, 10 Several experimental breast CT prototypes have been constructed and testing is currently underway. Most of these early prototypes image the breast in the prone position using a half-cone-beam acquisition geometry and use an a-Si/CsI:Tl flat-panel detector. Although results from early clinical testing have been promising,11, 12 there are limitations of this technology that might result in lower image quality than desired. In particular, there appears to be difficultly in visualizing some microcalcification clusters,11, 13 as well as some low-contrast lesions. Thus, it is hypothesized that any improvements in breast CT technology could be greatly beneficial.
Photon counting CT detectors that can individually count each x-ray, and estimate its’ energy hold great promise for improving image quality in breast CT. Historically, it has been difficult to operate CT in photon-counting mode in the presence of a high x-ray flux incident on the detector. However, owing to recent technological improvements in room temperature semiconductor based detectors, it is now feasible for photon counting detectors to be used for CT applications with moderate x-ray flux requirements. Given that the dose to the breast is typically constrained to approximately that of the dose given for mammography, one of these applications is breast CT. Photon counting detectors for breast CT promise to provide a number of advantages as compared to current energy integrating detectors. Some of these include; the reduction of electronic and Swank noise,14 increased dynamic range, the capability of spectral CT for material decomposition without multiple exposures, and improved signal-to-noise ratio (SNR) through energy weighting. The goal of this study was to investigate this last advantage, energy weighing for improving the performance of breast CT.
Through the conversion of x-rays to secondary quanta, energy integrating detectors inherently weigh detected photons proportional to their energy. This weighting scheme is suboptimal because breast tumor contrast is higher when imaging with lower energy x-rays. Photon counting detectors inherently weigh each detected photon equivalently, and thus provide an improved weighting scheme over energy integrating detectors. Tapiovaara and Wagner15 developed an optimal weighting scheme that gives more weight to lower energy photons, thus maximizing the SNR in x-ray projection data. This approach of applying weights to projection data is referred to as projection-based (PB) weighting. Previous computer simulation and experimental studies have investigated the use of optimal projection-based weights and showed improved SNR is obtainable.16, 17, 18, 19 Another photon weighting approach that has been suggested is image-based (IB) weighting,16 where weights are applied to separate reconstructions computed from projections acquired in each energy bin, followed by their summation. Schmidt16 has recently proposed an image-based weighting scheme in which weights are analytically calculated to maximize the contrast-to-noise ratio (CNR) in the summed reconstruction.16
Previous computer simulation studies that investigated projection-based and image-based energy weighting schemes for breast CT (Refs. 16, 18, 20, 21) performed evaluations using cylindrical phantoms with composition of 50% adipose tissue and 50% glandular tissue with lesions (signals) modeled as CaCO3 and iodine (to model microcalcification and iodinated contrast enhanced breast tumor). Projection data were simulated into various energy bins using 90 and 120 kVp tungsten anode spectra. The study performed here also describes computer simulations to evaluate and compare projection-based and image-based weighting to that of an energy integrating detector, however, we use lower kVp spectra ranging from 50 to 80 kVp, more pertinent for breast CT. A number of studies have reported that kVp settings in the range of 50–60 kVp give better performance for breast CT using energy integrating detectors so it is likely that this kVp range would also perform better for breast CT with photon counting detectors.22, 23 Although energy weighting is a promising approach for improving image quality, it has also been suggested that improved performance can be obtained with energy integrating detectors by filtering the x-ray tube output to generate a “quasimonochromatic” spectra.22, 24, 25, 26 We explore this further by comparing performance of energy weighting methods (with and without the use of a quasimonochromatic spectrum) to that obtained with an energy integrating detector using a quasimonochromatic x-ray spectrum.
In addition to using a SNR figure-of-merit obtained from a simple cylindrical phantom containing spheres of different clinically relevant materials, we also evaluate the accuracy of microcalcification detection using computer simulated images with an anthropomorphic breast phantom. In this evaluation, human observer performance in detecting small microcalcifications embedded into realistic breast CT images was evaluated both with reconstructions obtained from a photon counting detector with energy weighting and reconstructions obtained with an energy integrating detector.
Section 2 reviews the theory of energy weighting for both the projection-based and image-based methods. Section 3 describes two studies to evaluate and compare energy weighting using a CZT based photon counting detector to that of a CsI based energy integrating detector. The first study uses a simple SNR figure-of-merit, and the second study assesses objective performance in detecting microcalcifications using receiver operating characteristic (ROC) analysis. In Sec. 4, we discuss results from these studies, and in Sec. 5 we provide some conclusions.
THEORY
Projection-based weights
Given an unknown object characterized by its spatial and energy dependent linear attenuation coefficient μ(l, E), the log normalized line integral along a path l through the object can be expressed as
| (1) |
where, Io is the x-ray fluence incident on the detector with no object present (otherwise referred to as a blank scan), and w(E) is an energy dependent weighting function. For energy integrating detectors, this weight is inherently proportional to the photon energy deposited, whereas for photon counting detectors, this weighting function is simply equal to 1. One of the advantages of photon counting detectors is that user-defined weights can be applied. Given a simple object model with a contrast element of diameter d embedded in a uniform background region, it can be shown15 that the weights at discrete energies Ei required to maximize SNR are
| (2) |
where μs and μb are energy-dependent linear attenuation coefficients for the signal and background tissues, respectively. In the typical use of photon counting detectors, recorded photons are separated into multiple energy bins, thus the linear attenuation coefficients used in Eq. 2 become the weighted average over the energy range of the ith energy bin expressed as
| (3) |
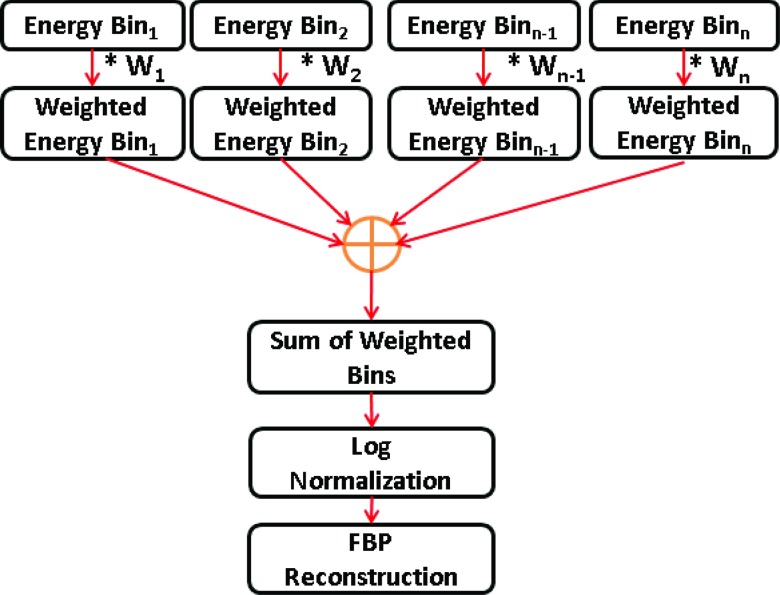
Assuming that the detector is capable of measuring photons into N energy bins, Fig. 1 illustrates a flow chart describing the steps of the projection-based weighting method. The log normalized projection data in energy bin “i” with projection-based weights can be expressed as
| (4) |
where wPB(i) are the normalized projection-based weights corresponding to an energy bin “i.” Thus the measured projection data in each energy bin are weighted by the optimized weights of Eq. 2, summed, and then log-normalized before reconstruction.
Figure 1.
Flowchart describing the projection-based weighting method.
Image-based weighting
The image-based weighting scheme is performed post reconstruction and involves the application of weights to reconstructions of individual energy bins.16, 20 The normalized image-based weights are given as
| (5) |
where Ci represents the signal contrast in the reconstruction of energy bin “i,” and is given as
| (6) |
The linear attenuation coefficients for signal and background were obtained from lookup tables obtained as described in Sec. 3A2. The noise (σ2) in Eq. 5 was estimated by computing the variance of voxel values within a background region-of-interest (ROI) in each reconstructed dataset. A generalized expression describing the reconstructed image with IB weights is given as
| (7) |
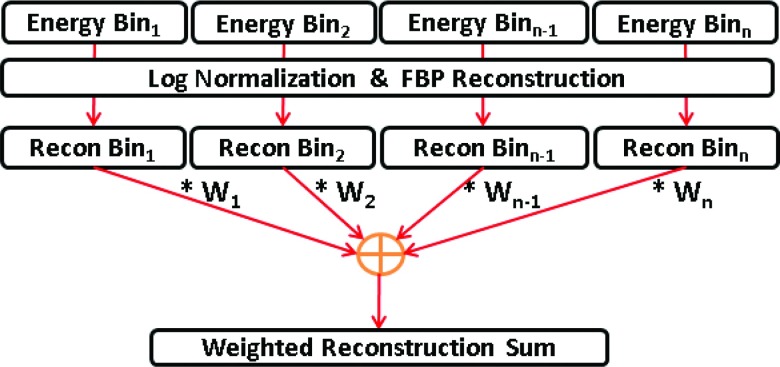
where, RecIB is the final image weighted reconstruction, wIB(i) are the normalized image-based weights corresponding to an energy bin “i,” and FBP represents filtered back projection reconstruction.27 Figure 2 shows a generalized flow chart illustrating the steps for implementation of the image-based weighting scheme (IB) for a photon counting detector with N energy bins. The N energy bin projection sets are log normalized and then individually reconstructed using FBP.
Figure 2.
Flowchart describing the image-based weighting method.
METHODS
Simulation study
To evaluate and compare the performance achieved with the different energy weighting schemes to that of an energy integrating detector, a computer simulation study was conducted. A previously described breast CT simulation methodology28 that generates realistic projection datasets by modeling our prototype bench-top BCT system using a half-cone-beam geometry was used.
Geometry and x-ray spectra
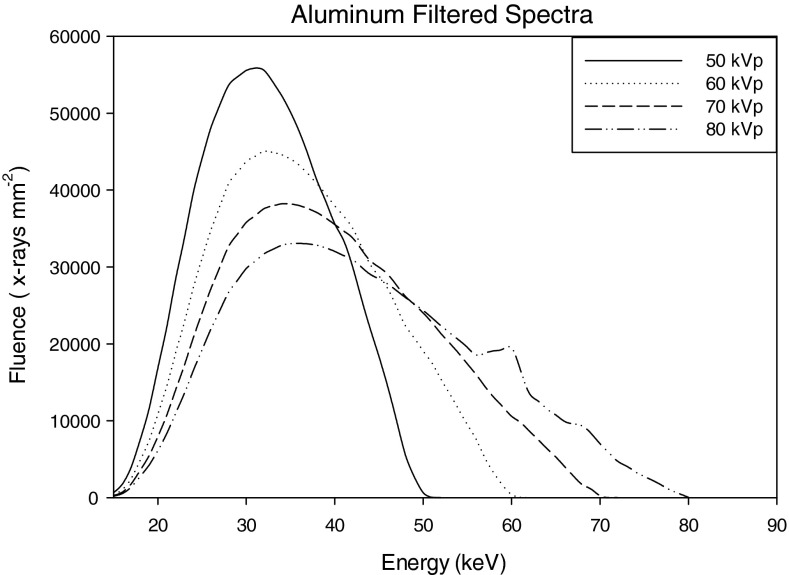
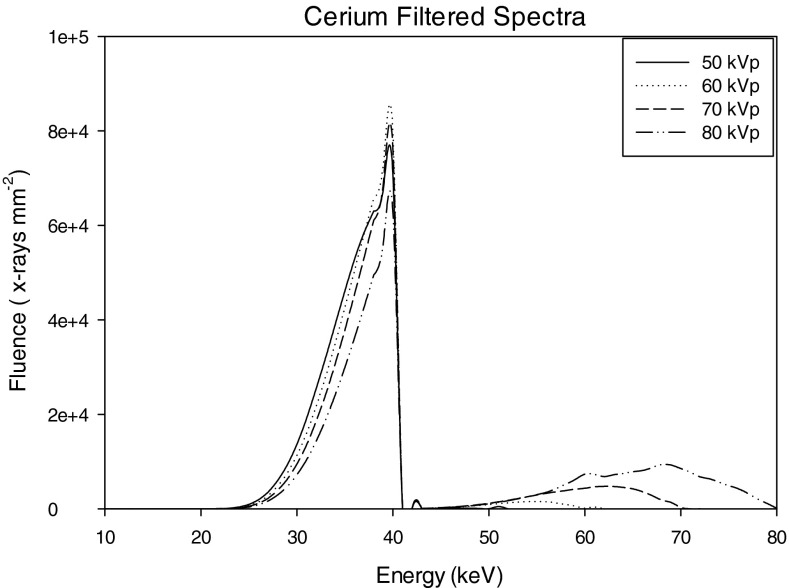
The x-ray tube was modeled as a point source and x-ray spectra of 50, 60, 70, and 80 kVp at 1 keV intervals were generated using the tungsten anode spectral model (TASMIP) developed by Boone and Seibert.29 Two different filtration materials were modeled, 0.2 and 0.56 mm of Ce and; 0.9 mm of Al. The x-ray fluence of these TASMIP spectra were scaled using previously determined Monte Carlo based normalized glandular dose coefficients30 to provide a 10 mGy mean glandular dose (MGD) to the breast-like phantom over 360 projection angles. Figures 345 show x-ray spectra using Al and Ce filtration.
Figure 3.
Aluminum filtered spectra: 50–80 kVp.
Figure 4.
Cerium filtered spectra: 50–80 kVp.
Figure 5.
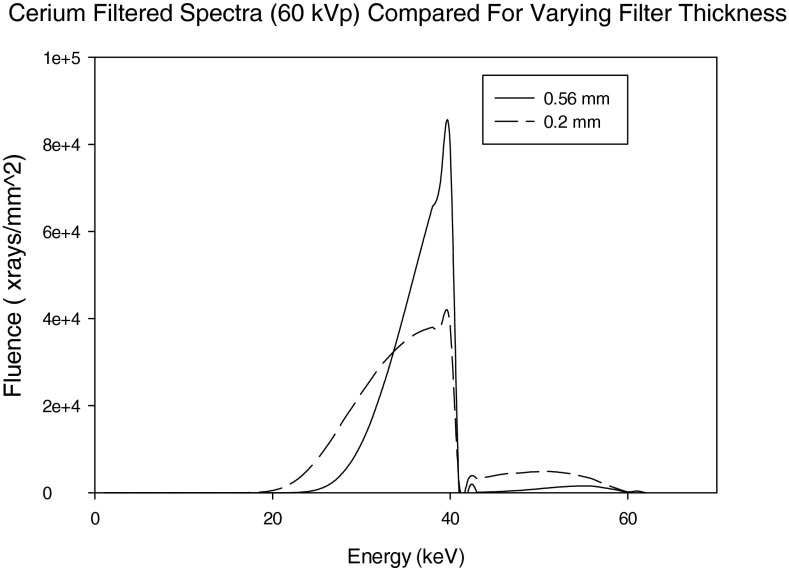
60 kVp spectra filtered with 0.2 and 0.56 mm Cerium filter.
Phantoms
Two different digital phantoms were used, one to assess SNR using spherical lesion models of different material composition, and another for use with an observer performance study to assess microcalcification detection accuracy.
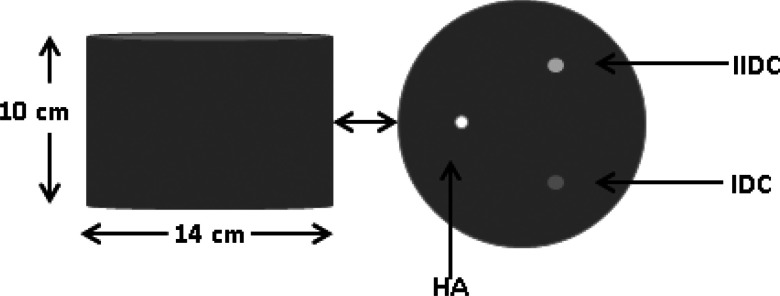
The first phantom was of a cylindrical shape with three embedded spheres composed of different material types (see Fig. 6). The dimensions of the cylinder were 14 cm in diameter, 10 cm in height with 20% fibro-glandular, and 80% adipose tissue composition modeling an average breast composition.31 The cylindrical phantom was sampled using 200 μm3 cubic voxels. The embedded spheres were positioned in the center slice of the cylinder (i.e., 5 cm from the chest wall) at a radius of 4 cm, with each sphere separated by 120°. The material composition of the spheres was microcalcification modeled as calcium hydroxyapatite (HA), infiltrating ductal carcinoma (IDC), and iodine enhanced infiltrating ductal carcinoma (IIDC). The diameters of these spheres were 6 mm (HA) and 10 mm (IDC, IIDC). The energy dependent linear attenuation coefficients of the background medium (i.e., adipose and fibroglandular tissue), and IDC were modeled based on previous experimental tissue measurements.31, 32 The linear attenuation coefficients of adipose, glandular tissue, IDC were calculated as a weighted combination of the attenuation coefficients of aluminum and lucite,32 respectively, expressed as
| (8a) |
| (8b) |
| (8c) |
Iodine contrast agent is typically administered intravenously and perfuses through the breast vasculature. The attenuation property of the iodine enhanced sphere was modeled as a weighted combination of the linear attenuation coefficients of iodine and IDC given as
| (9) |
where ρiodine is the density of iodine in the blood taken to be 0.0025 g/ml.33
Figure 6.
Diagram showing the dimensions of the cylindrical phantom. A cross section of the central slice of the cylindrical phantom showing the location of lesion inserts (HA, IDC, IIDC) is shown on the right.
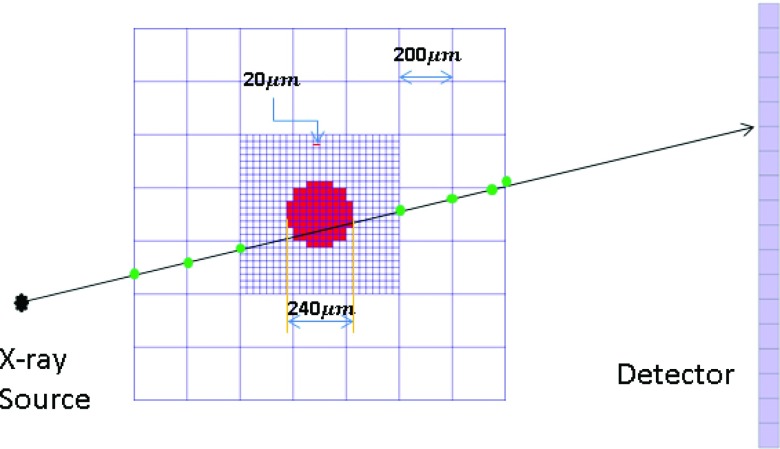
The second phantom used for the observer performance study was selected from an ensemble of previously developed anthropomorphic voxelized breast phantoms. These phantoms were generated based on CT reconstructions of fresh surgical mastectomy specimens as described previously by O’Connor.34 The voxelized breast phantom that was selected for the study herein had a volume of 366.7 cubic centimeters and an approximate tissue composition of 78% adipose tissue/22% fibroglandular tissue. The phantom voxel size was 200 μm3. Microcalcifications (i.e., spheres) of diameter 240 μm were placed at locations defined by a small 5 × 5 grid enclosed within a 1 cm3 cubic ROI. At each of the positions in the 5 × 5 grid, a “coin flip” determined whether the calcification was present or not (for example, Fig. 7 shows three random microcalcification arrays that were used). The 5 × 5 microcalcification array was placed within a cubic ROI of size 500 × 500 × 500, where each voxel was 20 μm voxels. Thus the region of the breast phantom containing calcifications was subsampled to have voxels that were ten times smaller than the background of the breast phantom (see Fig. 8). This subsampling provided more accurate ray-tracing of the small microcalcifications. The 5 × 5 microcalcification arrays were randomly inserted into the breast phantom such that they were embedded partly in adipose and partly in glandular tissues and they were oriented in a manner such that a transverse reconstructed slice would show one set of microcalcifications. The linear attenuation coefficients used to model fibroglandular and adipose tissue were based on the experimental tissue measurements of Johns and Yaffe,32 and the attenuation coefficient of microcalcifications were modeled as HA.
Figure 7.
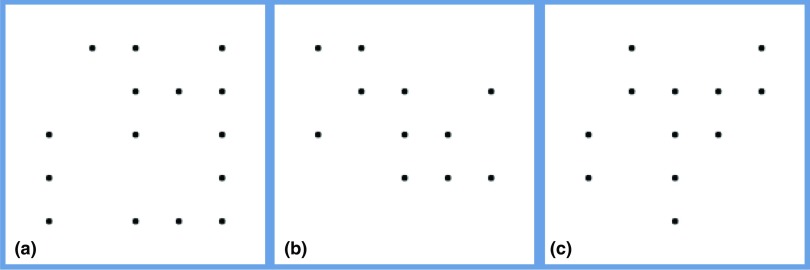
(a)–(c) Diagram showing three random microcalcification templates used to generate the test images. Microcalcifications were randomly inserted at positions on a 5 × 5 grid. These microcalcifications were then placed in the breast phantom partly in adipose and partly in glandular tissues.
Figure 8.
Diagram illustrating x-ray tracing through the anthropomorphic breast phantom and microcalcification voxels. The dimensions of the breast phantom voxel, microcalcification voxel, and the microcalcification sphere (comprising several microcalcification voxels) are 200, 20, and 240 μm, respectively.
Generating projections and detector response modeling
To generate projection data, we used our previously described simulation methodology.28 There are two stages in the simulation program; (1) determining the x-ray transmission through the breast object, and (2) modeling the signal and noise transport through the detector. The fraction of x-rays transmitted through the voxelized breast phantom along a ray connecting the x-ray source and each projection pixel was computed using Siddon's ray-tracing algorithm35 and can be expressed as
| (10) |
where, μ represents the energy dependent linear attenuation coefficient at voxel location (i, j, k) for energy En, and lm is the line segment passing through voxel element (i, j, k) along the ray connecting the x-ray point source to the detector pixel m. Compton scatter within the breast was not modeled. Using Eq. 10, the x-ray fluence on each detector pixel at each discrete energy was then computed as
| (11) |
where, Io represents the energy dependent x-ray fluence incident on the detector with no object present.
Two different detectors were modeled; (1) an a-Si/CsI based flat-panel, energy integrating detector modeling the Varian PaxScan 2520 (Varian Medical Systems, Palo Alto, CA), and (2) a hypothetical CZT based photon counting detector. Both of these detectors were modeled as having 1920 × 1536 pixels with pixel pitch of 127 μm, and operated in a 2 × 2 binning mode to provide 960 × 768 pixel projection images with a pixel pitch of 254 μm. Both the CsI and CZT were modeled with 600 μm thickness. Below we describe the formation of the simulated projection data using each detector model.
Modeling of a-Si CsI based detector
The modeling of the a-Si/CsI energy integrating detector involved three stages; (1) interaction of x-rays within the scintillator, (2) amplification factor within the scintillator, and (3) additive electronic noise. Due to stochastic variations in x-ray tube emission and x-ray transport through the breast, the x-ray fluence incident on the detector was modeled using a Poisson distribution. Absorption of x-rays within the scintillator is a binomial process, and a Poisson random variable that is passed through a binomial selection process still follows a Poisson process.36 Thus instead of simulating a binomial selection process, the mean quantum detection efficiency ηCsI(En) of the CsI scintillator was multiplied by the incident x-ray fluence at each discrete energy level (En), and then Poisson noise was introduced by selecting a random deviate from a Poisson distribution. Thus, the x-ray fluence absorbed by the scintillator was modeled as
| (12) |
The second stage modeled the CsI conversion gain (ψ) using a deterministic assumption of 58 optical photons produced per keV of absorbed energy, and the optical collection efficiency (OCE) which models the fraction of optical quanta incident on the imaging array and the coupling efficiency of the photodiode. Here it was assumed that 65% of optical quanta are incident on the imaging array and that 80% of incident optical photons are converted to electrons, giving an OCE of 52%. Thus the quantum fluence after the second stage was modeled as
| (13) |
Finally, the total quanta at each pixel m was estimated by summing over all discrete energies in the input spectrum
| (14) |
After summing over energy, the noise no longer has a Poisson distribution. Additive electronic noise was then introduced using a Gaussian process with standard deviation of 3308 electrons (modeling a Varian 2520 flat-panel detector). Note that spreading of optical quanta in the scintillator was not modeled here.
Modeling of CZT based detector
Only one stage was used in modeling of the CZT photon counting detector, the interaction of x-rays within the CZT crystal. Thus Eq. 12 was used with quantum detection efficiency for CZT material. Photon counting detectors typically have multiple thresholds that can be set by the user to accumulate counts in different energy windows. Thus the total quanta at each pixel m and each energy bin i can be expressed as
| (15) |
where i = 1,……N represents the energy bin and {τi} represents the set of threshold energies separating the energy bins. In this study, the total quanta were computed at 1 keV energy intervals starting at a lower threshold of 20 keV. These 1 keV interval projection sets were then summed appropriately to simulate imaging with three energy bins. Tables 1, 2, 3 indicate the optimal energy bins that were determined for each material (HA, IDC, IIDC).
Table 1.
PB and IB energy bins for the HA signal using 50–80 kVp.
| Projection-based weighting |
Image-based weighting |
|||||
|---|---|---|---|---|---|---|
| Energy (kVp) | Bin 1 (keV) | Bin 2 (keV) | Bin 3 (keV) | Bin 1 (keV) | Bin 2 (keV) | Bin 3 (keV) |
| 50 | 20–33 | 34–38 | 39–50 | 20–30 | 31–36 | 37–50 |
| 60 | 20–33 | 34–45 | 46–60 | 20–34 | 35–42 | 43–60 |
| 70 | 20–37 | 38–56 | 57–70 | 20–33 | 34–45 | 46–70 |
| 80 | 20–37 | 38–62 | 63–80 | 20–35 | 36–63 | 64–80 |
Table 2.
PB and IB energy bins for the IDC signal using 50–80 kVp.
| Projection-based weighting |
Image-based weighting |
|||||
|---|---|---|---|---|---|---|
| Energy (kVp) | Bin 1 (keV) | Bin 2 (keV) | Bin 3 (keV) | Bin 1 (keV) | Bin 2 (keV) | Bin 3 (keV) |
| 50 | 20–29 | 30–36 | 37–50 | 20–29 | 30–36 | 37–50 |
| 60 | 20–33 | 34–45 | 46–60 | 20–33 | 34–42 | 43–60 |
| 70 | 20–36 | 37–56 | 57–70 | 20–33 | 34–45 | 46–70 |
| 80 | 20–37 | 38–55 | 56–80 | 20–37 | 38–63 | 64–80 |
Table 3.
PB and IB energy bins for the IIDC signal using 50–80 kVp.
| Projection-based weighting |
Image-based weighting |
|||||
|---|---|---|---|---|---|---|
| Energy (kVp) | Bin 1 (keV) | Bin 2 (keV) | Bin 3 (keV) | Bin 1 (keV) | Bin 2 (keV) | Bin 3 (keV) |
| 50 | 20–33 | 34–38 | 39–50 | 20–31 | 32–37 | 38–50 |
| 60 | 20–33 | 34–45 | 46–60 | 20–31 | 32–42 | 43–60 |
| 70 | 20–37 | 38–56 | 57–70 | 20–40 | 41–49 | 50–70 |
| 80 | 20–37 | 38–62 | 63–80 | 20–44 | 45–64 | 65–80 |
In addition, although not currently feasible, imaging with 1 keV wide bins was also studied. The total MGD used in generating the projection data in all energy bins was equivalent to that delivered with the corresponding polychromatic spectrum. Note that the detector blur caused by charge sharing and characteristic x-rays was not modeled here. In addition, a low x-ray flux was assumed so that pulse-pileup was negligible.
Energy bins for the projection-based and image-based weighting methods were optimized using analytical expressions for the maximum SNR given by Shikhaliev37 with required parameters generated from a breast CT model. This model includes a definition of the particular task of interest, so the K-edge of iodine was considered. Optimal energy bins for projection-based and image-based weighting differ because the former weighs the raw projection data, whereas the latter weighs the projection data after log normalization.
Image reconstruction
Simulated projections were log-normalized, and reconstructed using Feldkamp's filtered backprojection algorithm.27 Pixels with zero counts in the 1 keV energy bin projections were assigned a value of 0.000001 prior to negative log normalization. In all cases, no windowing was applied to the ramp filter, and the reconstructed voxel size was 200 μm3.
SNR
For each method, the SNR was computed as
| (16) |
where represents the mean voxel value within a cubic volume-of-interest (VOI) of size 30 × 30 × 30 voxels (15 × 15 × 15 voxels for the case of the HA sphere) within each reconstructed sphere, and represents the mean background similarly computed from a VOI in a nearby background region where the influence of the signal was not present The denominator of Eq. 16 represents the standard deviation (σ) of voxel counts within the same background VOI.
Comparison of methods for SNR analysis
The SNR for each of the three materials was computed for the following:
-
1.
Energy integrating detector (EID), using 50, 60, 70, and 80 kVp with 0.9 mm Al filtration (EID-Al).
-
2.
EID using 50, 60, 70, and 80 kVp with 0.56 mm Ce filtration [EID-Ce (0.56 mm)].
-
3.
Photon counting detector with PB energy weighting using 1 keV energy bins (PB 1 keV) with aluminum filtration.
-
4.
Photon counting detector with PB energy weighting using three energy bins (PB 3 EW) with aluminum filtration as defined in Tables 1, 2, 3.
-
5.
Photon counting detector with IB energy weighting using 1 keV energy bins (IB 1 keV) with aluminum filtration.
-
6.
Photon counting detector with IB energy weighting using three energy bins (IB 3 EW) with aluminum filtration as defined in Tables 1, 2, 3.
Additional simulations were performed to examine SNR of the IIDC signal using spectra filtered with 0.2 mm Ce [10th value layer (VL)] for both photon counting and energy integrating detectors. In addition, SNR was computed assuming a monoenergetic source, ranging from 20 to 50 keV with a MGD of 10 mGy at each 1 keV energy. Although this scenario is not technically feasible, it is revealing in that it provides an upper bound on SNR performance.
Observer performance study
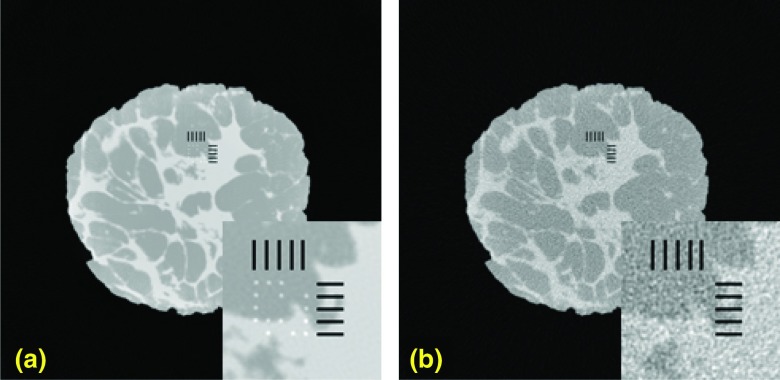
Central reconstructed slices of the anthropomorphic breast phantom containing the 5 × 5 microcalcification array were extracted and used to assess observer performance in detecting microcalcifications. Shown in Fig. 9 are examples of reconstructed slices demonstrating noise-free (a) and noisy (b) images containing the 5 × 5 microcalcification array. Three observers (medical physicists) were asked to give a confidence rating on whether a microcalcification was present or absent at each of the 5 × 5 locations indicated by grid lines demonstrating possible locations (see Fig. 9). Observers were asked to view the image and rate the presence of a microcalcification using a 1–4 grade scale, where 1 implied that the calcification was definitely absent, 2 implied probably absent, 3 implied probably present, and a rating of 4 suggested that the calcification was definitely present.
Figure 9.
An example of noise-free (a) and noisy (b) reconstructed slice of phantom with embedded microcalcifications. A magnified ROI indicating the possible locations of the microcalcifications is displayed to the bottom right side of these images.
Prior to the reader study, a training session was conducted in which the observer viewed 25 possible microcalcification locations (i.e., one 5 × 5 cluster), followed by a presentation of the true calcification locations. After the training session, each observer viewed 150 microcalcifications (i.e., six 5 × 5 clusters) for each of five processing methods simulated with a MGD of 6 mGy; (1) EID with 0.9 mm Al filtering, (2) EID with 0.56 mm Ce filtering, (3) PB energy weighting with 1 keV energy bins ranging from 20 to 50 keV, (4) PB energy weighting with three energy bins as defined in Table 1 and 5 IB energy weighting with three energy bins as defined in Table 1. In all cases of energy weighting, the CZT detector model with an Al filtered (0.9 mm) 50 kVp spectra was simulated.
The University of Iowa's dbm mrmc roc program (version 2.33 beta) (Refs. 38 and 39) was used to analyze multiuser, multicase confidence scoring data. Results from the ROC analysis were used to compare microcalcification detection accuracy for the three users and for the five different methods. The confidence data for each observer was analyzed and ROC curves were generated using the “PROPROC” (semiparametric) curve fitting option in the dbm mrmc software.38 The area under the ROC curve (AUC) was calculated using the “Trapezoidal/Wilcoxon” (nonparametric) curve fitting option in the dbm mrmc software.38
RESULTS
X-ray spectra
Figures 345 show the scaled aluminum and cerium filtered spectra used in the experiment. The scaled spectrum corresponds to the total photon fluence that is used to generate a 360 angle projection set for the given dose. As compared to the aluminum filtered spectrum, the cerium filtered beam is quasimonoenergetic (spread approximately over 13 keV). Most of the x-ray fluence in the Ce spectra lies within the 28–41 keV range, with a sharp cutoff near the K-edge of Ce (40.4 keV). Studies have shown that quasimonoenergetic spectra can provide improved performance in breast CT.22, 24, 25, 26
Figure 5 compares the 0.2 mm (10th VL) and 0.56 mm (100th VL) Ce-filtered spectra. It is observed that the thinner Ce is observed to pass more x-rays with energies above the K-edge of Ce (40.4 keV).
Weighting functions
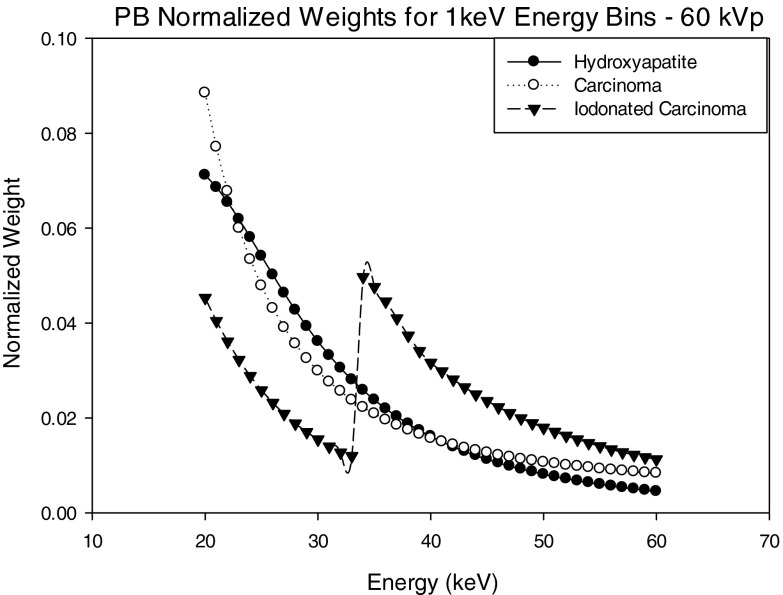
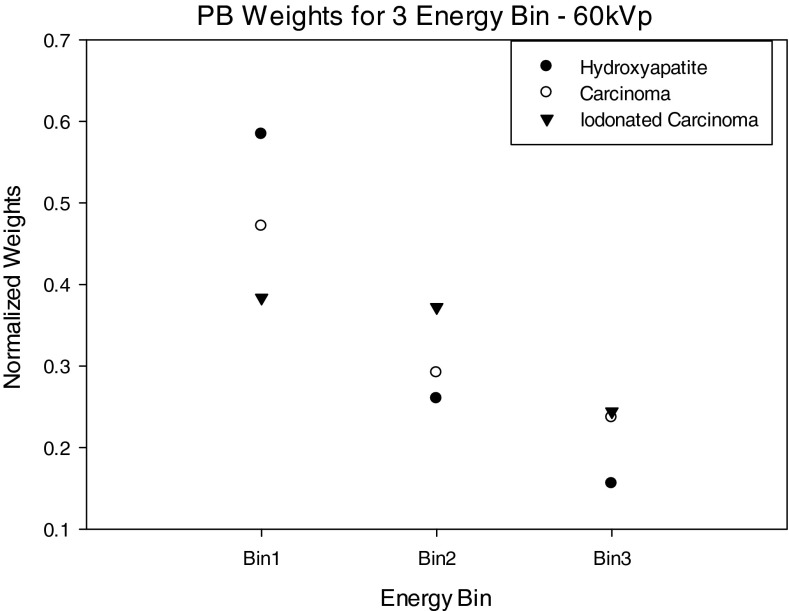
Figures 1011 show normalized projection-based weights for a 60 kVp spectra as calculated using Eq. 3 for 1 keV energy bins and three energy bins as defined in Tables 1, 2, 3. Normalized projection-based weights for other kVp settings were observed to have a similar trend (not shown).
Figure 10.
Normalized projection-based weights (1 keV energy bins) for the 60 kVp spectra.
Figure 11.
Normalized projection-based weights as a function of energy for three energy bins (given in Table 1) for the 60 kVp spectra.
Each graph shows weights for each of the three signal materials. For materials HA and IDC, the weights decrease with increasing energy, whereas the iodine signal demonstrates similar behavior except there is an increase in weight at the K-edge of iodine. In general, the PB weights follow a similar trend as the energy dependent linear attenuation coefficient of the material.
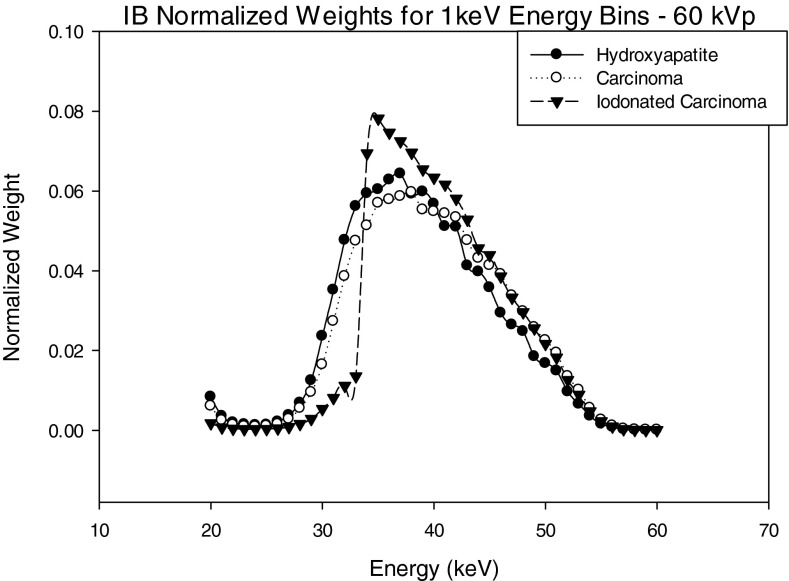
Figures 1213 show normalized image-based weights for a 60 kVp spectra for 1 keV energy bins and three energy bins as defined in Tables 1, 2, 3. A similar trend follows for both 1 keV and 3 energy bin window normalized image-based weights for 50, 70, 80 kVp. By observing Figs. 312, it can be seen the IB weights for the 1 keV bins have a similar dependence on energy to that of the input energy spectrum, suggesting that there is a strong correlation between x-ray fluence (i.e., noise) and IB weights.
Figure 12.
Normalized image-based weights (1 keV energy bins) for the 60 kVp spectra.
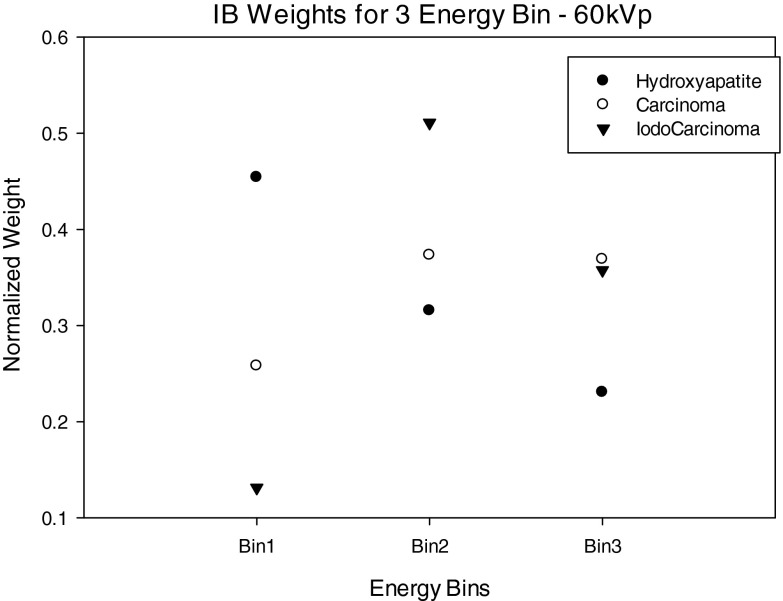
Figure 13.
Normalized image-based weights for three energy bins—60 kVp spectra.
Figure 13 shows the IB weights for the three energy bin case. For the weights of the IDC and iodinated contrast enhanced IDC signals, the middle energy bin has the highest weight, whereas for the HA signal, weights decrease with increasing energy bin. These trends can be explained by examining Eq. 5 that shows the weights are dependent on the ratio of signal contrast and noise in the image. Specifically, the HA weights have a different trend then the iodinated IDC and IDC signals because the contrast of HA is substantially higher than the IDC and iodinated IDC signals at lower energies. The weighting trends for HA and iodinated IDC signals are similar to those previously reported by Le et al.18
It is also interesting to note that PB and IB weights have different trends with energy. The primary reason for this is that IB weights are applied to reconstructions of log-normalized projection data, whereas PB weights are applied to non-normalized projection data. This normalizing procedure eliminates any inherent weighting due to photon fluence at each energy bin.
Profiles through reconstructed images
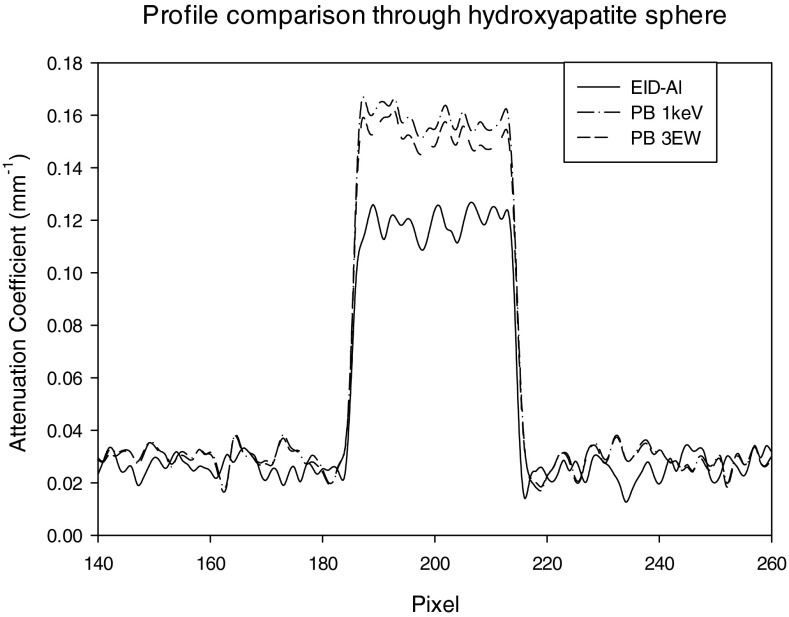
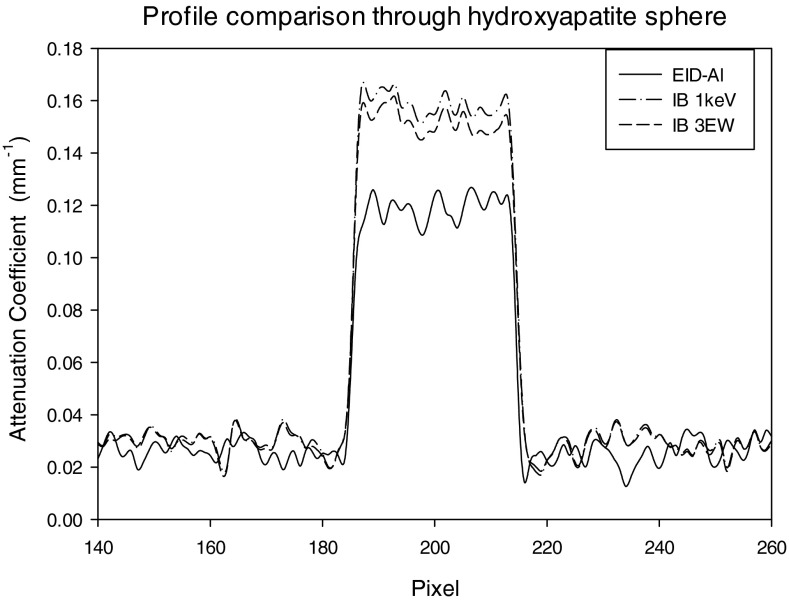
Figures 1415 show profiles through the center of the reconstructed HA sphere obtained with PB (Fig. 14) and IB (Fig. 15) weights. As compared to the reconstruction obtained with the energy integrating detector, the average reconstructed voxel value in the HA sphere obtained with energy weighting is higher by 32% with PB weighting and 50% with IB weighting.
Figure 14.
Profile through hydroxyapatite sphere for EID, PB 1 keV, and PB 3 EW.
Figure 15.
Profile through diameter of hydroxyapatite sphere for EID, IB 1 keV, and IB 3 EW.
SNR analysis
SNR with monoenergetic spectrum
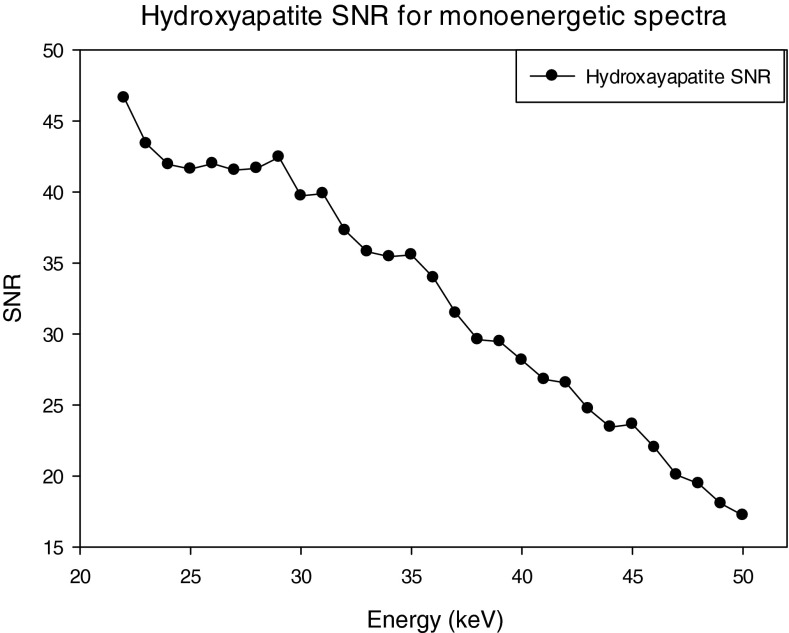
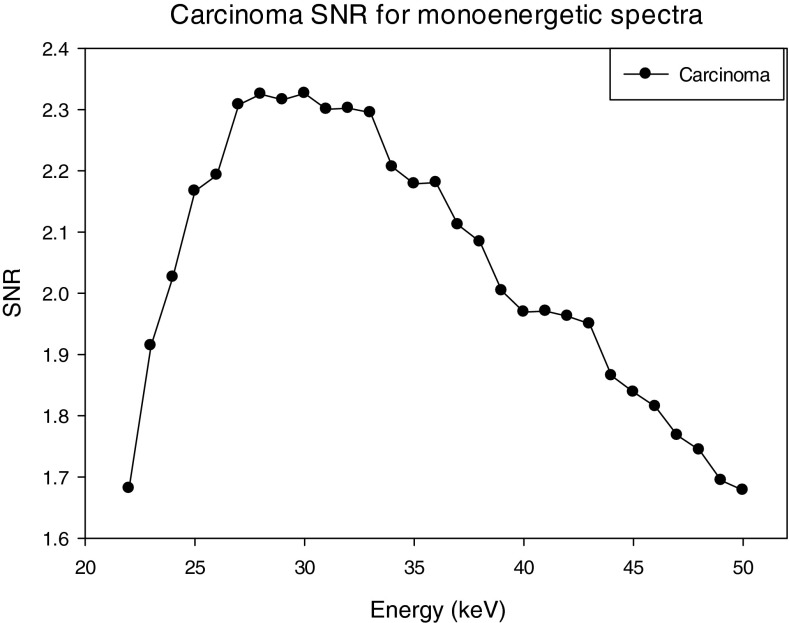
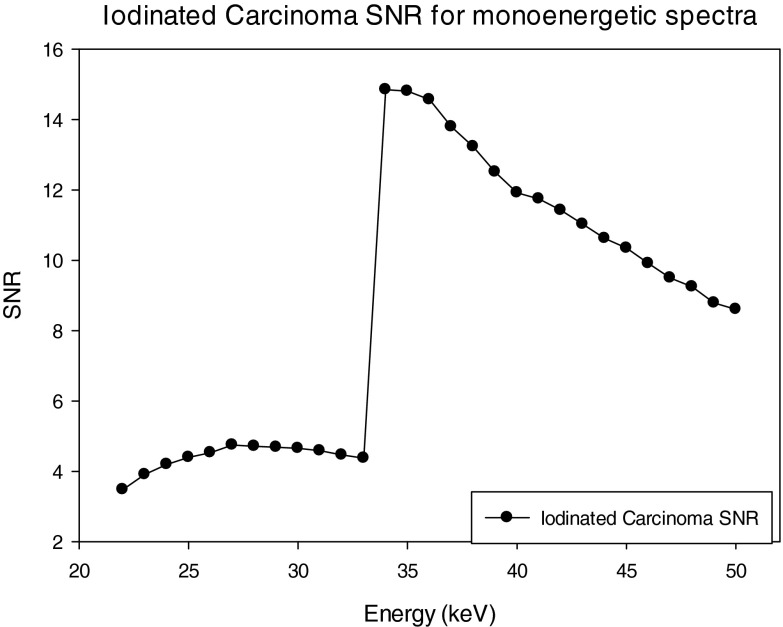
The SNRs for the three materials; HA, IDC, and iodinated contrast enhanced IDC using a monoenenergetic x-ray source are shown in Figs. 161718. For the case of HA, the maximum SNR occurs at 23 keV, whereas the maximum occurs at 31 and 34 keV for the IDC and IIDC signals, respectively. The IIDC signal shows a sharp increase in SNR at the K-edge of iodine. Although it is currently not feasible to perform routine clinical imaging with a monoenergetic x-ray source, these data do provide an upper bound on the maximum SNR that can be achieved with a polyenergetic x-ray source.
Figure 16.
SNR of the HA lesion using monoenergetic spectra.
Figure 17.
SNR of the carcinoma lesion using monoenergetic spectra.
Figure 18.
SNR of the iodinated carcinoma lesion using monoenergetic spectra.
HA and IDC lesions
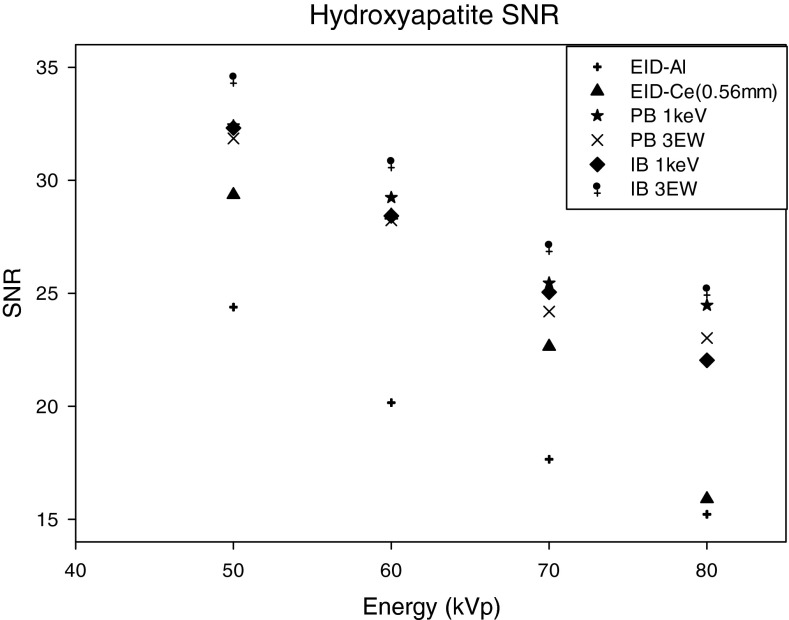
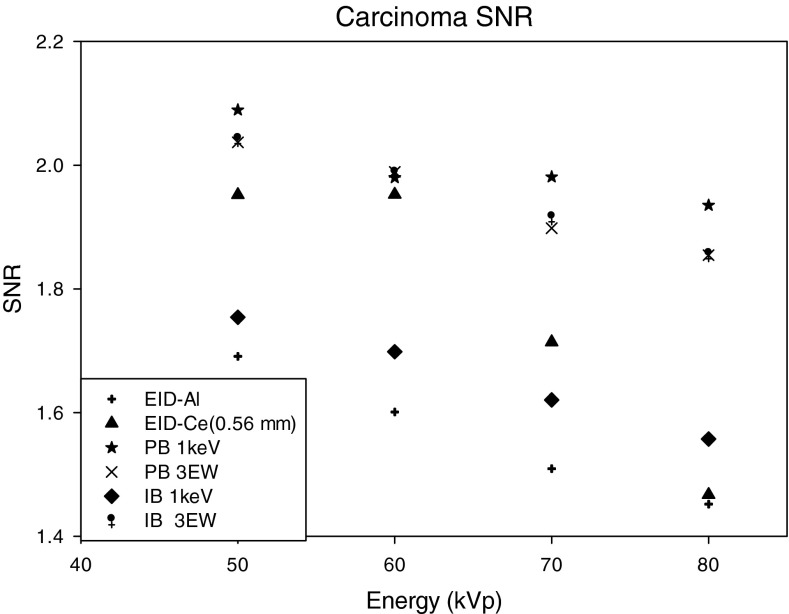
The SNR for the different methods tested, and for the three signal materials are shown in Figs. 192021. For HA and IDC signals (Figs. 1920), energy weighting gave higher SNR than that achieved with energy integrating detectors. For the HA lesion, the SNRs with energy weighting methods were approximately 30%–63% higher than that with an energy integrating detector using the Al filtered spectra. For the IDC signal, SNR improvement with energy weighting methods was 4%–34%. Use of the EID detector with Ce filtration (0.56 mm) improved the SNR by 2%–22% as compared to the EID detector with Al filtration (with the highest improvement of 22% occurring at 60 kVp). It was observed that for both HA and IDC signals, the highest SNR was achieved at 50 kVp for all cases, with a gradual decrease in SNR with increasing kVp setting. Among all the methods compared, the highest percentage improvement over energy integrating detectors occurred at 60 kVp, where improvements were 41%–50% and 6%–24% for HA and IDC lesions, respectively. It was observed that for both HA and IDC lesions and energy weighting using 1 keV energy bins, the PB weighting method provided higher SNR than the IB weighting method (PB1 keV > IB1 keV by 0.3%, 2.8%, 1.6%, and 9.9% for 50, 60, 70, and 80 kVp, respectively). However, this result was reversed when comparing weighting methods using three energy bins for the HA signal (PB3 EW < IB3 EW by 8.3%, 7.3%, 6.5%, 7.7% for 50, 60, 70, 80 kVp, respectively). For the HA signal, many pixels in energy bins less than 25 keV exhibited photon starvation, that is a very small number of x-rays were incident on many pixels for these low energies. Photon starvation was observed to penalize the SNR for the image-based weighting using 1 keV bins, and explains why better performance was observed with energy weighting using three energy bins as compared to 1 keV energy bins.
Figure 19.
SNR of the hydroxyapatite lesion as a function of the energy compared for: (1) EID-Al (EID with aluminum filtered spectra), (2) EID-Ce (EID with cerium filtered spectra), (3) projection-based weighting with 1 keV energy windows (PB 1 keV), (4) projection-based weighting with three energy windows (PB 3 EW), (5) image-based weighting with 1 keV energy windows (IB 1 keV), (6) image-based weighting with three energy windows (IB- 3 EW).
Figure 20.
SNR of the carcinoma lesion as a function of the energy compared for: (1) EID-Al (EID with aluminum filtered spectra), (2) EID-Ce (EID with cerium filtered spectra), (3) projection-based weighting with 1 keV energy windows (PB 1 keV), (4) projection-based weighting with three energy windows (PB 3 EW), (5) image-based weighting with 1 keV energy windows (IB 1 keV), (6) image-based weighting with three energy windows (IB- 3 EW).
Figure 21.
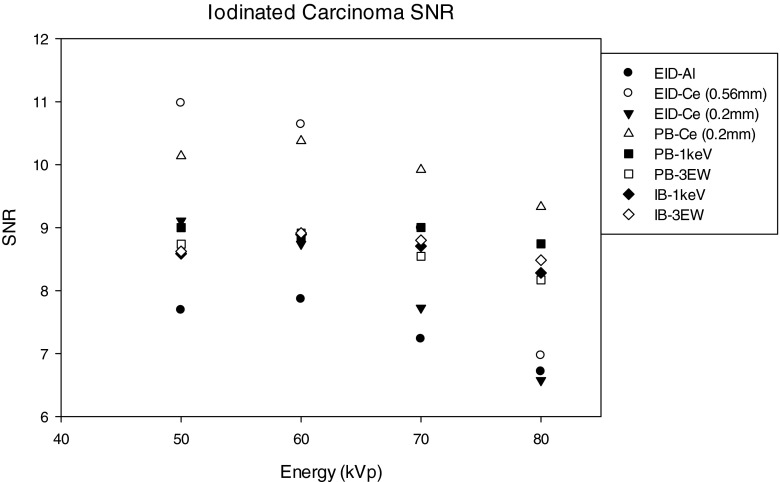
SNR of the iodinated carcinoma lesion as a function of the energy compared for: (1) EID-Al (EID with aluminum filtered spectra), (2) EID-Ce (EID with 0.56 mm cerium filtered spectra), (3) EID-Ce (EID with 0.2 mm cerium filtered spectra), (4) PB-Ce (projection-based weighting with 1 keV energy windows with 0.2 mm cerium filtered spectra), (5) projection-based weighting with 1 keV energy windows (PB 1 keV), (6) projection-based weighting with three energy windows (PB 3 EW), (7) image-based weighting with 1 keV energy windows (IB 1 keV), (8) image-based weighting with three energy windows (IB- 3 EW).
It was also observed that as kVp increases, the percentage improvement in SNR for the IDC lesion gradually increased. For example, at 50 kVp PB energy weighting with 1 keV bins provided an approximately 24% increase in SNR, whereas at 80 kVp PB energy weighting gave an approximately 34% increase in SNR. The improvement in SNR for the IDC signal for the energy integrating detector with 0.56 mm Cerium filtered spectrum was in the range of 4%–41%, the maximum occurring at 60 kVp.
Evaluation using iodine enhanced IDC lesion
Shown in Fig. 21 is a comparison of SNR for the iodine enhanced IDC lesion using 50–80 kVp tube voltage for eight cases. For the iodine enhanced IDC lesion, the energy integrating detector with 0.56 mm Ce filtered x-ray spectra provided the best performance at 50 and 60 kVp with approximately 25% improvement over energy weighting methods (with Al filtering) and 42%, and 35% higher than that with an energy integrating detector using the Al filtered spectra (at 50 and 60 kVp, respectively), however this advantage falls off at higher kVp settings. The reason for this increased performance can be explained by observing the Ce filtered x-ray spectra in Fig. 4, where the range of x-ray energy of the Ce filtered spectrum straddles the K-edge energy for iodine of 33.2 keV. As discussed below, use of 0.56 mm thick (100th VL) Ce to filter the x-ray beam would stress the heat loading capacity of the x-ray tube in most prototype breast CT systems. Use of 0.2 mm of Ce (10th VL) was also shown to improve performance when used with both energy integrating and photon counting detectors with energy weighting. For 50 and 60 kVp, projection-based weighting with the 0.2 Ce spectra provided the second highest performance (behind the EI detector with a 0.56 mm Ce filtered spectrum), and for 70 and 80 kVp this case provided the best performance.
From Fig. 18, it can be seen that the best performance for imaging the IIDC lesion would occur with a monoenergetic spectrum just above the K-edge of iodine (i.e., 33.2 keV) giving a SNR of approximately 15. Thus even the best performing case for the IIDC lesion, the EI detector with 0.56 Ce filtered spectra, gave performance that was 34% below that achieved with a hypothetical monoenergetic source.
The percentage improvement in SNR for the iodinated IDC signal was observed to increase with energy weighting for both Ce and Al filtration. It was observed that energy weighting methods with Al filtration provided approximately 12%–30% improvement, while energy weighting with Ce filtration provided 32%–38% improvement over use of an energy integrating detector with Al filtered x-ray spectra.
Observer performance study
Shown in Fig. 9 are noise-free [Fig. 9a] and noisy [Fig. 9b] reconstructed breast CT images from projection data simulated with an energy integrating detector. Shown in the inset are magnified regions containing the 5 × 5 grid positions where a microcalcification signal might be located, as well as the hash-marks (grid lines) used to indicate possible signal locations. Shown in Fig. 22 are three images of the noisy reconstructed slices with microcalcifications inserted in them. Magnified ROIs are shown on the bottom right side for each slice.
Figure 22.

Comparison of test images with the magnified ROI shown on the bottom. Shown here are noisy test images used in the observer study. The possible locations of the microcalcifications were indicated by the hash marks. (A magnified ROI indicating the possible locations of the microcalcifications is displayed to the bottom right side of these images).
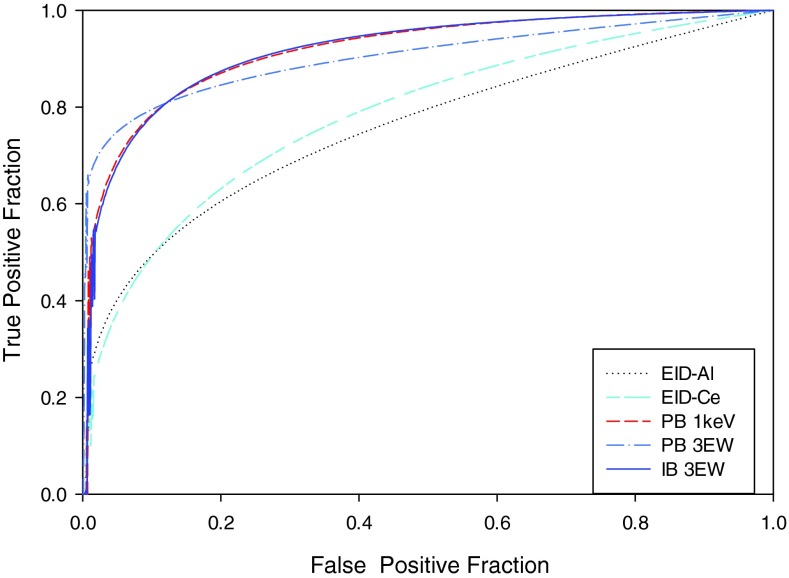
The average ROC curves for the three human observers for the five methods are shown in Fig. 23. The PB-1 keV and IB-3 EW ROC curves have the highest area followed by the PB-3 EW curve and the EID curves. The average AUC for the five methods and three users are compared in Table 4. The average AUCEID-Al, AUCEID-Ce, AUCPB-1 keV, AUCPB-3 EW, and AUCIB-3 EW are 0.732 (±0.051), 0.744 (±0.041), 0.878 (±0.03), 0.871 (±0.001), and 0.893(±0.013), respectively. Operating points on both the PB and IB ROC curves have higher TPF for a given FPF as compared to the EID-Al ROC curve. Compared to the AUCEID-Al, the percentage improvement of AUCEID-Ce, AUCPB-1 keV, AUCPB-3 EW, and AUCIB-3 EW were 1.70%, 19.94%, 19.02%, and 21.98%, respectively. The null hypothesis of the study was that all treatments (i.e., methods) studied were equal. The test for null hypothesis was rejected with an “F value” of 8.86 and a p value = 0.0000. Table 5 lists the treatment mean differences, p-values, significance, and 95% confidence intervals. The significance column displays whether the treatment differences are significant (i.e., yes if the p value is less than 0.05 and no if p value is greater than 0.05). Compared to the AUCEID-Al, the AUCPB-1 keV, AUCPB-3 EW, and AUCIB-3 EW were significantly better with a p-value of 0.002, 0.004, and 0.001, respectively (at a significance level of 0.05). Compared to the AUCEID-Ce, the AUCPB 1 keV, AUCPB 3 EW, and AUCIB 3 EW were significantly better with a p-value of 0.007, 0.0013, and 0.002, respectively. The DBM analysis38 suggests that the AUCEID-Al and AUCEID-Ce are not significantly different. Similarly, the AUCPCD (photon counting detector methods) are not significantly different within the different weighting methods tested in the study.
Figure 23.
Comparison of average ROC curves for the three human observers for: (1) EID-Al (EID with aluminum filtered spectra), (2). EID-Ce (EID with 0.56 mm cerium filtered spectra), (3) projection-based weighting with 1 keV energy windows (PB 1 keV), (4) projection-based weighting with three energy windows (PB 3 EW), (5) image-based weighting with three energy windows (IB- 3 EW).
Table 4.
Average AUC for the three observers and five imaging methods.
| Observer | EID-Al | EID-Ce | PB-1 keV | PB 3 EW | IB 3 EW |
|---|---|---|---|---|---|
| 1 | 0.675 | 0.754 | 0.880 | 0.871 | 0.887 |
| 2 | 0.774 | 0.780 | 0.876 | 0.873 | 0.908 |
| 3 | 0.747 | 0.700 | 0.878 | 0.870 | 0.884 |
| Average AUC | 0.732 | 0.744 | 0.878 | 0.871 | 0.893 |
| Std. deviation | ±0.04 | ±0.03 | ±0.03 | ±0.001 | ±0.013 |
Table 5.
Confidence intervals for treatment mean differences where treatments 1–5 correspond to: EID-Al, EID-Ce, PB 1 keV, PB 3 EW, IB 3 EW, respectively, df: degrees of freedom, t: T-test statistic, S: Significant, NS: Not significant, CI: confidence interval.
| Treatment | Treatment mean difference | Std. err. | df | t | Pr > t | Significance | 95% CI |
|---|---|---|---|---|---|---|---|
| 1–2 | −0.0125 | 0.03732 | 56.29 | −0.33 | 0.7395 | NS | −0.087,0.062 |
| 1–3 | −0.146 | 0.03732 | 56.29 | −3.91 | 0.0002 | S | −0.221,−0.071 |
| 1–4 | −0.1392 | 0.03732 | 56.29 | −3.73 | 0.0004 | S | −0.214,−0.064 |
| 1–5 | −0.1609 | 0.03732 | 56.29 | −4.31 | 0.0001 | S | −0.236,−0.086 |
| 2–3 | −0.1335 | 0.03732 | 56.29 | −3.58 | 0.0007 | S | −0.208,−0.059 |
| 2–4 | −0.1268 | 0.03732 | 56.29 | −3.4 | 0.0013 | S | −0.202,−0.052 |
| 2–5 | −0.1484 | 0.03732 | 56.29 | −3.98 | 0.0002 | S | −0.223,−0.074 |
| 3–4 | 0.0068 | 0.03732 | 56.29 | 0.18 | 0.857 | NS | −0.068,0.082 |
| 3–5 | −0.0149 | 0.03732 | 56.29 | −0.4 | 0.691 | NS | −0.090,0.060 |
| 4–5 | −0.0217 | 0.03732 | 56.29 | −0.58 | 0.5639 | NS | −0.096,0.053 |
DISCUSSIONS AND CONCLUSIONS
Several experimental dedicated breast CT systems have been developed and are currently undergoing clinical testing. These systems have great potential for improving the visualization of masses and microcalcifications without the overlapping structure that sometimes limits mammography. Most of the current prototype BCT systems use energy integrating detector technology. These detectors inherently weight each x-ray in proportion to its’ energy. Unfortunately, this inherent weighting scheme is contrary to the information content in the recorded image, primarily because breast lesion contrast decreases with increased energy.
As can be observed by comparing monoenergetic SNR results of Figs. 161718 to SNR achieved with polyenergetic spectra (Figs. 192021), imaging with a monoenergetic x-ray source provides a theoretical upper limit for each lesion material type. Unfortunately, all clinical x-ray sources produce a polyenergetic spectra, thus the achievable SNR is somewhat lower than the ideal SNR obtained with a monoenergetic source. One technique for approaching this ideal SNR with a polyenergetic source is the use of energy weighting which becomes feasible with use of a photon counting detector.
Photon counting detectors using room temperature semiconductor material, such as CdTe or CZT, are currently being developed for BCT (Refs. 8, 18, 21) and hold great promise for improving image quality. Tapiovaara and Wagner,15 as well as others have shown that energy weighting of projection data measured with a polyenergetic source can improve lesion SNR. In this study, we have further evaluated energy weighting as it applies specifically to BCT systems.
Using computer simulation, two weighting schemes; projection based and image based, were evaluated and compared to performance achieved with an energy integrating detector. Three different materials, HA, IDC, and IIDC were used to model lesions represented as spheres in a uniform background. A tungsten anode x-ray source was modeled with three different filtration materials; 0.9 mm of Al, 0.2 mm of Ce, and 0.56 mm of Ce. In general, it was observed that energy weighting provides improved SNR over an energy integrating detector. Improvement was greatest for HA (30%–63%), whereas improvement for the IDC signal was 4%–34% and for the IIDC signal was 12%–30% with Al filtration and 32%–38% with Ce filtration, respectively.
Photon counting detectors typically use a number of comparators with user controlled threshold voltages, thus providing the capability of collecting image data in different energy bins. Figures 192021 show the improvement in SNR that can be achieved with PB energy weighting using different energy binning, including the use of 1 keV bins, as well as three energy bins as defined in Table 1. From these data, it appears as if there is little penalty in using three energy bins as compared to using very fine 1 keV energy bins. This is an encouraging finding in that due to space considerations on the application specific integrated circuit (ASIC), the number of energy bins is usually limited.
Previous reports have also used simulation studies to report improved performance with breast CT when using energy weighting and photon counting detectors.16, 18, 40 Table 6 summarizes the improvement in SNR as compared to energy integrating detectors as reported by different authors. Generally, good agreement with previously published data is observed, however, it is somewhat difficult to compare quantitative results herein with previous studies, because there are a number of differences between the studies. First, lower kVp settings of 50–80 kVp were used here, whereas previous studies used greater than 90 kVp. This decision was based on a number of reports that have demonstrated that optimal kVp settings for breast CT are 50–60 kVp.9, 23, 41 In fact, as observed from Figs. 192021, the 50 kVp setting gave the best performance for photon counting detectors with energy weighting. Another difference is in the detector modeling. In this study, the gain mechanisms and electronic noise in the energy integrating CsI detector were modeled, and the quantum efficiency was modeled in the photon counting CZT detector (these detectors typically have negligible electronic noise), whereas previous studies did not model these factors. Another difference from previous studies was the radiation dose to the breast. Schmidt modeled a 4 mGy MGD, approximately equivalent to the dose for two-view screening mammography. The study here modeled a 10 mGy MGD to approximate the dose given for a typical diagnostic mammographic workup. Other differences between studies include variations in the phantom size, chemical composition of microcalcifications, and iodine concentration (Le: 8 mg/ml, Schmidt: 2.5 mg/ml).
Table 6.
SNR improvement obtained using energy weighting compared to the energy integrating detectors (reported in previous studies) for CaCO3 and Iodine contrast agent.
| CaCO31 |
Iodine |
|||
|---|---|---|---|---|
| Projection weighting | Image weighting | Projection weighting | Image weighting | |
| Shikhaliev (Ref. 40) | 1.35 | … | 1.33 | … |
| Le et al. (Ref. 18) | 1.57 | 1.29 | 1.55 | 1.28 |
| Schmidt (Ref. 16) | 1.33 | 1.31 | 1.31 | 1.27 |
| This paper | 1.31 | 1.41 | 1.17 w/Al 0.9 mm 1.32 w/Ce 0.2 mm | 1.15 |
In this study (this paper), Hydroxyapatite was used to model microcalcifications.
Previous studies have shown that use of certain x-ray filters (including Ce) with BCT can provide quasimonochromatic spectra with improved performance as compared to x-ray filtration with Al.9, 22, 24, 25, 26 In this study, simulations using two different thicknesses of Ce were evaluated, 0.2 mm (10th VL), and 0.56 mm (100th VL). The 10th VL thickness was selected to represent the approximate maximum thickness of Ce that can be used in current breast CT prototypes without excessive heating of the x-ray tube, whereas the 100th VL thickness was chosen to represent an extreme case that could only be implemented with a high-powered x-ray tube produced for CT.
Results from this study using both the 0.2 and 0.56 mm thick Ce filtered x-ray source confirm that improved performance of breast CT can be achieved with these filters. In fact, for the iodine enhanced lesion IIDC material, the energy integrating detector with a 0.56 mm Ce filtered 50 or 60 kVp spectra, outperformed photon counting detectors using energy weighting methods with Al filtered x-ray spectra. Performance was reduced but still higher when a thinner but more practical 0.2 mm Ce filter was used with the energy integrating detector. Use of the 0.2 mm Ce filter was also beneficial for imaging the iodine lesion when used with the photon counting detector and projection based energy weighting providing the second highest SNR (with the best performance achieved using the 0.56 mm Ce filtered spectra with the energy integrating detector).
Although in theory, Ce filtered spectra can provide good SNR performance, there might be practical limitations of using Ce filtration. For one, Ce is hygroscopic, oxidative, and flammable and hence must be sealed. Modifying the physical geometry of the filter, i.e., packaging of the Ce filter between more stable and nonreactive materials is thus required.
In order to achieve a suitable x-ray fluence for breast CT when using the 100th VL thickness, tube current must be increased substantially, thereby stressing x-ray tube heat loading limits. However, these limitations may be overcome by using Ce with a 10th VL thickness. The percentage reduction in the SNR by choosing a 10th VL thickness of Ce as opposed to a 100th VL thickness was approximately 14%.
This study as well as previous studies have shown that energy weighting provides improved SNR performance for HA microcalcifications. However, the SNR figure-of-merit might not necessarily correlate with human observer performance for detecting microcalcifications in breast tissue. To further study performance in detecting microcalcifications with energy weighting, an objective assessment of observer performance was conducted using ROC analysis. For this observer performance study, realistic simulated reconstructions were generated using 240 μm HA spheres embedded into an anthropomorphic 3D voxelized breast phantom generated from a surgical mastectomy tissue specimen. It was observed that the area under the ROC curve (AUC) for the both the PB and IB energy weighting methods were significantly higher than that achieved with the energy integrating detector using either the Al or Ce filtration. It was also observed that there was no statistical difference in performance with energy weighting using 1 keV bins compared to using three energy bins. Furthermore, there was also no statistical difference in performance between PB and IB energy weighting methods. This finding could be clinically significant because one of the first studies reported using an experimental breast CT system suggested that visualization of microcalcifications in breast CT is inferior to that of mammography.11 Visualizing microcalcifications in x-ray breast imaging systems is important for the detection of ductal carcinoma in situ (DCIS). It has been estimated that DCIS represents 20%–30% of all breast cancer detected in a screening program.1 Since at least 30%–50% of all DCIS eventually becomes invasive if not treated,1 early detection and diagnosis of DCIS probably contributes to a decreased breast cancer mortality rate. Thus to compete with conventional mammography, it is important that radiologists are able to accurately detect and diagnose microcalcifications on BCT imaging devices.
Although this study suggests that energy weighting with photon counting detectors can provide improved performance in comparison to that achieved with energy integrating detectors, the results should be taken with caution in that there were a number of limitations in this study. In order to provide a fair comparison, blurring produced by emission secondary quanta within the detector was not modeled for either the CsI based or the CZT based detector. In particular, neither the spreading of optical photons in CsI with the energy integrating detector, or the blurring due to characteristics x-rays or charge sharing in the CZT detector were modeled. Furthermore, the CZT detector was assumed to have ideal energy resolution, and degradations due to count-rate limitations, such as pulse pileup and polarization, were not modeled. The inclusion of these additional physical factors in the simulation will be the subject of future work.
Although the ROC study performed here provided an objective assessment of microcalcification detection, the simulated detection task could be made more realistic by using realistic microcalcification clusters rather than single spherical models. One interesting recent study that could help in this effort is the development of 3D microcalcification cluster models generated by imaging breast biopsy specimens with micro-CT.42 Although simulation studies are useful in predicting performance with energy weighting, ultimately observer performance studies using patient images acquired on photon counting breast CT systems will be needed to fully assess clinical significance.
ACKNOWLEDGMENTS
This research was supported in part by the National Institute of Health (NIH) under Grant No. RO1 CA140400 from the National Cancer Institute, CA, and a research grant from the Toshiba Medical Research Institute.
References
- Kopans D. B., Breast Imaging, 3rd ed. (Lippincott Williams and Wilkins, Philadelphia, PA, 2006). [Google Scholar]
- American Cancer Society, Breast Cancer Facts and Figures 2011–2012 (American Cancer Society, Inc., Atlanta, 2011). [Google Scholar]
- Boone J. M., “Breast CT: Its prospect for breast cancer screening and diagnosis,” in RSNA Categorical Courses in Diagnostic Physics: Advances in Breast Imaging - Physics, Technology, and Clinical Applications, edited by Karellas A. and Giger M. L. (RSNA, Chicago, IL, 2004), pp. 165–177. [Google Scholar]
- Boone J. M., Nelson T. R., Lindfors K. K., and Seibert J. A., “Dedicated breast CT: Radiation dose and image quality evaluation,” Radiology 221, 657–667 (2001). 10.1148/radiol.2213010334 [DOI] [PubMed] [Google Scholar]
- Glick S. J., “Breast CT,” Annu. Rev. Biomed. Eng. 9, 501–526 (2007). 10.1146/annurev.bioeng.9.060906.151924 [DOI] [PubMed] [Google Scholar]
- O’Connor J. M., Glick S. J., Gong X., Didier C. S., and Mah'd M., “Characterization of a prototype table-top x-ray CT breast imaging system,” Proc. SPIE 6510, 65102T (2007). 10.1117/12.713751 [DOI] [Google Scholar]
- Ning R., Conover D., Yu Y., Zhang Y., Cai W., Betancourt-Benitez R., and Lu X., “A novel cone beam breast CT scanner: System evaluation,” Proc. SPIE 6510, 651030–651039 (2007). 10.1117/12.710340 [DOI] [Google Scholar]
- Kalender W. A., Beister M., Boone J. M., Kolditz D., Vollmar S. V., and Weigel M. C., “High-resolution spiral CT of the breast at very low dose: Concept and feasibility considerations,” Eur. Radiol. 22, 1–8 (2012). 10.1007/s00330-011-2169-4 [DOI] [PubMed] [Google Scholar]
- Tornai M. P., McKinley R. L., Bryzmialkiewicz C. N., Madhav P., Cutler S. J., Crotty D. J., Bowsher J. E., Samei E., and C. E.FloydJr., “Design and development of a fully-3D dedicated x-ray computed mammotomography system,” Proc. SPIE 5745, 189–197 (2005). 10.1117/12.595636 [DOI] [Google Scholar]
- Shaw C., Chen L., Altunbas M., Tu S., Wang T. P., Lai C. J., Cheenu Kappadath S., Meng Y., and Liu X., “Cone beam breast CT with a flat panel detector–Simulation, implementation and demonstration,” Conf. Proc. IEEE Eng. Med. Biol. Soc. 4, 4461–4464 (2005). 10.1109/IEMBS.2005.1615457 [DOI] [PubMed] [Google Scholar]
- Lindfors K. K., Boone J. M., Nelson T. R., Yang K., Kwan A. L., and Miller D. F., “Dedicated breast CT: Initial clinical experience,” Radiology 246, 725–733 (2008). 10.1148/radiol.2463070410 [DOI] [PMC free article] [PubMed] [Google Scholar]
- O’Connell A., Conover D. L., Zhang Y., Seifert P., Logan-Young W., Lin C. F., Sahler L., and Ning R., “Cone-beam CT for breast imaging: Radiation dose, breast coverage, and image quality,” AJR, Am. J. Roentgenol. 195, 496–509 (2010). 10.2214/AJR.08.1017 [DOI] [PubMed] [Google Scholar]
- Lindfors K. K., Paper Presented at the RSNA – New Directions in Breast Imaging: Where Are We Headed?, Chicago, IL, 2006. (unpublished).
- Swank R. K., “Absorption and noise in x-ray phosphors,” J. Appl. Phys. 44, 4199–4203 (1973). 10.1063/1.1662918 [DOI] [Google Scholar]
- Tapiovaara M. J. and Wagner R. F., “Snr and Dqe analysis of broad-spectrum x-ray-imaging,” Phys. Med. Biol. 30, 519–529 (1985). 10.1088/0031-9155/30/6/002 [DOI] [Google Scholar]
- Schmidt T. G., “Optimal “image-based” weighting for energy-resolved CT,” Med. Phys. 36, 3018–3027 (2009). 10.1118/1.3148535 [DOI] [PubMed] [Google Scholar]
- Cahn R. N., Cederstrom B., Danielsson M., Hall A., Lundqvist M., and Nygren D., “Detective quantum efficiency dependence on x-ray energy weighting in mammography,” Med. Phys. 26, 2680–2683 (1999). 10.1118/1.598807 [DOI] [PubMed] [Google Scholar]
- Le H. Q., Ducote J. L., and Molloi S., “Radiation dose reduction using a CdZnTe-based computed tomography system: Comparison to flat-panel detectors,” Med. Phys. 37, 1225–1236 (2010). 10.1118/1.3312435 [DOI] [PMC free article] [PubMed] [Google Scholar]
- Shikhaliev P. M., “Beam hardening artefacts in computed tomography with photon counting, charge integrating and energy weighting detectors: A simulation study,” Phys. Med. Biol. 50, 5813–5827 (2005). 10.1088/0031-9155/50/24/004 [DOI] [PubMed] [Google Scholar]
- Niederlohner D., Karg J., Giersch J., Firsching M., and Anton G., “Practical aspects of energy weighting in x-ray imaging,” Nuclear Science Symposium Conference Record (IEEE, New York, 2004), Vol. 5, pp. 3191–3194. 10.1109/NSSMIC.2004.1466359 [DOI]
- Shikhaliev P. M., “Breast CT with energy resolved detection,” Med. Phys. 34, 2607 (2007). 10.1118/1.2761582 [DOI] [Google Scholar]
- Glick S. J., Thacker S., Gong X., and Liu B., “Evaluating the impact of x-ray spectral shape on image quality in flat-panel CT breast imaging,” Med. Phys. 34, 5–24 (2007). 10.1118/1.2388574 [DOI] [PubMed] [Google Scholar]
- Weigel M., Vollmar S. V., and Kalender W. A., “Spectral optimization for dedicated breast CT,” Med. Phys. 38, 114–124 (2011). 10.1118/1.3523599 [DOI] [PubMed] [Google Scholar]
- McKinley R. L., Tornai M. P., Samei E., and Bradshaw M. L., “Simulation study of a quasi-monochromatic beam for x-ray computed mammotomography,” Med. Phys. 31, 800–813 (2004). 10.1118/1.1668371 [DOI] [PubMed] [Google Scholar]
- Crotty D. J., McKinley R. L., and Tornai M. P., “Experimental spectral measurements of heavy K-edge filtered beams for x-ray computed mammotomography,” Phys. Med. Biol. 52, 603–616 (2007). 10.1088/0031-9155/52/3/005 [DOI] [PMC free article] [PubMed] [Google Scholar]
- McKinley R. L., Tornai M. P., Samei E., and Bradshaw M. L., “Initial study of quasi-monochromatic x-ray beam performance for x-ray computed mammotomography,” IEEE Trans. Nucl. Sci. 52, 1243–1250 (2005). 10.1109/TNS.2005.857629 [DOI] [Google Scholar]
- Feldkamp L. A., Davis L. C., and Kress J. W., “Practical cone-beam algorithm,” J. Opt. Soc. Am. A 1, 612–619 (1984). 10.1364/JOSAA.1.000612 [DOI] [Google Scholar]
- Vedula A. A., Glick S. J., and Gong X., “Computer simulation of CT mammography using a flat-panel imager,” Proc. SPIE 5030, 349–360 (2003). 10.1117/12.480015 [DOI] [Google Scholar]
- Boone J. M. and Seibert J. A., “An accurate method for computer-generating tungsten anode x-ray spectra from 30 to 140 kV,” Med. Phys. 24, 1661–1670 (1997). 10.1118/1.597953 [DOI] [PubMed] [Google Scholar]
- Thacker S. C. and Glick S. J., “Normalized glandular dose (DgN) coefficients for flat-panel CT breast imaging,” Phys. Med. Biol. 49, 5433–5444 (2004). 10.1088/0031-9155/49/24/003 [DOI] [PubMed] [Google Scholar]
- Yaffe M. J., Boone J. M., Packard N., Alonzo-Proulx O., Huang S. Y., Peressotti C. L., Al-Mayah A., and Brock K., “The myth of the 50-50 breast,” Med. Phys. 36, 5437–5443 (2009). 10.1118/1.3250863 [DOI] [PMC free article] [PubMed] [Google Scholar]
- Johns P. C. and Yaffe M. J., “X-ray characterisation of normal and neoplastic breast tissues,” Phys. Med. Biol. 32, 675–695 (1987). 10.1088/0031-9155/32/6/002 [DOI] [PubMed] [Google Scholar]
- Carton A.-K., Flynn M. J., Li J., Albert M., Chen S., Maidment A. D. A., and Hsieh J., “Quantification for contrast-enhanced digital breast tomosynthesis,” Proc. SPIE 6142, 61420D (2006). 10.1117/12.654682 [DOI] [Google Scholar]
- O’Connor J. M., Das M., Dider C. S., Mahd M., and Glick S. J., “Generation of voxelized breast phantoms from surgical mastectomy specimens,” Med. Phys. 40, 041915 (12pp.) (2013). 10.1118/1.4795758 [DOI] [PMC free article] [PubMed] [Google Scholar]
- Siddon R. L., “Fast calculation of the exact radiological path for a three-dimensional CT array,” Med. Phys. 12, 252–255 (1985). 10.1118/1.595715 [DOI] [PubMed] [Google Scholar]
- Barrett H. H. and Myers K. J., Foundations of Image Science (Wiley, New York, 2003). [Google Scholar]
- Shikhaliev P. M., “The upper limits of the SNR in radiography and CT with polyenergetic x-rays,” Phys. Med. Biol. 55, 5317–5339 (2010). 10.1088/0031-9155/55/18/005 [DOI] [PubMed] [Google Scholar]
- Metz C., Berbaum K., and Dorfman D., dbm mrmc (available URL: http://perception.radiology.uiowa.edu/Software/ReceiverOperatingCharacteristicROC/DBMMRMC/tabid/116/Default.aspx).
- Dorfman D. D., Berbaum K. S., and Metz C. E., “Receiver operating characteristic rating analysis. Generalization to the population of readers and patients with the jackknife method,” Invest. Radiol. 27, 723–731 (1992). 10.1097/00004424-199209000-00015 [DOI] [PubMed] [Google Scholar]
- Shikhaliev P. M., “Computed tomography with energy-resolved detection: A feasibility study,” Phys. Med. Biol. 53, 1475–1495 (2008). 10.1088/0031-9155/53/5/020 [DOI] [PubMed] [Google Scholar]
- Glick S. J., Vedantham S., and Karellas A., “Investigation of optimal kVp settings for CT mammography using a flat-panel imager,” Proc. SPIE 4682, 392–402 (2002). 10.1117/12.465581 [DOI] [Google Scholar]
- Shaheen E., Van Ongeval C., Zanca F., Cockmartin L., Marshall N., Jacobs J., Young K. C., Dance D. R., and Bosmans H., “The simulation of 3D microcalcification clusters in 2D digital mammography and breast tomosynthesis,” Med. Phys. 38, 6659–6671 (2011). 10.1118/1.3662868 [DOI] [PubMed] [Google Scholar]


