Abstract
Temporal variation in listeners' sensitivity to interaural time and level differences (ITD and ILD) was assessed using the temporal weighting function (TWF) paradigm [Stecker and Hafter (2002). J. Acoust. Soc. Am. 112, 1046–1057] in the context of sound-source lateralization. Brief Gabor click trains were presented over headphones with overall ITD and/or ILD ranging ±500 μs ITD and/or ±5 dB ILD across trials; values for individual clicks within each train varied by an additional ±100 μs or ±2 dB to allow TWF calculation by multiple regression. In separate conditions, TWFs were measured for (i) ITD alone, (ii) ILD alone, (iii) ITD and ILD covarying (“in agreement”), and (iv) ITD and ILD varying independently across clicks. Consistent with past studies that measured TWF for binaural discrimination, TWFs demonstrated high weight on the first click for stimuli with short interclick interval (ICI = 2 ms), but flatter weighting for longer ICI (5–10 ms). Some conditions additionally demonstrated greater weight for clicks near the offset than near the middle of the train [Stecker and Hafter (2009). J. Acoust. Soc. Am. 125, 3914–3924]. The latter result was observed only when stimuli carried ILD, and appeared more reliably for 5 ms than for 2 or 10 ms ICI.
INTRODUCTION
To accurately localize sound sources, listeners must be sensitive to a variety of auditory spatial cues [including interaural time differences (ITD) and interaural level differences (ILD)] and capable of integrating spatial information across those cues and over the duration of a sound. For example, binaural discrimination of simple sounds with static cues improves with increasing duration. For an ideal listener with equal access to information carried in the beginning, middle, and end of a sound, the improvement can be understood statistically as a consequence of integrating multiple independent and equally weighted samples of the binaural information. However, an accumulating body of evidence suggests that real listeners do not weight the binaural cues carried in different temporal portions of a brief sound equally; instead, temporal weighting of binaural information varies over a sound's duration. Evidence of this uneven weighting includes sub-optimal improvement in binaural discrimination with stimulus duration (Tobias and Zerlin, 1959; Houtgast and Plomp, 1968; Yost et al., 1971; McFadden and Sharpley, 1972; Ricard and Hafter, 1973; Nuetzel and Hafter, 1976; McFadden and Moffitt, 1977; Hafter and Dye, 1983) and non-uniform temporal weighting functions (TWFs) for binaural discrimination (Hafter and Buell, 1990; Saberi, 1996; Brown and Stecker, 2010). Overall, those studies suggest greater sensitivity to binaural cues carried by sound onsets than by later segments. For modulated high-frequency sounds, such as filtered click trains (Hafter and Dye, 1983), the degree of this “onset dominance” is greatest for high modulation rates or short interclick intervals (ICI). Somewhat in contrast to the results of headphone studies cited above, Stecker and Hafter (2002) found that TWFs for sounds presented over loudspeakers in the free field emphasized both sound onsets and offsets. Stecker and Hafter (2009) demonstrated the offset effect (termed “upweighting”) to be a monotonic increase in weights toward the end of the train (i.e., the effects were not confined to the offset click) consistent with “leaky” temporal integration of auditory spatial cues (cf. Tobias and Zerlin, 1959).
It remains unclear which situations give rise to upweighting of late-arriving sound. Because the effect was observed in a task that required listeners to point to free-field sounds varying in azimuth (Stecker and Hafter, 2002) and elevation (Macpherson and Wagner, 2008), but not for a task involving ITD discrimination (Saberi, 1996), Stecker and Hafter (2009) suggested two alternative hypotheses: that the effect might be limited, first, to the processing of non-ITD cues available in the free field or, second, to “open-loop” judgments of sound location, as in a pointing task.1 With respect to the first hypothesis, Brown and Stecker (2010) found generally weaker onset dominance for ILD than ITD “discrimination,” but no evidence of upweighting for either cue, suggesting that the difference in cues does not, by itself, explain the difference in results. The current study addresses the second hypothesis: that upweighting manifests primarily in open-loop judgments of sound-source locations, as a consequence of the different memory demands, spatial representations, or stimulus configurations involved in localization vs discrimination tasks. Here, TWFs are measured for open-loop lateralization, a task similar to the pointing task of Stecker and Hafter (2002), but for sounds carrying ITD and/or ILD presented over headphones.
EXPERIMENT 1: INTERAURAL TIME AND LEVEL IN AGREEMENT
Stecker and Hafter (2002) asked listeners to localize filtered click trains presented in the free field. In their experiment, individual clicks within each train were randomly distributed across a group of loudspeakers spanning 11°–22° azimuth. TWFs, computed by regressing listeners' localization judgments onto the individual-click locations, revealed both ICI-dependent onset dominance and upweighting of late-arriving clicks. Experiment 1 of the current study aimed to replicate Stecker and Hafter's (2002) experiment under headphones. Specifically, sounds were presented with ITD and ILD varying in a correlated manner and over a range of values similar to those experienced by listeners in the free field.
The pointing technique of Stecker and Hafter (2002) involved orienting to sounds in egocentric space, as did that of Macpherson and Wagner (2008). Stecker and Hafter (2009) identified two aspects of such tasks that could be relevant to upweighting. First, open-loop tasks require that spatial locations be stored and maintained in memory prior to the response. Second, orientation tasks require the generation of an explicitly spatial response in an egocentric reference frame mapped to that of the stimulus. Here, two different open-loop lateralization tasks were tested: head-turning, which necessarily involved explicit orientation in egocentric space (as in the free-field task), and visual scaling via touchscreen response, which did not.
Methods
All procedures, including recruitment, consenting, and testing of human subjects followed the guidelines of the University of Washington Human Subjects Division and were reviewed and approved by the cognizant Institutional Review Board.
Subjects
Nine subjects (five female) participated in this experiment. One was the second author and another was a research assistant employed in the lab; the remainder were paid subjects naive to the purpose of the experiment. All subjects reported normal hearing and demonstrated pure-tone detection thresholds <15 dB hearing level (HL) at octave frequencies spanning 250–8000 Hz.
Stimuli
Stimuli were trains of Gabor clicks (Gaussian-windowed tone bursts). Each click consisted of a 4 kHz cosine multiplied by a Gaussian temporal envelope with σ = 221 μs, truncated at a total duration of 2 ms. The resulting spectral bandwidth was also Gaussian, with σ = 750 Hz (half-maximal bandwidth ≈ 1.8 kHz). Trains of 16 clicks were synthesized at 48.828 kHz (Tucker-Davis Technologies RX6, Alachua, FL) and presented via headphones (Sennheiser HD 485, Hannover, Germany) at 70 dB peak-equivalent sound pressure level (approximately 65–74 dBA, depending on condition). Click trains were presented with a peak-to-peak ICI equal to 2, 5, or 10 ms. Thus, the total stimulus duration was 32, 77, or 152 ms. ITD and ILD were applied to the stimuli as follows: on each trial, a “base” ITD value was selected from the set {−500, −300, −100, +100, +300, +500 μs}. The base ILD on each trial was set to be in accordance with the base ITD using a trading ratio of 100 μs/dB (e.g., +3 dB for a +300 μs ITD), roughly corresponding to the average trading ratio observed experimentally for such stimuli (Stecker, 2010). Individual clicks within each train were presented at the base ITD and base ILD, plus an additional random perturbation drawn from a uniform distribution spanning ±100 μs and ±2 dB. Perturbations were independent across clicks in a train, but perfectly correlated between ITD and ILD.
Procedure
Testing took place in a double-walled sound-attenuating chamber (IAC, Bronx, NY). Subjects were seated in a swivel chair facing a 80-cm (diagonal) touch-sensitive display (elo Touchsystems 3200L, Tyco Electronics, Bermuda) at a distance of 50 cm. The position and orientation of the listener's head was monitored using an electromagnetic position-tracking system (Polhemus Fastrak, Colchester, VT). The system's transmit coil was affixed to the upper headband of the headphones and the receive coil was suspended in a wooden frame ∼10 cm directly above the listener. At the start of each 90-trial run, a steady 4000 Hz pure tone was delivered from both earphones, and subjects were instructed to adjust the earphone placement to obtain a clearly centered acoustic image. Next, listeners were instructed to sit upright and face directly forward, and to initiate the run by button press or touchscreen response. The head position recorded upon this initiation signal defined a “home” position for each run. Listeners were required to orient within ±5° of home position azimuth and elevation before the start of each trial. Text symbols delivered at eye level and in the center of the display indicated directional deviations from home position. After holding home position for one second, the symbols disappeared and a single auditory stimulus was presented following an additional 1 s delay.
Two different open-loop response measures were employed. The first utilized a head-turn measure previously described by Stecker (2010). Following presentation of a single stimulus, the listener was instructed to rotate her head in the direction of the perceived sound location, by an amount corresponding to the magnitude of the image's lateral position, and then to indicate the response by pressing a hand-held button. The listener was instructed to indicate the leftmost image if multiple images were perceived, or the leftmost extent of a broad image. Although listeners did not spontaneously report having heard multiple images in any condition, the instruction was included to ensure that analyses were not biased by listener's decisions about which image to identify (leftmost responding simply flattens TWFs in such cases). Head position was recorded at the time of each button press, and its azimuth defined the lateralization response on each trial. Although the stimuli employed in this study were expected to produce images within, and not external to, the head, a majority of listeners spontaneously described the task as “turning to face the direction of sound” and none suggested any awareness of the artificiality of turning one's head in the direction of something inside one's head. Regardless, the analytical procedure requires only that responses be systematically correlated to the degree of lateralization experienced by the listeners, and in this regard we do not consider the presence or absence of external perception to be of any major consequence.
The second response measure utilized the touchscreen. Listeners were presented with a 55-cm horizontal bar, 2 cm in height, positioned at eye level on the touchscreen display. The bar spanned approximately 50° visual angle. Following each stimulus presentation, subjects were instructed to make an eye movement in the perceived direction of the sound (i.e., to look at a particular location on the bar) without moving the head, and then (while maintaining head position) to touch the foveated point using either hand. Listeners were instructed beforehand that the horizontal dimension of the bar should be used to indicate the degree of leftward or rightward laterality, with the edges of the bar correspond to “fully left” and “fully right” and the center of the bar indicating a centered image. The horizontal position of response within the bar defined the lateralization response on each trial. As in the head-turn condition, listeners were instructed to identify the leftmost image if multiple or diffuse images were perceived.
In both methods, subjects were instructed to return to the home position following each response, and prepare for the next trial. Each run consisted of 90 trials (15 trials per base ITD/ILD value), and subjects completed 8 runs for each combination of ICI (randomized across sets of 4 runs, within which ICI was fixed) and response measure (fixed within sets of 12 runs). Testing order was counterbalanced across listeners and arranged so that each subject completed four runs of each ICI/response combination before proceeding to the next condition.
Analysis of TWFs
Response data were transformed to ranks (i.e., ranked according to lateral position) within each run prior to the estimation of TWFs using multiple linear regression. Rank-transformation served two purposes. First, it normalized response data across runs and across listeners to avoid effects of bias (e.g., tending to respond further to one side or the other) or range (e.g., failing to utilize the full response scale) differing across listeners. Second, rank-transformation reduces the effects of nonlinearities in response data (e.g., expansion due to listeners avoiding responses close to midline) and ensures a uniform distribution of the response data. Visual inspection of pre-transformed data revealed occasional differences in bias, range, and linearity of responses across subjects and runs, but otherwise approximately uniform response distributions. Thus, it appears unlikely that, in this case, rank-transformation would have significantly altered the degree of response dependency on ITD and ILD. TWFs calculated from non-transformed data were quantitatively similar, though more variable, to those described here using rank-transformed data.2
Perceptual weights for each of 16 clicks in a train were estimated using multiple linear regression of the rank-transformed response, θR, onto the binaural cues applied to individual clicks, θi
| (1) |
For comparison across subjects and conditions, regression coefficients, βi, were then normalized so that absolute values summed to 1 over the 16-click stimulus duration3
| (2) |
The normalized weights, wi, indicate each click's relative influence on the listener's response, and typically vary from 0 (indicating no linear relationship between click location and response) to 1 (indicating a perfect linear relationship). Negative values may also be obtained, but generally reflect variation around zero rather than significant negative effects on the response. Plots of wi weights vs click number comprise the TWFs and indicate how click effectiveness varies over the stimulus duration. TWFs were estimated separately for each combination of listener, ICI, and response method, with each analysis combining data across all eight runs for the combination in question. Statistical confidence intervals were computed at the 95% confidence level for each normalized weight, using a 1000-fold bootstrap procedure (Efron and Tibshirani, 1986). For each combination of subject and condition, individual trials were resampled with replacement 1000 times. Normalized weights were computed for each bootstrapped sample according to Eqs. 1, 2. Distributions of bootstrapped wi were approximately normal; the standard deviation across bootstrapped samples was used to estimate the standard error of wi for calculation of 95% confidence intervals on wi for individual TWFs.
Group-average TWFs, as plotted in Fig. 1, were computed by taking the mean across subjects for each click weight; 95% confidence intervals were computed by bootstrapping the individual TWFs as described above and computing a group-mean TWF on each iteration. Statistical confidence intervals were based on the resulting distribution of group-mean weights across 1000 bootstrapped samples.
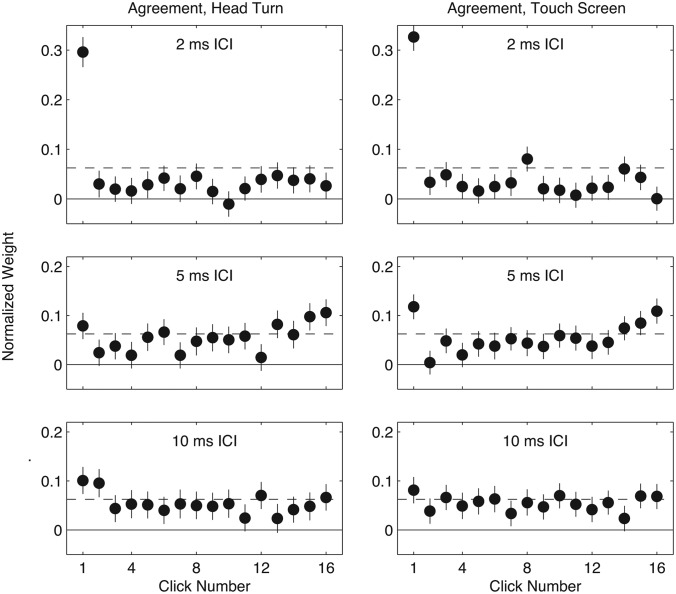
Figure 1.
Subject-averaged TWFs for ITD and ILD in agreement. Left: head-turn response, right: touchscreen response. In each panel, normalized weights (y-axis) are plotted for each click in a train, as a function of the temporal order of the clicks (x-axis). Symbols plot the mean of normalized weights across subjects; error bars indicate bootstrapped 95% confidence intervals on mean weights. The dashed horizontal line in each panel indicates the value that would obtain if all clicks were equally weighted (1/16), while the solid line indicates zero. Top to bottom, panels plot TWFs for 2, 5, and 10 ms ICI, respectively.
For an ideal observer, each TWF would reflect uniform and equal weighting on all clicks in a train, as all clicks would be equally informative for the task. That is, if listeners' responses made optimal use of binaural information carried by all clicks in a train, normalized TWFs would be flat, with a value of 1/16 for each click. For reference, that value is plotted as a dashed line in Figs. 1, 2, and 5678.
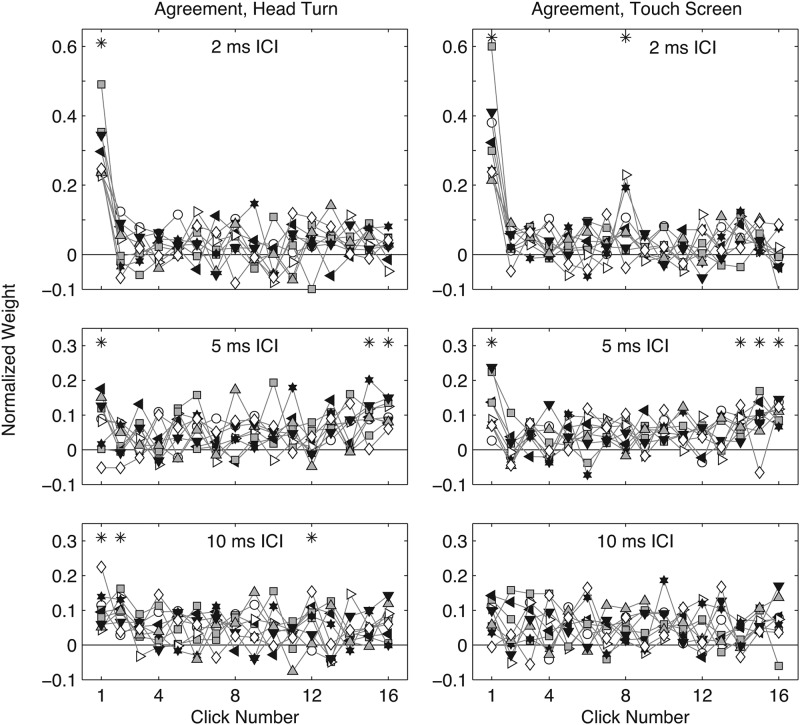
Figure 2.
Individual-subject TWFs for ITD and ILD in agreement. Left: head-turn response, right: touchscreen response. As in Fig. 1, panels plot normalized click weight (y-axis) as a function of the temporal order of clicks in a train (x-axis). Symbols indicate TWFs for individual subjects. Asterisks (*) mark clicks where a statistically significant proportion of subjects (p < 0.05) demonstrated significantly non-zero weights on an individual basis (also p < 0.05). Other conventions (dashed line at 1/16, solid line at 0, ICI = 2, 5, 10 ms from top to bottom panels, respectively) as in Fig. 1.
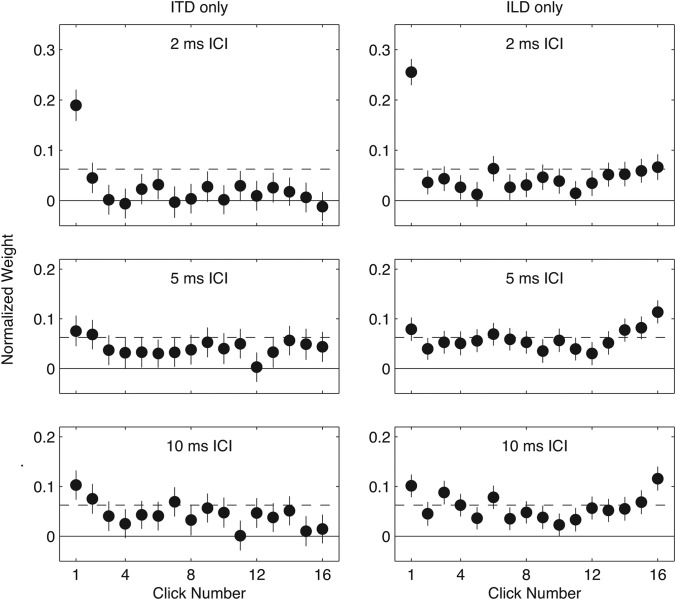
Figure 5.
Subject-averaged TWFs for ITD (left) and ILD (right) tested separately (Experiment 2). Formatting as in Fig. 1.
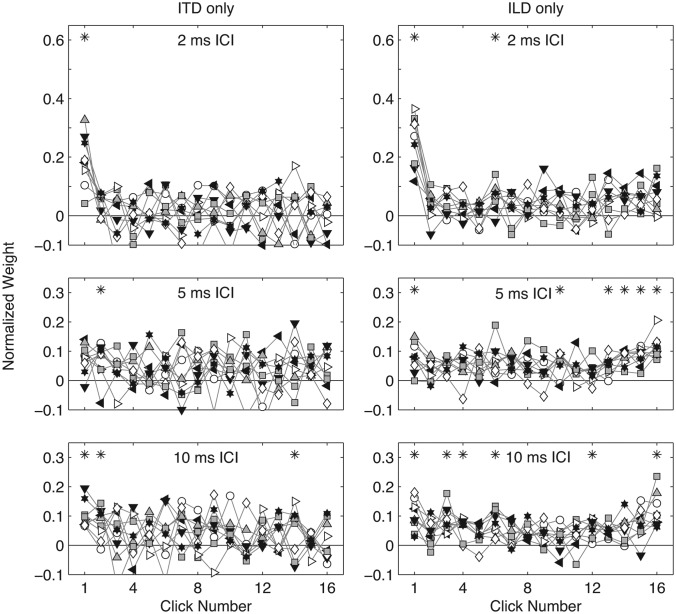
Figure 6.
Individual-subject TWFs for ITD (left) and ILD (right) tested separately (Experiment 2). Formatting as in Fig. 2.
Figure 7.
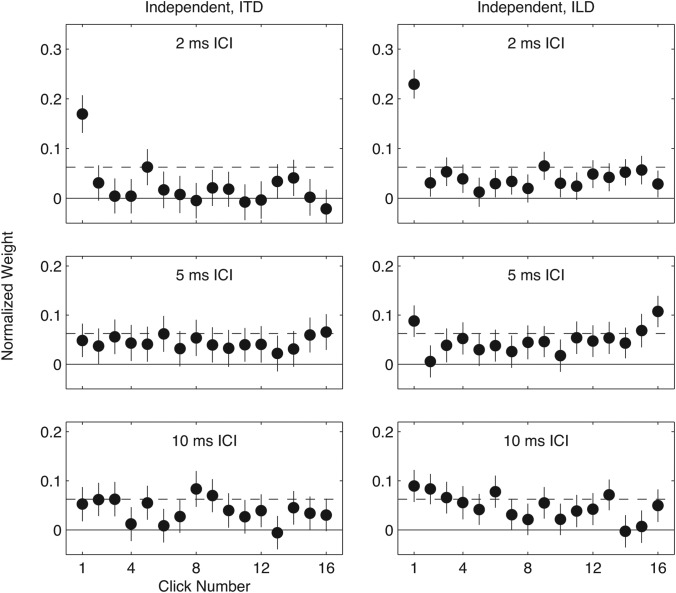
Subject-averaged TWFs for ITD (left) and ILD (right) presented together but with independent per-click variation (Experiment 3). Formatting as in Fig. 1.
Figure 8.
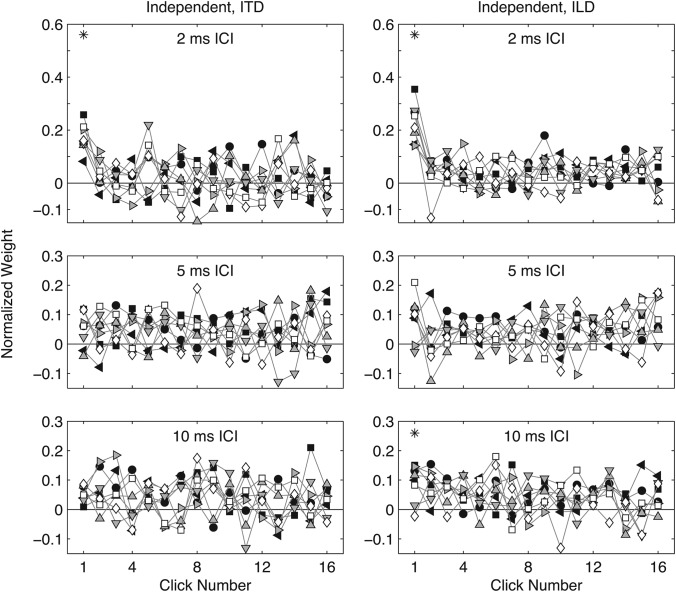
Individual-subject TWFs for ITD (left) and ILD (right) measured simultaneously (Experiment 3). Formatting as in Fig. 2.
Measures of non-uniformity in TWFs
Following Stecker and Hafter (2009), two measures were defined to estimate the degree to which TWFs departed from uniformity. Both are ratios adapted from the “average ratio” (AR), originally defined by Saberi (1996) as the ratio of onset click weight to the average of post-onset click weights. As did Stecker and Hafter (2009), we redefined AR as the ratio of onset or offset weight to the mean of intermediate weights (i.e., the mean excluding onset and offset clicks)
| (3) |
or
| (4) |
where N indicates the total number of clicks in each train (16 for all experiments described here). ARonset describes the degree to which onset clicks dominated listeners' judgments (i.e., “onset dominance”); similarly ARoffset indicates the relative influence of offset clicks (a measure of “upweighting”4).
Results
TWFs, averaged across subjects, are plotted in Fig. 1 for each combination of response measure (left vs right panels) and ICI (top to bottom). Consistent with past studies (Saberi, 1996; Stecker and Hafter, 2002, 2009; Brown and Stecker, 2010), onset clicks received significantly higher weight than did later clicks when the ICI was short (2 ms). That effect was reduced for longer values of ICI. At 5 ms ICI, the largest weights were found for both onset and offset clicks, consistent with the upweighting reported by Stecker and Hafter (2002, 2009), which was similarly found to be greatest in that range of ICI. No evidence for upweighting was observed at 2 ms ICI. Both effects were reduced or absent in the generally flatter TWFs measured at 10 ms ICI, which more closely approximated the equal-weighting value of 1/16 (dashed line).
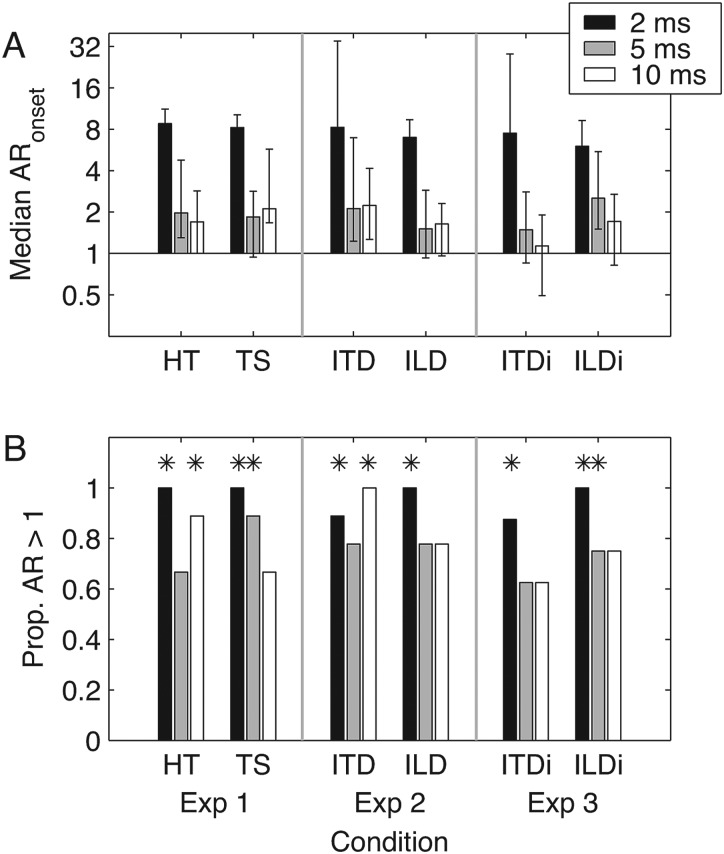
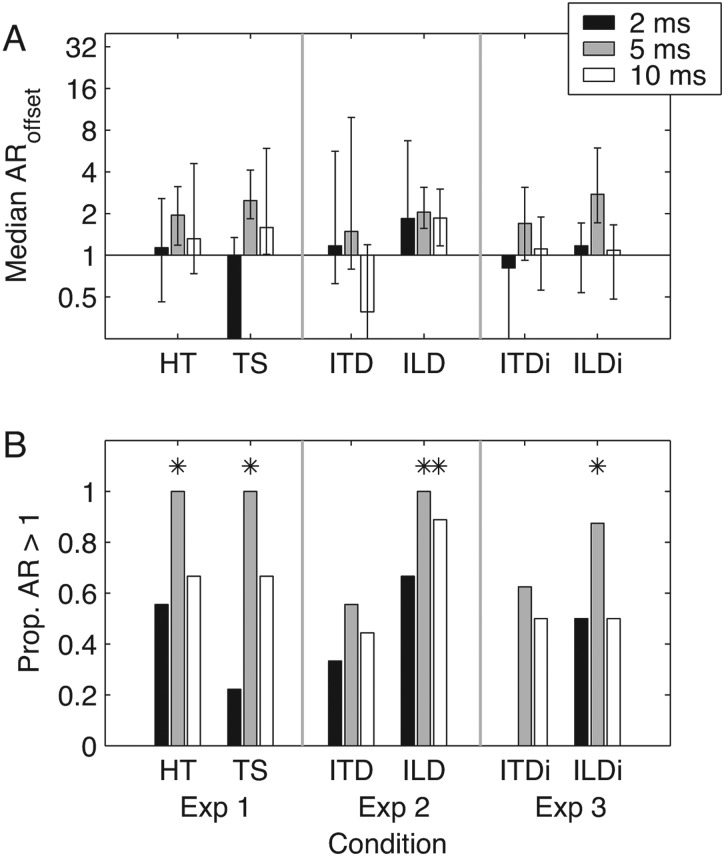
Individual-subject TWFs are plotted in Fig. 2. Subjects were unanimous in assigning high weights to click 1 at 2 ms ICI. A similar pattern is seen in the weights applied to offset clicks at 5 ms ICI; weights on click 16 were significantly greater than 0 (one-tailed p < 0.05) on an individual basis for 8 of 9 subjects in the head-turn condition and 9 of 9 subjects in the touchscreen condition. Asterisks (*) mark those clicks along with any others with significantly non-zero weights in a statistically significant proportion of subjects (i.e., at least six, p < 0.05). Those patterns of onset dominance at 2 ms ICI and upweighting at 5 ms ICI are further illustrated in the leftmost bars (“HT” and “TS”) plotted in Figs. 34; both the median AR values across subjects and the proportion of subjects exhibiting AR > 1 indicate onset dominance (ARonset > 1; Fig. 3) at 2 ms ICI and upweighting (ARoffset > 1; Fig. 4) at 5 ms ICI, in both response conditions. Significant proportions of subjects also exhibited ARonset > 1 at 5 ms ICI in the touchscreen condition and at 10 ms ICI in the head-turn condition, although the group median ARonset in these conditions failed to reach significance due to the modest size of effects for most subjects (see Fig. 2).
Figure 3.
Onset weights dominate lateralization at short ICI. (A) Across-subject median ratio of onset weight to interior weight (ARonset) is plotted against experimental condition. From left to right, conditions are Experiment 1 head-turn (HT) response; Experiment 1 touchscreen (TS) response; Experiment 2 ITD condition; Experiment 2 ILD condition; Experiment 3 ITD weights; Experiment 3 ILD weights. Bar shading indicates ICI of 2 ms (black), 5 ms (gray), or 10 ms (white). Error bars plot bootstrapped 95% confidence intervals. (B) Proportion of subjects demonstrating onset dominance (ARonset > 1). Asterisks (*) indicate statistical significance of the proportion (p < 0.05) via sign test.
Figure 4.
Elevated offset weights were observed especially for ILD at 5 ms ICI. (A) Across-subject median ratio of offset weight to interior weight (ARoffset) is plotted against experimental condition. Conditions and formatting as in Fig. 3. (B) Proportion of subjects demonstrating upweighting (ARoffset > 1). Asterisks (*) indicate statistical significance of the proportion (p < 0.05) via sign test.
Finally, comparing the TWFs measured using the head-turn and touchscreen response measures in Figs. 12 suggests a close correspondence, with similar degrees of onset dominance and upweighting across the two methods. The median ARonset across subjects was 8.8 for the head-turn and 8.2 for the touchscreen measures at 2 ms ICI. Corresponding values were 2.0 and 1.9 at 5 ms ICI, and 1.7 and 2.1 at 10 ms ICI. ARoffset was also similar across head-turn and touchscreen conditions: ARoffset = 2.0 and 2.5, respectively, at 5 ms ICI. No significant differences in AR were observed between head-turn and touchscreen conditions. All estimates of AR were contained within the 95% confidence interval obtained under the other procedure at the corresponding ICI. Note that the apparent reduction in ARoffset for 2 ms ICI in the touchscreen task resulted from near-zero—and for some subjects negative—weights applied to click 16, but did not differ significantly from 1.
The results of Experiment 1 support the key features of TWFs described by Stecker and Hafter (2002, 2009), namely onset dominance at 2 ms ICI and upweighting at 5 ms ICI. That similarity, together with the failure of Brown and Stecker (2010) to observe upweighting for ITD or ILD discrimination, suggests that upweighting may reflect aspects of open-loop localization or lateralization tasks, at least for stimuli carrying both ITD and ILD cues. Furthermore, the precise nature of the task (orientation via head-turning or scaling via touchscreen response) appeared to have no influence on the results. To determine whether the nature of the cue plays an additional role, the second experiment aimed to measure TWFs separately for ITD and ILD using the touchscreen task employed in Experiment 1.
EXPERIMENT 2: INTERAURAL TIME AND LEVEL TESTED SEPARATELY
Methods
Subjects
Nine subjects (three female) participated in Experiment 2. Five subjects had previously completed testing in Experiment 1. All were paid subjects naive to the purpose of the experiment. All subjects reported normal hearing and demonstrated pure-tone detection thresholds <15 dB HL at octave frequencies spanning 250–8000 Hz.
Stimuli
Stimuli were identical in composition to those presented in Experiment 1, except for differences in how ITD and ILD were imposed (see Sec. 2A2). In this case, the two cues were tested in separate conditions; in the ITD condition, ITD values were identical to those employed in Experiment 1, but the ILD of each click in a train was fixed at 0 dB. Conversely, in the ILD condition, ILD values were applied identically to Experiment 1, but the ITD of each click was fixed at 0 μs.
Procedure
The testing procedure was identical to that employed in the touchscreen condition of Experiment 1. Subjects completed 8 runs of 90 trials for each combination of ICI and condition (ITD and ILD). ITD and ILD conditions were tested in separate runs. As in Experiment 1, testing order was counterbalanced across listeners and arranged so that each subject completed four runs of each ICI/condition combination before proceeding to the next combination. TWFs were computed in an identical manner to Experiment 1, with θi [see Eq. 1] corresponding to the ITD or the ILD, depending on tested condition.
Results
TWFs averaged across subjects are plotted in Fig. 5. Evidence of onset dominance (i.e., elevated weight applied to the onset click) was observed for both cue types, and was most apparent for short (2 ms) ICI, consistent with the results of Experiment 1 and with previous studies (Saberi, 1996; Brown and Stecker, 2010; Stecker and Hafter, 2002, 2009). Evidence for upweighting, however, was observed only in the ILD condition, where the form of TWFs was qualitatively similar to those measured in Experiment 1. Those observations are corroborated in the analysis of ARonset and ARoffset [Figs. 3a, 4a]. Again, onset dominance manifested in large and ICI-dependent values of ARonset in both conditions. For ITD, median ARonset equalled 8.2, 1.9, and 2.1 at 2, 5, and 10 ms ICI, respectively. The corresponding values for ILD were 7.0, 1.5, and 1.6. Median ARonset significantly exceeded 1 for both cues at all tested values of ICI. In contrast, only the ILD condition showed median values of ARoffset significantly greater than 1, which were found for ICI of 5 (AR = 2.1) and 10 (AR = 1.9) ms.
Individual-subject TWFs measured in Experiment 2 are plotted in Fig. 6, and closely match the key features of group-average TWFs, as do the AR values plotted in Figs. 34. The proportion of subjects showing evidence of onset dominance (ARonset > 1) was similar, across conditions, to Experiment 1 [Fig. 3b]. The proportion of subjects showing evidence of upweighting (ARoffset > 1), however, differed across conditions. Significant proportions of upweighting were observed for 5 and 10 ms ICI in the ILD condition, but not at all in the ITD condition.
Inspection of the TWFs plotted for ITD and ILD in Figs. 56 suggests an important difference in the weight received by post-onset clicks carrying the two cues. Specifically, weights for clicks 2–16 were lower overall in the ITD condition than the corresponding weights obtained in the ILD condition at 2 ms ICI (means = 0.013 vs 0.040; unpaired t28 = 4.42, p < 0.001) and at 5 ms ICI (0.040 vs 0.058; t28 = 2.67, p < 0.05), but not at 10 ms ICI (0.040 vs 0.056; t28 = 1.98, p > 0.05). Thus, while neither ITD nor ILD conditions resulted in significant upweighting at 2 ms ICI, the average post-onset click was more effective in terms of its ILD than its ITD. That result is consistent with the finding of Brown and Stecker (2010), who also did not observe upweighting in either condition, but found the mean of post-onset ILD to be a stronger predictor of listener behavior than the mean of post-onset ITD.
The results of Experiment 2 suggest onset dominance to be characteristic of TWFs for both ITD and ILD, but upweighting to be confined to judgments of ILD. Thus, the upweighting observed in Experiment 1 and by Stecker and Hafter (2002, 2009) may have reflected the ILD component of stimuli carrying both cues. Experiment 3 aimed to test that possibility explicitly, by measuring TWFs separately for ITD and ILD when they varied independently within a single stimulus.
EXPERIMENT 3: INTERAURAL TIME AND LEVEL TESTED SIMULTANEOUSLY BUT VARIED INDEPENDENTLY
Methods
Subjects
Eight subjects (four female) participated in Experiment 3. Of those, one was newly recruited into the study, one had previously completed testing only in Experiment 1, and the remaining six had completed testing in both prior experiments. All were paid subjects naive to the purpose of the experiment. All subjects reported normal hearing and demonstrated pure-tone detection thresholds <15 dB HL at octave frequencies spanning 250–8000 Hz.
Stimuli
Stimuli were identical in composition to those presented in Experiment 1, except for differences in how ITD and ILD were imposed. In this case, the “base” ITD and ILD were assigned as in Experiment 1 (that is, in “agreement” with one another) while the perturbation of ITD and ILD applied to individual clicks was determined independently for the two cues using distributions of ITD and ILD identical to Experiment 1. That is, individual-click ITD values were randomly drawn from a distribution centered on the base ITD ±100 μs, while individual-click ILD values were separately drawn from a random distribution centered on the base ILD ±2 dB (see Sec. 2A2).
Procedure
The testing procedure was identical to that employed in the touchscreen condition of Experiment 1. Subjects completed 8 runs of 90 trials for each ICI. As in Experiment 1, testing order was randomized and arranged so that each subject completed four runs of each ICI before proceeding to the next ICI.
TWFs were computed similarly to Experiment 1, with the exception that both ITD and ILD weights were computed for each click in a train, as the two cues were varied independently:
| (5) |
where βti and βli indicate the raw regression coefficients for ITD (θti) and ILD (θli), respectively, applied to click i. Weights were computed by normalizing regression coefficients (separately for ITD and ILD) as in Experiment 1
| (6) |
| (7) |
Normalized weights are plotted separately for the two cues in Figs. 78.
Results
TWFs are plotted averaged across subjects in Fig. 7, and for individual subjects in Fig. 8. The general form of TWFs at 2 and 5 ms ICI was similar to that observed in Experiment 2: whereas strong onset dominance (significantly elevated weights on click 1) was found for both cue types at 2 ms ICI, significant upweighting was only apparent for the ILD cue at 5 ms ICI. That pattern is reiterated in Figs. 34. Median ARonset across subjects significantly exceeded 1 for ITD (AR = 7.7) and ILD (AR = 6.0) at 2 ms ICI, and for ILD at 5 ms ICI (AR = 2.2). In contrast, median ARoffset significantly exceeded 1 only for ILD at 5 ms ICI (AR = 3.1). All other AR measurements were not significantly different from 1.
As in Experiment 2, post-onset ITD weights were significantly smaller than corresponding ILD weights at 2 ms ICI (means = 0.014 vs 0.038; unpaired t28 = 3.56, p < 0.005). This was not the case at 5 ms (0.044 vs 0.045; t28 = 0.18, p > 0.05), or 10 ms ICI (0.040 vs 0.044; t28 = 0.50, p > 0.05).
DISCUSSION
Onset dominance in the lateralization of high frequency modulated sounds
Across conditions, the results of this study demonstrated flat TWFs at 10 ms ICI, but significant onset dominance in the form of large onset-click weights at 2 ms ICI. Those features are consistent with past studies that measured TWFs for individual binaural cues (Saberi, 1996; Brown and Stecker, 2010) and for free-field localization (Stecker and Hafter, 2002, 2009). When ITD was manipulated, and especially at 2 ms ICI, TWFs were quite similar to those reported in previous studies using left/right ITD discrimination (Saberi, 1996; Brown and Stecker, 2010). Thus, it appears that the dominance of the onset cue in such conditions is not affected by the task employed.
Brown and Stecker (2010) reported significant onset dominance for both ITD and ILD, but noted that the effect was stronger for ITD than ILD in the sense that listener's discrimination responses more closely followed the time-averaged ILD (i.e., the overall cue including both onset and post-onset portions) than the time-averaged ITD. That is, the average post-onset click was more effective in terms of its ILD than its ITD. A similar pattern was observed in Experiments 2 and 3 of the current study: at 2 ms ICI, post-onset weights were significantly larger overall for ILD (where the majority were significantly greater than 0) than for ITD (where the majority were not).
The origin of onset dominance in binaural processing of such stimuli is not entirely understood, but its ICI-dependence is consistent with both the effects of peripheral filtering (Tollin, 1998) and with the loss of sensitivity to ongoing envelope ITD above approximately 150 Hz modulation rate (Bernstein and Trahiotis, 2002). As sensitivity to ongoing ITD cues is lost, listeners rely more strongly on the remaining intact cues, namely onset ITD (as evidenced by the current results) and ILD (Stecker, 2010). By this account, it remains unclear why ILD, which presumably does not depend on envelope modulations (Tollin, 2003), should also show a similar ICI-dependent onset dominance. The roughly similar onset effects for both cues are in agreement, however, with observations of Hafter et al. (1983, 1988). Future studies should examine whether the onset effects observed here coincide with a specific limitation of binaural processing in modulated high-frequency sound, or whether they might instead reflect general principles at work for other stimuli (e.g., low-frequency narrowband sounds; cf. Houtgast and Plomp, 1968).
Upweighting of late-arriving ILD
The present data additionally suggest a special importance of late-arriving ILD (i.e., upweighting), consistent with the results of Stecker and Brown (2012). Specifically, in some conditions, clicks near the sound's offset received significantly greater weight than did interior (e.g., immediately post-onset) clicks. That result is in agreement with past studies demonstrating an enhanced sensitivity to cues occurring near sound offset (Stecker and Hafter, 2009; Macpherson and Wagner, 2008; Zurek, 1980; Akeroyd and Bernstein, 2001). Upweighting was strongest at 5 ms ICI and occurred only in those conditions that manipulated the ILD cue, consistent with the failure of past studies to observe upweighting for ITD discrimination (Saberi, 1996; Brown and Stecker, 2010; Stecker and Brown, 2010).
Compared to the results of Brown and Stecker (2010), who measured TWFs for ITD and ILD discrimination, the data are only partly consistent. Although both studies demonstrated greater weighting of ILD than ITD carried by post-onset clicks when the ICI was short, Brown and Stecker (2010) did not observe increased weight on the last few clicks specifically, as observed in the current study. This discrepancy suggests the nature of the task may also be important. For example, open-loop spatial judgments require that listeners attend to, encode, and briefly remember the apparent location of a sound in order to produce an appropriately scaled response, whereas left/right discrimination may be performed more directly (i.e., in a “sensory-trace” mode; Durlach and Braida, 1969). In that view, upweighting may be seen as a kind of recency effect in sensory memory, similar to recency effects in the free recall of memorized word lists (Glanzer and Cunitz, 1966). The larger cue values presented for suprathreshold lateralization vs discrimination may also be important. That view is supported by higher detection thresholds for dynamic than static ILD cues that are nevertheless lowest for cues near onset and offset than during the middle of a sound (Stecker and Brown, 2012).
Differences between studies notwithstanding, all of our recent work on this question is in agreement regarding better sensitivity to post-onset ILD than ITD (Stecker and Brown, 2010, 2012; Brown and Stecker, 2010, 2011). Greater sensitivity to post-onset ILD than ITD is evident directly in measured TWFs (Brown and Stecker, 2010; present study) and also in listeners' greater reliance on ILD than ITD when trading the two cues at shorter ICI (Stecker, 2010). The form of TWFs observed in the present study is consistent with Stecker and Hafter's (2009) suggestion of two separate mechanisms: one which emphasizes onset cues of both types, and another that gives rise to the greater weight on recent than earlier clicks by leaky temporal integration of the ongoing ILD (cf. Akeroyd and Bernstein, 2001). That ITD is apparently not subject to this temporally integrative process suggests that the temporal integration occurs either via segregated mechanisms for the two cues, or prior to cue extraction by neuronal mechanisms lacking the temporal fidelity necessary to compute ITD (e.g., via de novo ILD computation beyond the level of initial binaural interaction; Burger and Pollak, 2001; Stecker et al., 2005; Grothe et al., 2010).
Finally, the present results have clear behavioral implications for the processing of sounds whose spatial cues evolve over time. In rooms, for example, sound onsets carry cues associated with the direct sound path, whereas later arriving sound may carry cues associated with both the direct sound and with echoes and reverberation. The current results suggest that listeners should be profoundly insensitive to ITD except that of the direct sound (i.e., they should experience a strong precedence effect for ITD), but maintain greater sensitivity to ILD in the decaying sound field. Thus, one expects precedence effects to be stronger overall for ITD than for ILD, and more sensitive to disruption by changes to the ILD than the ITD of an echo (cf. Krumbholz and Nobbe, 2002; Brown and Stecker, 2013). The difference suggests that while both cues contribute to the localization of sound sources in reverberant environments, the ILD alone conveys information about the environment itself.
Models to account for TWF features
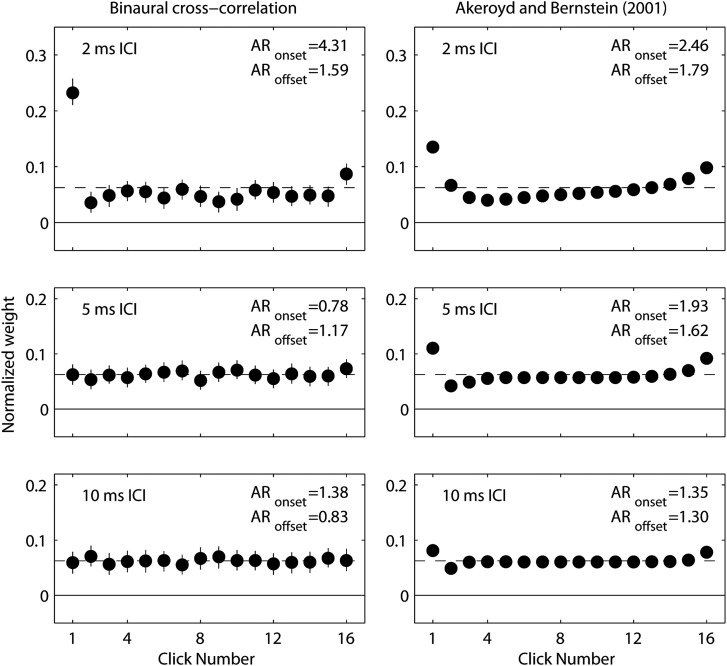
Finally, two approaches to modeling temporal phenomena in binaural hearing may bear on the current results and should be briefly considered. The first approach is to consider the overlapping responses of auditory peripheral filters to successive clicks, which may obscure the representation of post-onset clicks if the ICI is sufficiently short (Tollin, 1998; Tollin and Henning, 1999; Hartung and Trahiotis, 2001). TWFs plotted in the left column of Fig. 9 illustrate the consequences of such effects. TWFs were estimated based on binaural cross-correlation of auditory filter outputs (see the Appendix for modeling details). At 2 ms ICI, TWFs reveal strong onset dominance and significant weight on the final click. Note that the latter affects only the offset click and not those clicks recently preceding the offset, as in upweighting. Both effects are consistent with a “ringing” of the auditory filter that both obscures responses to post-onset clicks and sustains the response to sound offset. At 5 and 10 ms ICI, responses to successive clicks are more independent; consequently, TWFs appear flat. Because the impulse response duration varies with the characteristic frequency of an auditory filter, however, future testing at lower frequencies should reveal strong onset- and offset-weighting even at longer ICI values (Stecker, 2013). Conversely, testing at higher frequencies should reduce those effects at 2 ms ICI. Overall, the model's good fit to TWFs observed at 2 ms ICI suggests peripheral filtering as a strong candidate mechanism for onset dominance in such stimuli.
Figure 9.
Modeled TWFs for ITD-based lateralization of 4000-Hz Gabor click trains, as in Experiment 2. Left: TWFs based on binaural cross-correlation of peripheral filter outputs. Error bars indicate bootstrapped 95% confidence intervals. Right: TWFs based on windowed temporal integration plus post-onset weighting (Akeroyd and Bernstein, 2001). Inset: AR values computed according to Eqs. 3, 4. See the Appendix for modeling details.
The second approach is to quantify the effects of temporal integration. Here, we adopted the model of Akeroyd and Bernstein (2001), which combines post-onset weighting (Houtgast and Aoki, 1994) with temporally asymmetric binaural integration. Modeled TWFs for stimuli of the current experiment appear in Fig. 9 (right column), and reveal modest onset dominance at all ICI values as well as clear upweighting that extends prior to offset by 20 ms or so. Although a systematic quantitative evaluation across model parameters would transcend the scope of this paper, the qualitative similarity of modeled to observed TWFs serves to illustrate the potential role of temporal integration, as argued by Stecker and Hafter (2009). It should be noted, however, that Akeroyd and Bernstein (2001) observed very little difference between detection of ITD and ILD in their study. Accordingly, aside from modest differences in the post-onset weighting function, the predictions of that model do not distinguish between the two cues. The model thus fails to account for observed differences in the magnitude of upweighting across ITD and ILD.
SUMMARY AND CONCLUSIONS
-
1.
Onsets dominate lateralization by ITD and ILD when the ICI is short. The first click in a train consistently received a larger weight (by a factor of 6 or more) than did clicks appearing in the middle of a train when the ICI was 2 ms; weights were more similar across clicks for longer ICI. The pattern of results is consistent with a large number of studies reporting strong “onset dominance” in the discrimination (Saberi, 1996; Brown and Stecker, 2010; Stecker and Brown, 2010) and localization (Stecker and Hafter, 2002) of high-rate click trains. Here, strong onset dominance was observed regardless of cue type, consistent with past studies comparing ITD and ILD discrimination (Hafter and Dye, 1983; Hafter et al., 1983; Brown and Stecker, 2010).
-
2.
Reduction of lateralization weights following onset is immediate. Also consistent with previous studies (Saberi, 1996; Brown and Stecker, 2010; Stecker and Hafter, 2002), TWFs revealed that elevated onset (click 1) weights were followed by sharply reduced weights on subsequent clicks (i.e., click 2). That result is not consistent with the account of “binaural adaptation” given by Hafter and Buell (1990), who suggested that click effectiveness decreases monotonically following sound onset, but is roughly in line with the form of post-onset weighting functions described by Houtgast and Aoki (1994).
-
3.
Under conditions of onset dominance, post-onset ILD remains more effective than does post-onset ITD. Consistent with the finding of Brown and Stecker (2010) that listeners' judgments were more strongly affected by post-onset ILD than post-onset ITD during discrimination, lateralization weights for ILD carried by post-onset clicks at 2 ms ICI were significantly larger than for ITD. Near-zero weights suggest nearly complete onset dominance, such that post-onset ITD is almost entirely ineffective at short ICI, whereas weaker onset dominance for ILD allows post-onset ILD cues to make small but positive contributions to lateralization.
-
4.
“Upweighting” of late-arriving sound affects ILD, but not ITD. In several conditions, clicks occurring near sound offset received significantly greater weight (roughly by a factor of 2) than did interior clicks. Specifically, such “upweighting” was observed at 5 ms ICI when ITD and ILD were manipulated together (Experiment 1) and when ILD, but not ITD, was manipulated alone (Experiment 2) or in conjunction with an independently manipulated ITD (Experiment 3). That result is consistent with upweighting for sound localization in the free field (Stecker and Hafter, 2009) and with a greater role of post-onset ILD in binaural discrimination (Brown and Stecker, 2010; Stecker and Brown, 2010, 2012). It suggests upweighting as a phenomenon that affects ILD, but not ITD, in open-loop localization and lateralization tasks.
ACKNOWLEDGMENTS
The authors thank Julie Stecker for coordinating the study and assisting with data collection. This study was supported by Grants No. R03DC009482 and R01DC011548 from the National Institute on Deafness and Other Communication Disorders (NIDCD). The content is solely the responsibility of the authors and does not necessarily represent the official views of the NIDCD or the National Institutes of Health. Portions of this work were previously presented in abstract form (Stecker et al., 2011).
APPENDIX: TWF MODELING AS BINAURAL TEMPORAL INTEGRATION AND POST-ONSET WEIGHTING
TWFs for binaural cross-correlation of peripheral filter outputs
On each of 500 simulated “trials” per ICI condition, a train of 16 Gabor clicks was synthesized as in Experiment 2, with ITD values of individual clicks drawn from a uniform distribution spanning ±100 μs and ILD set to 0. Stimuli were input to the Binaural toolbox (Akeroyd, 2001) function mcorrelogram, with envelope-type nonlinear transduction [half-wave rectification plus power-law (0.2 then 2.0)]. This function computed the binaural cross-product across delays of ±1500 μs for a single pair of auditory filters centered on the stimulus frequency of 4000 Hz. The model's “response” on each trial was defined as the delay giving the largest cross-product, and TWFs were computed across the 500 trials as for psychophysical data [i.e., following Equations 1, 2].
TWFs for binaural temporal integration
TWFs for binaural temporal integration were computed according to the model of Akeroyd and Bernstein (2001) as adapted by Stecker and Hafter (2009):
First, post-onset weights x(t) were computed for each click in the train, as a function of its post-onset time, t, following Houtgast and Aoki (1994)
| (A1) |
Parameters for Eq. A1 matched those used by Akeroyd and Bernstein (2001) for ITD discrimination: a = 3.1, Ta = 2.8 ms, b = −2.1, Tb = 5.9 ms.
Next, temporally integrated weights y(t) were computed as the ratio of each x(t) weight to the sum of x weights falling within an asymmetric temporal window, ω(τ), centered on click time, t (Akeroyd and Bernstein, 2001)
| (A2) |
where τ represents time relative to the peak of the temporal window function, ω(τ)
| (A3) |
and T1 and T2 are time constants defining the temporal window. As for Eq. A1, parameters for Eq. A3 were set to values used by Akeroyd and Bernstein (2001) to model ITD discrimination: T1 = 5.2 ms, T2 = 7.2 ms. Finally, temporally integrated weights, y, were normalized to sum to 1 across all clicks in a train, as for the experimental data.
Footnotes
The term “open loop” is taken from control theory, and refers here to spatial judgments made following single stimulus presentations, with no opportunity to minimize error by repeated listening (as in adjustment methods) or to make an explicit comparison (as in discrimination methods).
In general, rank transformation is recommended because it ensures the data are distributed appropriately for linear regression. Its benefits should be clearer for data sets with greater nonlinearities, non-uniform response distributions, or run-to-run variability. Its major drawback is that resulting regression weights lack meaningful units, such as degrees response azimuth per microsecond ITD, that would be available using non-transformed data.
The use of absolute values in the denominator of Eq. 2 differs from the approach of Stecker and Hafter (2002, 2009), who normalized to the sum of raw weights. It was necessary in the current study in order to deal with negative post-onset weights occurring in some conditions (notably in Experiments 2 and 3, for ITD at 2 ms ICI; e.g., Fig. 6).
Unlike the case for onset dominance, upweighting appears in the form of elevated weights on clicks at and just prior to offset. Thus, ARoffset may somewhat underestimate the effect by including perioffset weights in the denominator of Eq. 4. Stecker and Hafter (2009) included a second measure, focusing on the linear trend of weights from click 2 to the offset, to address that concern. The results of the current study appeared similar regardless of the measure used, and as it would add little of substance to the current manuscript, the second measure is not addressed here.
References
- Akeroyd, M. A. (2001). “Binaural toolbox for MATLAB,” http://www.ihr.mrc.ac.uk/products/index.php/?page=matlab (Last viewed August 25, 2008).
- Akeroyd, M. A., and Bernstein, L. R. (2001). “ The variation across time of sensitivity to interaural disparities: Behavioral measurements and quantitative analyses,” J. Acoust. Soc. Am. 110, 2516–2526. 10.1121/1.1412442 [DOI] [PubMed] [Google Scholar]
- Bernstein, L. R., and Trahiotis, C. (2002). “ Enhancing sensitivity to interaural delays at high frequencies using ‘transposed stimuli,’” J. Acoust. Soc. Am. 112, 1026–1036. 10.1121/1.1497620 [DOI] [PubMed] [Google Scholar]
- Brown, A. D., and Stecker, G. C. (2010). “ Temporal weighting of interaural time and level differences in high-rate click trains,” J. Acoust. Soc. Am. 128, 332–341. 10.1121/1.3436540 [DOI] [PMC free article] [PubMed] [Google Scholar]
- Brown, A. D., and Stecker, G. C. (2011). “ Temporal weighting functions for interaural time and level differences. II. The effect of binaurally synchronous temporal jitter,” J. Acoust. Soc. Am. 129, 293–300. 10.1121/1.3514422 [DOI] [PMC free article] [PubMed] [Google Scholar]
- Brown, A. D., and Stecker, G. C. (2013). “ The precedence effect in sound localization: Fusion and lateralization measures for headphone stimuli lateralized by interaural time and level differences,” J. Acoust. Soc. Am. 133, 2883–2898. 10.1121/1.4796113 [DOI] [PMC free article] [PubMed] [Google Scholar]
- Burger, R. M., and Pollak, G. D. (2001). “ Reversible inactivation of the dorsal nucleus of the lateral lemniscus reveals its role in the processing of multiple sound sources in the inferior colliculus of bats,” J. Neurosci. 21, 4830–4843. [DOI] [PMC free article] [PubMed] [Google Scholar]
- Durlach, N. I., and Braida, L. D. (1969). “ Intensity perception. I. Preliminary theory of intensity resolution,” J. Acoust. Soc. Am. 46, 372–383. 10.1121/1.1911699 [DOI] [PubMed] [Google Scholar]
- Efron, B., and Tibshirani, R. (1986). “ Bootstrap methods for standard errors, confidence intervals, and other measures of statistical accuracy,” Stat. Sci. 1, 54–75. 10.1214/ss/1177013815 [DOI] [Google Scholar]
- Glanzer, M., and Cunitz, A. R. (1966). “ Two storage mechanisms in free recall,” J. Verbal Learn. Verbal Behav. 5, 351–360. 10.1016/S0022-5371(66)80044-0 [DOI] [Google Scholar]
- Grothe, B., Pecka, M., and McAlpine, D. (2010). “ Mechanisms of sound localization in mammals,” Physiol. Rev. 90, 983–1012. 10.1152/physrev.00026.2009 [DOI] [PubMed] [Google Scholar]
- Hafter, E. R., and Buell, T. N. (1990). “ Restarting the adapted binaural system,” J. Acoust. Soc. Am. 88, 806–812. 10.1121/1.399730 [DOI] [PubMed] [Google Scholar]
- Hafter, E. R., Buell, T. N., and Richards, V. M. (1988). “ Onset-coding in lateralization: Its form, site, and function,” in Auditory Function: Neurobiological Bases of Hearing, edited by Edelman G. M., Gall W. E., and Cowan W. M. (Wiley, New York: ), pp. 647–676. [Google Scholar]
- Hafter, E. R., and Dye, R. H. J. (1983). “ Detection of interaural differences of time in trains of high-frequency clicks as a function of interclick interval and number,” J. Acoust. Soc. Am. 73, 644–651. 10.1121/1.388956 [DOI] [PubMed] [Google Scholar]
- Hafter, E. R., Dye, R. H. J., and Wenzel, E. M. (1983). “ Detection of interaural differences of intensity in trains of high-frequency clicks as a function of interclick interval and number” J. Acoust. Soc. Am. 73, 1708–1713. 10.1121/1.389394 [DOI] [PubMed] [Google Scholar]
- Hartung, K., and Trahiotis, C. (2001). “ Peripheral auditory processing and investigations of the ‘precedence effect’ which utilize successive transient stimuli,” J. Acoust. Soc. Am. 110, 1505–1513. 10.1121/1.1390339 [DOI] [PubMed] [Google Scholar]
- Houtgast, T., and Aoki, S. (1994). “ Stimulus-onset dominance in the perception of binaural information,” Hear. Res. 72, 29–36. 10.1016/0378-5955(94)90202-X [DOI] [PubMed] [Google Scholar]
- Houtgast, T., and Plomp, R. (1968). “ Lateralization threshold of a signal in noise,” J. Acoust. Soc. Am. 44, 807–812. 10.1121/1.1911178 [DOI] [PubMed] [Google Scholar]
- Krumbholz, K., and Nobbe, A. (2002). “ Buildup and breakdown of echo suppression for stimuli presented over headphones—The effects of interaural time and level differences,” J. Acoust. Soc. Am. 112, 654–663. 10.1121/1.1490594 [DOI] [PubMed] [Google Scholar]
- Macpherson, E. A., and Wagner, M. L. (2008). “ Temporal weighting of cues for vertical-plane sound localization,” Assoc. Res. Otolaryngol. Abstr. 31, 301. [Google Scholar]
- McFadden, D., and Moffitt, C. M. (1977). “ Acoustic integration for lateralization at high frequencies,” J. Acoust. Soc. Am. 61, 1604–1608. 10.1121/1.381473 [DOI] [PubMed] [Google Scholar]
- McFadden, D., and Sharpley, A. D. (1972). “ Detectability of interaural time differences and interaural level differences as a function of signal duration,” J. Acoust. Soc. Am. 52, 574–576. 10.1121/1.1913147 [DOI] [Google Scholar]
- Nuetzel, J. M., and Hafter, E. R. (1976). “ Lateralization of complex waveforms: Effects of fine structure, amplitude, and duration,” J. Acoust. Soc. Am. 60, 1339–1346. 10.1121/1.381227 [DOI] [PubMed] [Google Scholar]
- Ricard, G., and Hafter, E. R. (1973). “ Detection of interaural time differences in short-duration low-frequency tones,” J. Acoust. Soc. Am. 53, 335. 10.1121/1.1982384 [DOI] [Google Scholar]
- Saberi, K. (1996). “ Observer weighting of interaural delays in filtered impulses,” Percept. Psychophys. 58, 1037–1046. 10.3758/BF03206831 [DOI] [PubMed] [Google Scholar]
- Stecker, G. C. (2010). “ Trading of interaural differences in high-rate Gabor click trains,” Hear. Res. 268, 202–212. 10.1016/j.heares.2010.06.002 [DOI] [PMC free article] [PubMed] [Google Scholar]
- Stecker, G. C. (2013). “ Effects of the stimulus spectrum on temporal weighting of binaural differences,” Proc. Meet. Acoust. 19, 050166. [Google Scholar]
- Stecker, G. C., and Brown, A. D. (2010). “ Temporal weighting of binaural cues revealed by detection of dynamic interaural differences in high-rate Gabor click trains,” J. Acoust. Soc. Am. 127, 3092–3103. 10.1121/1.3377088 [DOI] [PMC free article] [PubMed] [Google Scholar]
- Stecker, G. C., and Brown, A. D. (2012). “ Onset- and offset-specific effects in interaural level difference discrimination,” J. Acoust. Soc. Am. 132, 1573–1580. 10.1121/1.4740496 [DOI] [PMC free article] [PubMed] [Google Scholar]
- Stecker, G. C., and Hafter, E. R. (2002). “ Temporal weighting in sound localization,” J. Acoust. Soc. Am. 112, 1046–1057. 10.1121/1.1497366 [DOI] [PMC free article] [PubMed] [Google Scholar]
- Stecker, G. C., and Hafter, E. R. (2009). “ A recency effect in sound localization?,” J. Acoust. Soc. Am. 125, 3914–3924. 10.1121/1.3124776 [DOI] [PMC free article] [PubMed] [Google Scholar]
- Stecker, G. C., Harrington, I. A., and Middlebrooks, J. C. (2005). “ Location coding by opponent neural populations in the auditory cortex,” PLoS Biol. 3, e78. 10.1371/journal.pbio.0030078 [DOI] [PMC free article] [PubMed] [Google Scholar]
- Stecker, G. C., Ostreicher, J. D., Brown, A. D., and Stecker, J. M. S. (2011). “Temporal weighting functions for lateralization by interaural time and level differences,” Assoc. Res. Otolaryngol. Abstr. 34, 320. [Google Scholar]
- Tobias, J. V., and Zerlin, S. (1959). “ Lateralization threshold as a function of stimulus duration,” J. Acoust. Soc. Am. 31, 1591–1594. 10.1121/1.1907664 [DOI] [Google Scholar]
- Tollin, D. J. (1998). “ Computational model of the lateralization of clicks and their echoes,” in Proceedings of the NATO Advanced Study Institute on Computational Hearing, edited by Greenberg S. and Slaney M., pp. 77–82.
- Tollin, D. J. (2003). “ The lateral superior olive: A functional role in sound source localization,” Neuroscientist 9, 127–143. 10.1177/1073858403252228 [DOI] [PubMed] [Google Scholar]
- Tollin, D. J., and Henning, G. B. (1999). “ Some aspects of the lateralization of echoed sound in man. II. The role of the stimulus spectrum,” J. Acoust. Soc. Am. 105, 838–849. 10.1121/1.426273 [DOI] [PubMed] [Google Scholar]
- Yost, W. A., Wightman, F. L., and Green, D. M. (1971). “ Lateralization of filtered clicks,” J. Acoust. Soc. Am. 50, 1526–1531. 10.1121/1.1912806 [DOI] [PubMed] [Google Scholar]
- Zurek, P. M. (1980). “ The precedence effect and its possible role in the avoidance of inter-aural ambiguities,” J. Acoust. Soc. Am. 67, 952–964. 10.1121/1.383974 [DOI] [PubMed] [Google Scholar]


