Abstract
Purpose: To develop a proof-of-principle L-shell x-ray fluorescence (XRF) imaging system that locates and quantifies sparse concentrations of gold nanoparticles (GNPs) using a benchtop polychromatic x-ray source and a silicon (Si)-PIN diode x-ray detector system.
Methods: 12-mm-diameter water-filled cylindrical tubes with GNP concentrations of 20, 10, 5, 0.5, 0.05, 0.005, and 0 mg/cm3 served as calibration phantoms. An imaging phantom was created using the same cylindrical tube but filled with tissue-equivalent gel containing structures mimicking a GNP-loaded blood vessel and approximately 1 cm3 tumor. Phantoms were irradiated by a 3-mm-diameter pencil-beam of 62 kVp x-rays filtered by 1 mm aluminum. Fluorescence/scatter photons from phantoms were detected at 90° with respect to the beam direction using a Si-PIN detector placed behind a 2.5-mm-diameter lead collimator. The imaging phantom was translated horizontally and vertically in 0.3-mm steps to image a 6 mm × 15 mm region of interest (ROI). For each phantom, the net L-shell XRF signal from GNPs was extracted from background, and then corrected for detection efficiency and in-phantom attenuation using a fluorescence-to-scatter normalization algorithm.
Results: XRF measurements with calibration phantoms provided a calibration curve showing a linear relationship between corrected XRF signal and GNP mass per imaged voxel. Using the calibration curve, the detection limit (at the 95% confidence level) of the current experimental setup was estimated to be a GNP mass of 0.35 μg per imaged voxel (1.73 × 10⁻² cm3). A 2D XRF map of the ROI was also successfully generated, reasonably matching the known spatial distribution as well as showing the local variation of GNP concentrations.
Conclusions:L-shell XRF imaging can be a highly sensitive tool that has the capability of simultaneously imaging the spatial distribution and determining the local concentration of GNPs presented on the order of parts-per-million level within subcentimeter-sized ex vivo samples and superficial tumors during preclinical animal studies.
Keywords: x-ray fluorescence, gold nanoparticles, preclinical imaging
INTRODUCTION
X-ray fluorescence (XRF) analysis is a well-established nondestructive quantitative elemental analysis technique that has the ability to accurately probe most heavy elements. This methodology was first used in medicine in the 1950s for elemental analysis in animal bones and a variety of biological tissues.1, 2, 3 In recent years, it has been adopted to in vivo studies for quantification of lead4 and iron5 using L-shell XRF photons and also of iodine6 using K-shell XRF photons, with the detection limit typically on the order of parts-per-million (ppm) when performed with L-shell XRF photons. Additionally, a quantitative imaging technique based on XRF analysis, typically known as x-ray fluorescence computed tomography (XFCT), was developed using monochromatic synchrotron x-rays for elemental analysis of small samples.7, 8, 9, 10, 11, 12, 13 With the recent emergence of various biomedical applications using gold nanoparticles (GNPs), it has been suggested that a benchtop XFCT system can be developed, adopting an ordinary polychromatic x-ray source instead of a synchrotron source, and used for the determination of spatial distribution and concentration of GNPs within small animals (i.e., biodistribution of GNPs) during preclinical studies.14, 15, 16
While virtually all of recent investigations on nonsynchrotron XFCT (Refs. 14, 15, 16, 17, 18, 19) focus on utilizing gold K-shell fluorescence photons (67.0 and 68.8 keV), there is still a chance to perform either XFCT or direct fluorescence imaging of biological samples with gold L-shell fluorescence photons (9.71 and 11.4 keV). Despite their short penetration depth in water/tissue (e.g., ∼0.2 cm of mean free path at 11 keV), gold L-shell fluorescence photons from GNPs can be detected externally after traversing several mean free paths through tissue samples and used for fluorescence imaging. Although its utility is limited to fairly “small” biological samples (< ∼1 cm in diameter or thickness), L-shell XRF-based imaging technique, compared to its K-shell counterpart, offers some distinct merits in many aspects, especially in terms of improving the image resolution and the detection limit. For example, L-shell XRF photons from GNPs are easily produced in abundance using a relatively low power/tube voltage (e.g., less than 100 W and 30–70 kVp) source. Once produced, they can be detected with almost 100% efficiency using typical silicon (Si)-PIN photodiode detectors. Moreover, the scatter background for L-shell XRF photon signal is much lower than that for K-shell XRF signal. Consequently, as demonstrated in recent studies,20, 21 GNPs presented within small samples on the order of ppm can be detected with L-shell XRF analysis in conjunction with benchtop polychromatic x-ray sources. This is in sharp contrast to using K-shell XRF photons from GNPs for quantification, which has resulted in a significantly higher detection limit than the approaches using L-shell XRF photons by as much as 2 orders of magnitude.15, 16, 22
In spite of potential merits as described above, no serious attempt has yet been made, to our knowledge, to perform quantitative L-shell XRF imaging with GNPs. Therefore, this investigation aimed to demonstrate the feasibility of performing it with an ordinary benchtop polychromatic x-ray source and relatively simple experimental setup, while achieving a detection limit comparable to that associated with synchrotron-based systems. Due to the small size of samples used in this investigation, a direct fluorescence imaging technique (e.g., 2D mapping) appeared to be more advantageous than XFCT and, therefore, an image was obtained by direct mapping of properly corrected fluorescence signals. Once fully developed, a highly sensitive benchtop L-shell XRF imaging system like the current one may serve as a simple yet powerful imaging tool for the quantification and localization of GNPs as well as other metal probes presented within small biological samples such as ex vivo tissues and superficial tumors during preclinical small animal studies.
MATERIALS AND METHODS
Experimental setup and measurements
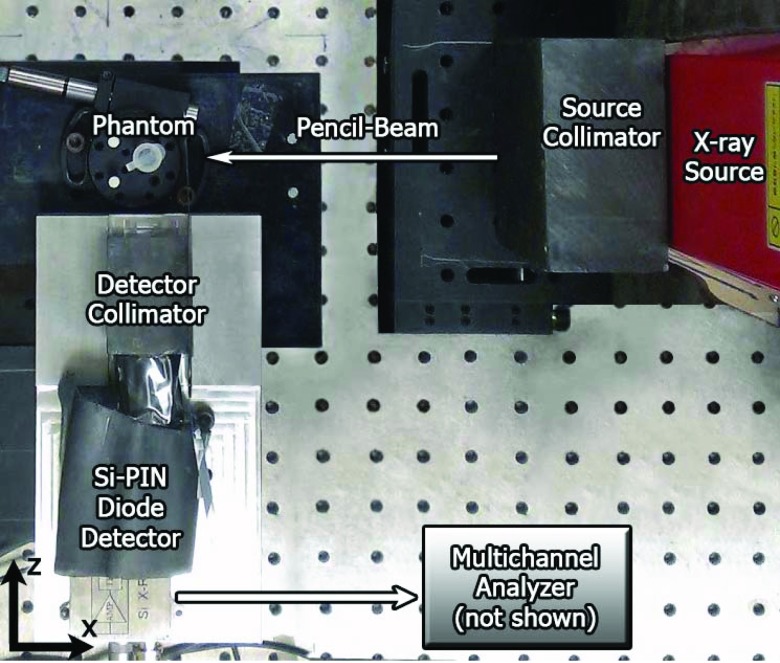
The current experimental set-up for 2D planar XRF imaging consisted of a cylindrical phantom, a benchtop x-ray source, an energy-resolving x-ray detector system, source & detector collimators, and imaging stages (Fig. 1).
Figure 1.
Top-down photograph (in x-z plane) of the current imaging geometry showing all components: x-ray source, source collimator, phantom, detector, and detector collimator. A pencil-beam of x-rays was incident onto the phantom along the negative x-axis.
Phantoms
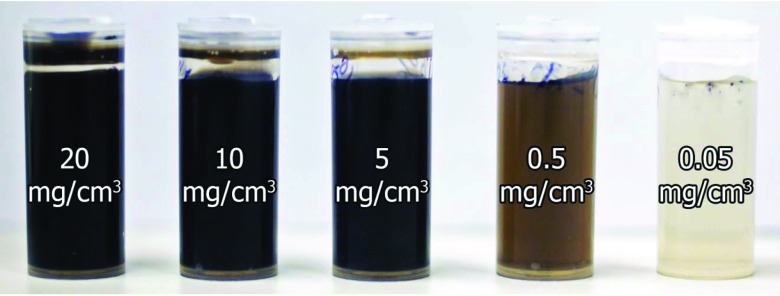
In order to determine the detection limit (i.e., the lowest detectable amount of GNPs), 12-mm-diameter plastic calibration phantoms containing water and GNPs (Aurovist™, Nanoprobes Inc.) at a wide range of concentrations (20, 10, 5, 0.5, 0.05, and 0.005 mg/cm3) were prepared (Fig. 2) using serial dilution and a precision balance. This range of GNP concentrations was chosen based on biologically attainable concentrations, on the order of mg to μg GNPs per cm3 (or gram tissue),23, 24 depending on GNP-specific pharmacokinetics and targeting strategies. An additional phantom was filled with water only (i.e., 0 mg/cm3 GNP concentration).
Figure 2.
Photograph of calibration phantoms filled with GNPs and water solutions (left to right: 20, 10, 5, 0.5, 0.05 mg/cm3). Not pictured: 0.005 mg/cm3 and water-only phantoms.
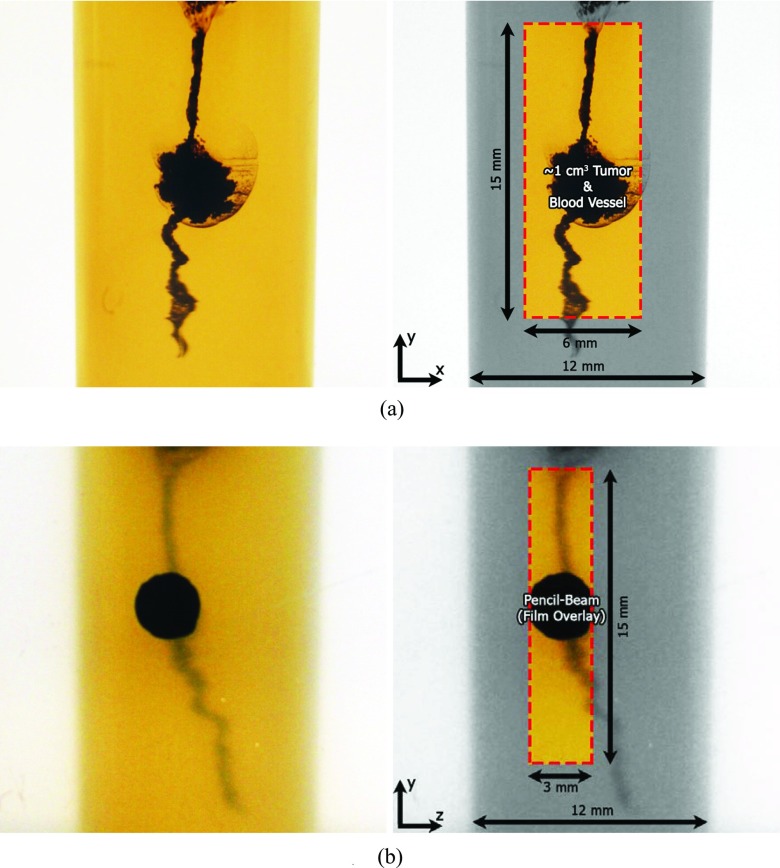
An imaging phantom (Fig. 3) was prepared by filling a plastic container of the same diameter (12 mm) with a gelatin-based, tissue-equivalent gel.25 After the gel solidified, a water solution containing GNPs at a concentration of 20 mg/cm3 was slowly injected into the gel, while pulling the needle from the bottom to the top of the phantom, to create a continuous volume containing the solution. Injection of a larger amount of solution at the approximate center of the phantom, compared to the bottom and top, allowed that region to represent a GNP-laden tumor with a volume of approximately 1 cm3 with simulated blood vessels leading into and out of it.
Figure 3.
Close-up photographs of the current imaging phantom with simulated GNP-laden blood vessel and ∼1 cm3 tumor. Box shows the region of interest that was imaged. (a) The detector's eye view of the phantom (in x-y plane) used for imaging. The pencil-beam of x-rays propagated along the negative x-axis. (b) Beam's eye view (in z-y plane) with overlaid radiochromic film image showing incident pencil-beam of x-rays at one particular vertical (y) position. The detector was located at the left side of the image (along the negative z-axis).
Benchtop x-ray source & XRF detection system
The x-ray source was a tungsten-target microfocus x-ray source (L9631, Hamamatsu Photonics Inc.), operated at 62 kVp and 800 μA (∼50 W). After performing a set of optimization studies at various tube potentials, 62 kVp was found to maximize fluorescence photon production under the current experimental setup while maintaining the maximum beam power of 50 W. A pencil-beam was generated with the aid of a 5-cm-thick lead collimator with a 2.5-mm aperture diameter. The beam was then filtered through 1 mm of aluminum in order to suppress the tungsten Lβ peak (9.67 keV) from the source which would overlap the gold Lα peak (9.71 keV) used for imaging. Due to a slight divergence, the beam diameter was 3 mm at the location of the phantom, as measured using radiochromic film (Gafchromic EBT, ISP Inc.) and shown in Fig. 3b.
A Si-PIN photodiode detector (XR-100CR, Amptek Inc.), placed at 90° with respect to the beam direction, was used to detect the fluorescence/scatter spectra from each phantom. The detector view was restricted using a lead collimator with an aperture diameter of 2.5 mm and thickness of 4 cm.
XRF measurements
The fluorescence signal from each calibration phantom was obtained at a source-to-phantom distance of 22 cm (16 cm from the collimator exit to the phantom surface) and a phantom-to-detector distance of 7 cm (3 cm from the phantom surface to the detector collimator entry). The acquisition time was fixed at 10 min for each calibration phantom. The pencil-beam impinged onto the surface of the phantom closest to the detector. The physical voxel size created by the pencil-beam and detector collimator aperture for direct XRF imaging was determined to be 1.73 × 10⁻² cm3 by calculating the volume created by the intersection of two cylinders of diameters, 3 mm (pencil-beam) and 2.5 mm (detector collimator aperture), respectively. Thus, the mass of GNPs presented in a voxel imaged by the current experimental setup was estimated to be 350, 175, 87.5, 8.75, 0.875, 0.0875, and 0 μg for the calibration phantoms, under the reasonable assumption that GNPs were uniformly distributed throughout the phantoms at concentrations of 20, 10, 5, 0.5, 0.05, 0.005, and 0 mg/cm3, respectively.
After XRF measurements with calibration phantoms, the imaging phantom was placed at the same source-to-phantom distance but located slightly closer (by 3 mm) from the detector in order for the pencil-beam to hit the approximate center of the simulated tumor region, as shown in Fig. 3b. Then, keeping the source and detector stationary, the phantom was translated horizontally (along the beam direction) and vertically, in steps of 0.3 mm, to acquire data from the region of interest (ROI), a 6 mm (horizontal) × 15 mm (vertical) area within the phantom containing the simulated tumor and blood vessels, shown in Fig. 3a. The imaging step size of 0.3 mm resulted in oversampling across the ROI, producing an effective voxel size of 2.70 × 10⁻⁴ cm3 in the final image (∼5.5 μg of GNPs within each voxel at the maximum concentration of 20 mg/cm3). The ROI within the imaging phantom was covered by a total of 1000 voxels during XRF measurements, with an acquisition time of 30 s per voxel.
XRF signal extraction and processing
The spectra obtained from measurements were corrected for detection efficiency (ɛ), accounting for the probability of transmission through the beryllium (Be) window of the detector and the probability of interaction within the silicon detector at a given energy (E):
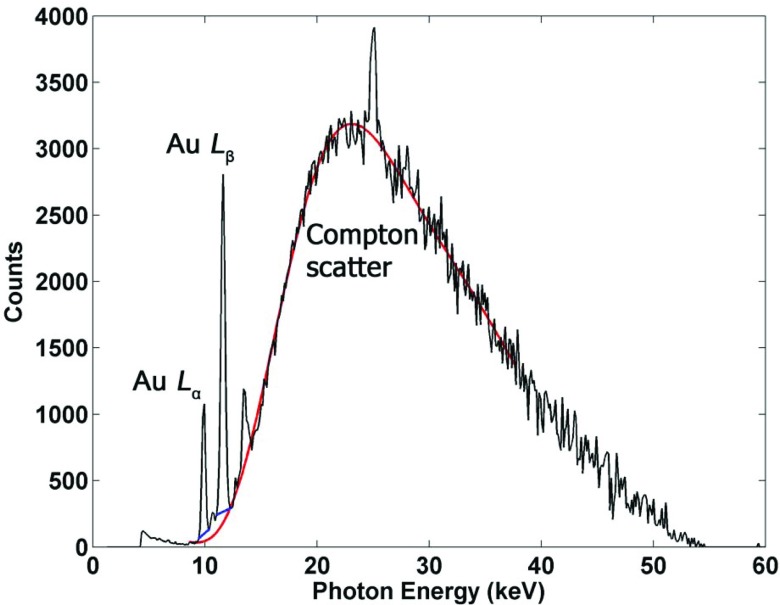
where μ and t are, respectively, the linear attenuation coefficient and the thickness of each material. The total signal from the gold fluorescence peaks of interest (9.71 and 11.4 keV) was then extracted from the background using linear fits based on their respective energy windows and added together to extract the net fluorescence peak signal Pnet (Fig. 4).
Figure 4.
Typical fluorescence and scatter spectrum acquired from Si-PIN detector, after corrections for detection efficiency, showing prominent gold L-shell fluorescence peaks from GNPs, as well as the Compton scatter background. Additional peaks shown in this figure are due to other impurities presented in the current experimental setup. The linear fits used to extract fluorescence signal are shown in addition to the 10th order polynomial fit applied to the Compton scatter used for correcting the signal.
The absorption of source and fluorescence photons within the phantom should be taken into account to accurately determine the amount of GNPs within the ROI. The degree of Compton scatter measured by the detector can be taken as an internal gauge of the attenuation properties of the sample and used to correct for self-absorption of fluorescence photons and also for attenuation of source photons as they travel through the sample.26 Specifically, as implemented in previous XRF studies,20, 27 the signal from the Compton scatter peak is used to take the ratio of net fluorescence signal to Compton scatter to correct for attenuation:
where PFS is the corrected fluorescence signal, Pnet is the net fluorescence peak signal, and PC is the Compton peak signal. This fluorescence-to-Compton scatter normalization corrects for loss of source photon fluence in the beam direction and attenuation of fluorescence photons. This method takes advantage of the fact that the Compton scatter is approximately independent of the atomic number (Z) of medium in this energy range. In order to implement this technique, an empirical 10th order polynomial fit was applied to the entire Compton scatter background (Fig. 4). This fit was used to generate the Compton peak signal PC by adding the total signal in the energy windows containing the Compton peak. Note the Compton scatter background could alternatively be fit to at least a semiempirical function reasonably accounting for the expected angular scatter profile of incident x-rays. Although not attempted in the current feasibility study, this approach may be pursued in future investigations.
The peak extraction algorithm was also used to discriminate actual fluorescence signal from noise due to statistical fluctuations. This was done by only considering peak signals that were larger than 1.96σb (corresponding to the 95% confidence level), where σb is the standard deviation of the background, and any signals below this level were regarded as noise.
RESULTS
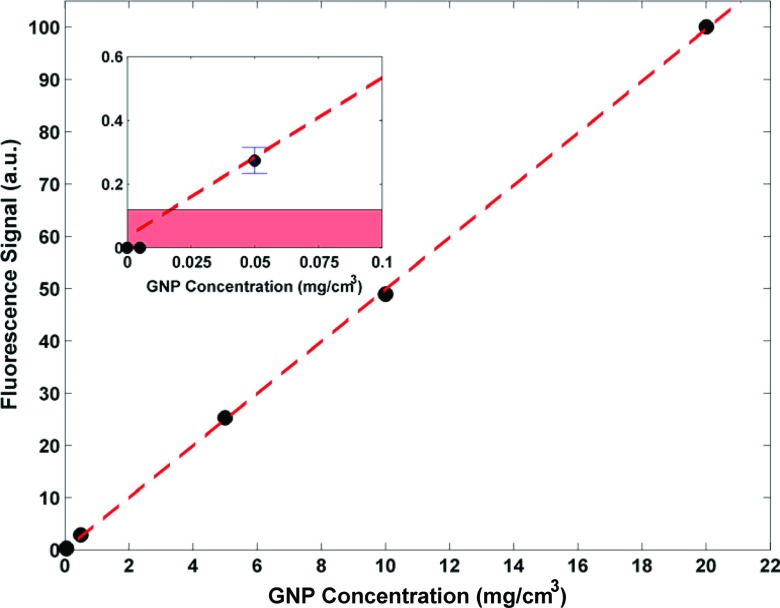
The data from the calibration phantom measurements were used to generate a plot showing the corrected fluorescence signal as a function of GNP mass within the imaged voxel. Figure 5 shows the result of the calibration phantom measurements demonstrating the linearity (R2 = 0.9999) between fluorescence signal and contained GNP mass. The inset shows the data points at very low GNP concentrations: 0 (water), 0.005, and 0.05 mg/cm3. As shown, no statistically significant fluorescence signals were detected from the water and 0.005 mg/cm3 phantoms, suggesting that the detection limit of the system was somewhere between 0.05 and 0.005 mg/cm3. The shaded region in the inset of Fig. 5 illustrates levels of signal that cannot be interpreted as true signal above the background noise (with a 95% confidence level). The intersection of the upper limit of the shaded region and the line of best fit represents the detection limit of the system, which was calculated to be ∼0.35 μg of GNPs per imaged voxel within the calibration phantom. At such a low concentration of GNPs (0.02 mg/cm3), the statistical noise blurs the fluorescence peak below the 95% confidence level, i.e., the signal would be less than 1.96σb. Overall, the currently achievable detection limit highlights the markedly improved sensitivity attainable with an L-shell XRF-based system, compared to that associated with its K-shell counterpart.
Figure 5.
Data acquired from calibration phantoms, showing a linear relationship between fluorescence signal (arbitrary units) and GNP concentration (mg/cm3). The corresponding GNP mass per 1.73 × 10⁻² cm3 voxel for each data point (20, 10, 5, 0.5, 0.05, 0.005, and 0 mg/cm3) is approximately 350, 175, 87.5, 8.75, 0.875, 0.0875, and 0 μg assuming uniform distribution of GNPs. Error bars for data points are much smaller than the size of the data symbols. (Inset) The intersection of the best-fit line and the border of the shaded region highlights the detection limit of the system (GNP concentration of ∼0.02 mg/cm3, corresponding to ∼0.35 μg of GNP within the 1.73 × 10⁻² cm3 voxel).
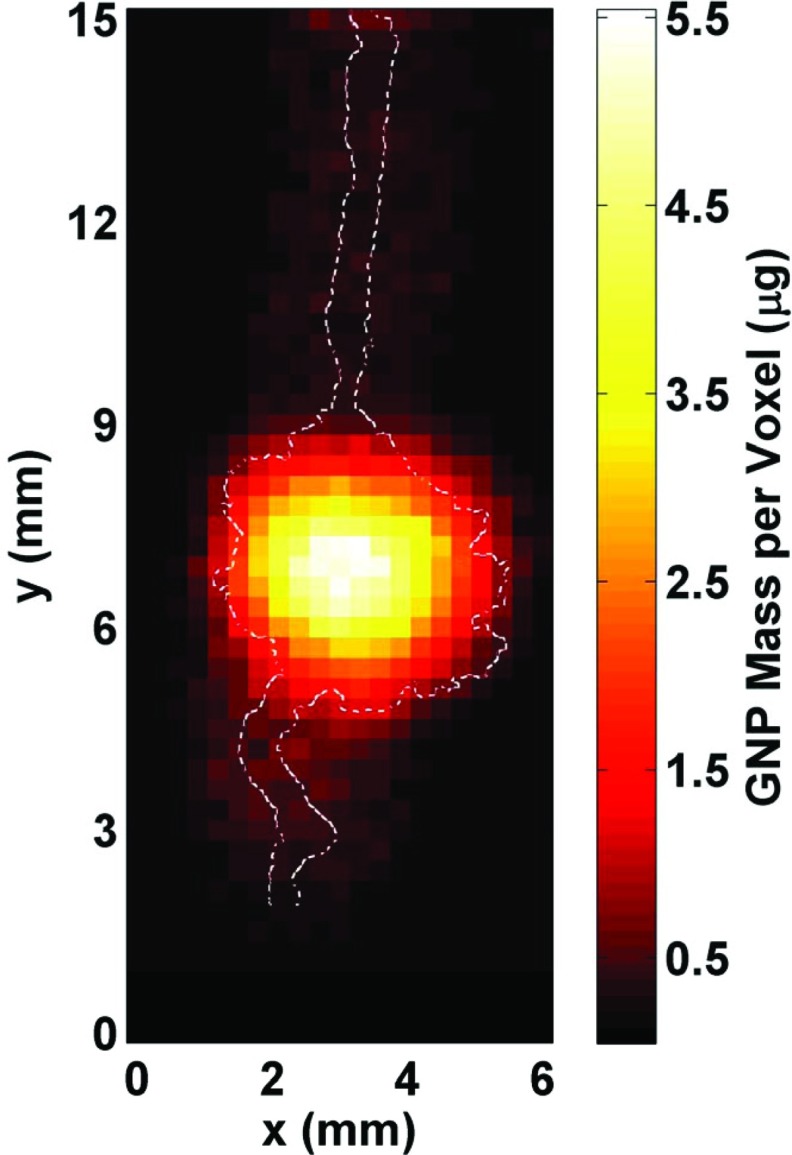
In order to demonstrate the ability to image and quantify the amount of GNPs within the ROI, a 2D XRF map (Fig. 6) was generated using the imaging phantom. Unlike the optical images shown in Fig. 3, the varying GNP concentration within the phantom is apparent in this 2D XRF image. With the reasonable assumption that an imaging voxel containing a maximum GNP concentration of 20 mg/cm3 would be responsible for the brightest pixel in the image, the estimated mass of GNPs within the ROI ranged from 0.5 to 5.5 μg per imaged voxel. Overall, the image shows a highly heterogeneous GNP distribution within the phantom, indicating diffusion of the injected GNP solution throughout the gel. The highest levels of GNPs were present around the central region of the mimicked tumor and the GNP concentration levels were at the lowest around the tumor periphery and the mimicked blood vessels.
Figure 6.
2D fluorescence map of the region of interest (6 mm horizontal × 15 mm vertical) within the phantom generated from the processed data. The GNP distribution (in mass per 2.70 × 10⁻⁴ cm3 voxel) within the simulated tumor region and blood vessels is shown, with the maximum value of ∼5.5 μg corresponding to a GNP concentration of 20 mg/cm3. The outline of the irradiated GNP-containing structures is overlaid on the fluorescence map, showing that there was a reasonable match between the images around the tumor region whereas there was a worsening of the spatial resolution for low concentration regions (the simulated blood vessels) primarily due to increased uncertainty in the fluorescence signal (i.e., insufficient data acquisition time).
DISCUSSION
L-shell XRF imaging, as shown in this study using a benchtop x-ray source, appears to be a feasible method for imaging and quantification of GNPs and also likely other high-Z metal probes (e.g., platinum, bismuth, etc.) presented in subcentimeter-sized biological samples, offering orders of magnitude more sensitivity than its K-shell counterpart. Future investigation on this technique will have to include further benchmarking against more established synchrotron-based XRF imaging techniques as well as further optimization of the current imaging setup. Once thoroughly benchmarked and optimized, a benchtop L-shell XRF imaging system may offer advantages in various aspects (e.g., accessibility, imaging cost, sample handling, multiplexed imaging, etc.) over its synchrotron-based counterpart and/or other optical and x-ray imaging tools.
Since its aim was to demonstrate only the feasibility, the current investigation was performed with a somewhat restricted and preliminary imaging setup which has some room for further improvement with regard to scan time, detection limit, and image resolution. The imaging was performed with a relatively low power (∼50 W) source and a single detector. A more powerful source and an array of detectors would shorten the scan time substantially. In fact, a drastic reduction in the scan time by up to a factor of 10 or more is easily conceivable, considering an immediate availability of both microfocus and conventional x-ray sources operating on the order of several 100 W up to 1 kW. Note that these high power x-ray sources might not allow a perfectly benchtop footprint of an L-shell XRF imaging system but they will still offer all other benefits of a nonsynchrotron system as inferred from this study. Especially, an adoption of a high power source will be necessary for in vivo L-shell XRF imaging of small superficial tumors (< ∼1 cm in diameter and depth) during preclinical animal studies. To obtain more detailed images of the sample (e.g., 3D image), it is also technically feasible to perform a full XFCT scan of the sample using a cone-beam source without any considerable increase in the scan time,16 as opposed to pencil-beam-based direct XRF imaging. In order to lower the detection limit further, a more sophisticated detector such as a silicon drift detector can be deployed, which would offer benefits such as lower noise and improved energy resolution, thereby facilitating fluorescence peak extraction from the background. Tailoring of the incident x-ray spectrum via filtration can also improve the fluorescence signal-to-background. A smaller pencil-beam would improve image resolution and potentially lower the detection limit as well so long as it helps increase the fluorescence signal-to-background ratio. The image resolution can also be improved by using detector collimation with a smaller aperture. When pursuing future work, it is important to consider the interplay among scan time, detection limit, and image resolution.
Due to the nature of 2D planar imaging, as opposed to rotational CT, there are a few fundamental drawbacks that prevent the current experimental setup from accomplishing a more effective acquisition of some spatial information. To overcome these difficulties, a stereoscopic detection system may be implemented with two opposing detectors. That way, for example, the locations of XRF photon sources (i.e., GNPs) can be determined with better accuracy and efficiency, enabling the implementation of more sophisticated attenuation correction schemes for more precise quantification and imaging. Another potential issue hampering accurate localization of GNPs is the production of secondary fluorescence due to scattered photons. As mentioned before, a pencil-beam setup with tighter collimation can minimize this to a certain extent. In addition, since it is relatively easy to create a low energy quasi-monochromatic x-ray beam (e.g., 10–20 keV) using various crystals, the incident x-ray source spectrum could be tailored to contain most of photons in the spectrum just above the L-edge of gold. Clearly, this would almost completely eliminate the issue, as most of the scattered photons would have energies below the L-edge and would not be able to induce fluorescence x-ray production from GNPs.
CONCLUSIONS
This investigation demonstrated the feasibility to simultaneously determine the spatial distribution and the local concentration of GNPs within subcentimeter-sized biological samples using an L-shell XRF imaging technique implemented with a benchtop polychromatic source. With a more optimized experimental setup and thorough benchmarking of the results, a benchtop L-shell XRF imaging system like the current one will become a powerful and viable alternative to synchrotron-based XRF imaging or other x-ray and optical imaging tools. It can then be used for ex vivo analysis of tissues loaded with metal probes such as GNPs on the order of ppm or lower as well as for in vivo imaging of such probes distributed within superficial tumors during preclinical animal studies.
ACKNOWLEDGMENTS
This investigation was supported by the NIH/NCI Grant No. R01CA155446 and also in part by the NSF Graduate Research Fellowship DGE-1148903.
References
- Roberts W. M., “Estimation of strontium in animal bone using x-ray fluorescence analysis,” Nature (London) 183, 887–888 (1959). 10.1038/183887a0 [DOI] [PubMed] [Google Scholar]
- Alexander G. V., “An x-ray fluorescence method for the determination of calcium, potassium, chlorine, sulfur, and phosphorus in biological tissues,” Anal. Chem. 37, 1671–1674 (1965). 10.1021/ac60232a010 [DOI] [PubMed] [Google Scholar]
- Hall T., “X-ray fluorescence analysis in biology,” Science 134, 449–455 (1961). 10.1126/science.134.3477.449 [DOI] [PubMed] [Google Scholar]
- Nie L. H., Sanchez S., Newton K., Grodzins L., Cleveland R. O., and Weisskopf M. G., “In vivo quantification of lead in bone with a portable x-ray fluorescence system—Methodology and feasibility,” Phys. Med. Biol. 56, N39–N51 (2011). 10.1088/0031-9155/56/3/N01 [DOI] [PMC free article] [PubMed] [Google Scholar]
- Estevam M. and Appoloni C. R., “Use of portable x-ray fluorescence (PXRF) in vivo as an alternative technique for the assessment of iron levels in patients with thalassemia and hemochromatosis,” Health Phys. 104, 132–138 (2013). 10.1097/HP.0b013e3182667721 [DOI] [PubMed] [Google Scholar]
- Matsukiyo H., Watanabe M., Sato E., Osawa A., Enomoto T., Nagao J., Abderyim P., Aizawa K., Tanaka E., Mori H., Kawai T., Ehara S., Sato S., Ogawa A., and Onagawa J., “X-ray fluorescence camera for imaging of iodine media in vivo,” Radiol. Phys. Technol. 2, 46–53 (2009). 10.1007/s12194-008-0042-1 [DOI] [PubMed] [Google Scholar]
- Boisseau P., “Determination of three dimensional trace element distributions by the use of monochromatic x-ray microbeams,” Ph.D. thesis (Massachusetts Institute of Technology, 1986). [Google Scholar]
- Cesareo R. and Mascarenhas S., “A new tomographic device based on the detection of fluorescent x-rays,” Nucl. Instrum. Methods Phys. Res. A 277, 669–672 (1989). 10.1016/0168-9002(89)90802-4 [DOI] [Google Scholar]
- Hogan J. P., Gonsalves R. A., and Krieger A. S., “Fluorescent computer tomography: A model for correction of x-ray absorption,” IEEE Trans. Nucl. Sci. 38, 1721–1727 (1991). 10.1109/23.124168 [DOI] [Google Scholar]
- Yuasa T., Akiba M., Takeda T., Kazama M., Hoshino A., Watanabe Y., Hyodo K., Dilmanian F. A., Akatsuka T., and Itai Y., “Reconstruction method for fluorescent x-ray computed tomography by least-squares method using singular value decomposition,” IEEE Trans. Nucl. Sci. 44, 54–62 (1997). 10.1109/23.554824 [DOI] [Google Scholar]
- Simionovici A., Chukalina M., Schroer C., Drakopoulos M., Snigirev A., Snigireva I., Lengeler B., Janssens K., and Adams F., “High-resolution x-ray fluorescence microtomography of homogeneous samples,” IEEE Trans. Nucl. Sci. 47, 2736–2740 (2000). 10.1109/23.901180 [DOI] [Google Scholar]
- Schroer C., “Reconstructing x-ray fluorescence microtomograms,” Appl. Phys. Lett. 79, 1912–1914 (2001). 10.1063/1.1402643 [DOI] [Google Scholar]
- La Rivière P. J., “Approximate analytic reconstruction in x-ray fluorescence computed tomography,” Phys. Med. Biol. 49, 2391–2405 (2004). 10.1088/0031-9155/49/11/019 [DOI] [PubMed] [Google Scholar]
- Cheong S. K., Jones B. L., Siddiqi A. K., Liu F., Manohar N., and Cho S. H., “X-ray fluorescence computed tomography (XFCT) imaging of gold nanoparticle-loaded objects using 110 kVp x-rays,” Phys. Med. Biol. 55, 647–662 (2010). 10.1088/0031-9155/55/3/007 [DOI] [PubMed] [Google Scholar]
- Jones B. L. and Cho S. H., “The feasibility of polychromatic cone-beam x-ray fluorescence computed tomography (XFCT) imaging of gold nanoparticle-loaded objects: A Monte Carlo study,” Phys. Med. Biol. 56, 3719–3730 (2011). 10.1088/0031-9155/56/12/017 [DOI] [PubMed] [Google Scholar]
- Jones B. L., Manohar N., Reynoso F., Karellas A., and Cho S. H., “Experimental demonstration of benchtop x-ray fluorescence computed tomography (XFCT) of gold nanoparticle-loaded objects using lead- and tin-filtered polychromatic cone-beams,” Phys. Med. Biol. 57, N457–N467 (2012). 10.1088/0031-9155/57/23/N457 [DOI] [PMC free article] [PubMed] [Google Scholar]
- Bazalova M., Kuang Y., Pratx G., and Xing L., “Investigation of x-ray fluorescence computed tomography (XFCT) and K-edge imaging,” IEEE Trans. Med. Imaging 31, 1620–1627 (2012). 10.1109/TMI.2012.2201165 [DOI] [PubMed] [Google Scholar]
- Kuang Y., Pratx G., Bazalova M., Meng B., Qian J., and Xing L., “First demonstration of multiplexed x-ray fluorescence computed tomography (XFCT) imaging,” IEEE Trans. Med. Imaging 32, 262–267 (2013). 10.1109/TMI.2012.2223709 [DOI] [PubMed] [Google Scholar]
- Kuang Y., Pratx G., Bazalova M., Qian J., Meng B., and Xing L., “Development of XFCT imaging strategy for monitoring the spatial distribution of platinum-based chemodrugs: Instrumentation and phantom validation,” Med. Phys. 40, 030701 (7pp.) (2013). 10.1118/1.4789917 [DOI] [PMC free article] [PubMed] [Google Scholar]
- Ricketts K., Castoldi A., Guazzoni C., Ozkan C., Christodoulou C., Gibson A. P., and Royle G. J., “A quantitative x-ray detection system for gold nanoparticle tumour biomarkers,” Phys. Med. Biol. 57, 5543–5555 (2012). 10.1088/0031-9155/57/17/5543 [DOI] [PubMed] [Google Scholar]
- Manohar N., Reynoso F., and Cho S. H., “Feasibility of direct L-shell fluorescence imaging of gold nanoparticles using a benchtop x-ray source,” Med. Phys. 39, 3987–3988 (2012). 10.1118/1.4736269 [DOI] [PMC free article] [PubMed] [Google Scholar]
- Wu D., Li Y., Wong M. D., and Liu H., “A method of measuring gold nanoparticle concentrations by x-ray fluorescence for biomedical applications,” Med. Phys. 40, 051901 (10pp.) (2013). 10.1118/1.4798966 [DOI] [PubMed] [Google Scholar]
- Hainfeld J. F., Slatkin D. N., and Smilowitz H. M., “The use of gold nanoparticles to enhance radiotherapy in mice,” Phys. Med. Biol. 49, N309–N315 (2004). 10.1088/0031-9155/49/18/N03 [DOI] [PubMed] [Google Scholar]
- Qian X., Peng X. H., Ansari D. O., Yin-Goen Q., Chen G. Z., Shin D. M., Yang L., Young A. N., Wang M. D., and Nie S., “In vivo tumor targeting and spectroscopic detection with surface-enhanced Raman nanoparticle tags,” Nat. Biotechnol. 26, 83–90 (2008). 10.1038/nbt1377 [DOI] [PubMed] [Google Scholar]
- Fong P. M., Keil D. C., Does M. D., and Gore J. C., “Polymer gels for magnetic resonance imaging of radiation dose distributions at normal room atmosphere,” Phys. Med. Biol. 46, 3105–3113 (2001). 10.1088/0031-9155/46/12/303 [DOI] [PubMed] [Google Scholar]
- Andermann G. and Kemp J. W., “Scattered x-rays as internal standards in x-ray emission spectroscopy,” Anal. Chem. 30, 1306–1309 (1958). 10.1021/ac60140a001 [DOI] [Google Scholar]
- Bui C., Confalonieri L., and Milazzo M., “Use of Compton scattering in quantitative XRF analysis of stained glass,” Int. J. Rad Appl. Instrum. [A] 40, 375–380 (1989). 10.1016/0883-2889(89)90200-1 [DOI] [Google Scholar]


