

Abstract
Education, occupation, premorbid intelligence and brain size are surrogate markers for cognitive reserve. Whether these markers have biological influence on Alzheimer disease (AD) pathology is not known. We thus aimed to investigate the effect of cognitive reserve proxies on longitudinal change of AD biomarkers. A total of 819 participants with normal cognition (NC), mild cognitive impairment (MCI) and mild AD were enrolled in the Alzheimer’s Disease Neuroimaging Initiative and followed up with repeated measures of CSF, PET and MRI biomarkers. Generalized estimating equations were employed to assess whether biomarker rates of change were modified by reserve proxies. CSF Aβ42 decline was slower in NC participants with higher cognitive reserve indexed by education, occupation and American National Adult Reading Test (ANART). The decline of [18F] fluorodeoxyglucose PET uptake was slower in AD participants with better performance on the ANART. Education, occupation and ANART did not modify the rates of MRI hippocampal atrophy in any group. These findings remained unchanged after accounting for APOE 4, longitudinal missing data and baseline cognitive performance. Higher levels of reserve markers may slow the rate of amyloid deposition before cognitive impairment and preserve glucose metabolism at the dementia stage over the course of AD pathological progression.
Keywords: cognitive reserve, Alzheimer disease, aging, biomarker, longitudinal study
Introduction
Reserve is a hypothetical construct proposed to explain the disjunction between the burden of Alzheimer’s disease (AD) pathology and the degree of cognitive dysfunction in some older people.1 Two kinds of reserve have been proposed: brain reserve and cognitive reserve; here we use cognitive reserve to refer to both types.2
Education, a common proxy of cognitive reserve, is robustly and consistently associated with a lower risk of AD across studies.3–5 Similar findings were also reported in studies using occupation, premorbid intelligence or brain size as a reserve proxy.3, 6–9 Once cognitive impairment begins, people with higher reserve appear to have faster cognitive deterioration.10–12 It is assumed that by the time dementia is diagnosed, more AD pathology has accumulated in people with higher reserve, and therefore accelerated clinical deterioration occurs. Cognitive reserve may reduce the risk of symptomatic expression of AD or modulate the course of cognitive decline but reserve markers per se supposedly have no biological effect on AD pathology and thus are independent of AD pathological progression.13
A recent study from the Alzheimer’s Disease Neuroimaging Initiative (ADNI) has shown stage-dependent trajectories of three biomarkers of AD pathology: CSF Aβ42, [18F] fluorodeoxyglucose PET (FDG-PET) uptake and MRI hippocampal volume;14 but how these pathology markers change over time in relation to individual reserve marker status is not known. In this study we aimed to examine the influence of cognitive reserve markers, including education, occupation, American National Adult Reading Test (ANART) and intracranial volume (ICV), on longitudinal change of AD pathology in ADNI.
Methods
Study Population
A total of 819 research participants (NC: 229; MCI: 397; AD: 193) were enrolled in ADNI from 59 centers in the United States and Canada during 2005–2007, though the actual number of participants finally entered into our longitudinal analyses varied by AD biomarkers (CSF: 103, PET: 455, MRI: 814). ADNI is supported by the NIH, private pharmaceutical companies, and non-profit organizations, with the primary goal of examining the utility of serial biomarker measurement in AD and pre-AD stages. Full inclusion/exclusion criteria are detailed at www.adni-info.org. Briefly, screening criteria for entry into the study included the Mini-Mental State Examination score (MMSE), Clinical Dementia Rating scale and an education-adjusted cutoff score on delayed recall of one paragraph from the Logical Memory subtest of the Wechsler Memory Scale-Revised.15 All participants were recruited between the ages of 55 and 90, and had at least 6 years of education and a study partner able to provide an independent evaluation of functioning. Specific psychoactive medications or other neurological disorders were excluded. The study procedures were approved by institutional review boards of all participating institutions.
Follow-up Timeline
Detailed schedules of assessment for NC, MCI and AD are posted in the general procedure manual on the ADNI website: http://www.adni-info.org/Scientists/Pdfs/ADNI_Protocol_Extension_A2_091908.pdf Briefly, after the baseline visit, subsequent visits took place at 6 or 12 month intervals in person. The variability in the timing of visits was assumed to be negligible and there were only certain values for our time variable (e.g. 6, 12, 24, 36 months).
Biomarkers of AD Pathology
CSF proteins
CSF samples were collected in the morning after overnight fast, shipped to the University of Pennsylvania Alzheimer’s Disease Biomarker Laboratory and analyzed using a standardized protocol.16 Aβ42 was measured (pg/ml) in each of the CSF aliquots using the multiplex xMAP Luminex (Luminex Corp, Austin, TX) platform with Innogenetics (INNO-BIA AlzBio3; Ghent, Belgium; for research use-only reagents) immunoassay kit-based reagents. Over half of the entire study population had a least one CSF sample (416/819, 51%).
FDG-PET
The protocol to acquire ADNI PET data at sites nationwide is detailed at www.loni.ucla.edu/ADNI/Data/ADNI_Data.shtml, and methods for FDG-PET analysis have been described previously.17 Briefly, PET images were acquired 30–60 minutes postinjection. Images were averaged, spatially aligned, interpolated to a standard voxel size, intensity normalized and smoothed to a common resolution of 8-mm full width at half maximum. PET volumes were intensity normalized to the cerebellar vermis and the pons defined by the Montreal Neurological Institute template. Mean FDG uptake was extracted and averaged from five predefined ROIs (right/left temporal gyrus, right/left angular gyrus and posterior cingulate gyrus) for each participant. About 55% (455/819) of all participants had at least one PET scan.
MRI hippocampal volume
The 1.5-T MRI protocol was described elsewhere,18 and was standardized across all sites: 2 T1-weighted MRI scans, using a sagittal volumetric magnetization-prepared rapid gradient echo sequence, with an echo of 4 msec, repetition time of 9 msec, flip angle of 8°, and acquisition matrix size of 256 × 256 × 166 in the x-, y- and z-dimensions with a nominal voxel size of 0.94 × 0.94 × 1.2 mm. The images were aligned, skull-stripped, and segmented and passed rigorous quality control checks. FreeSurfer software (http://surfer.nmr.mgh.harvard.edu) was applied to obtain bilateral hippocampal volumes in mm3 from this segmentation. Nearly all participants had at least one MRI scan (814/819, 99%).
APOE 4 allele
Blood samples at baseline were collected and APOE genotyping was carried out at the University of Pennsylvania Alzheimer’s Disease Biomarker Laboratory. APOE 4 gene carriers were participants who had at least one APOE 4 allele.
Cognitive reserve markers
Education
The number of completed years of formal education was recorded. Educational attainment in the entire ADNI population was divided into tertiles: high (> 17 years), intermediate (15–17 years) and low (< 15 years) levels.
Occupation
Occupation types were recorded and classified into three levels: I. professional or managerial, II. skilled and III. partly-skilled or unskilled occupations according to The National Statistics Socio-economic Classification.19 These three levels were used to approximate reserve status.
Premorbid intelligence
American National Adult Reading Test (ANART) was used to estimate premorbid intelligence.20 Participants were tested by asking to pronounce a total of 50 English words that did not follow regular grapheme-phoneme and stress rules. The number of mispronounced words was then recorded. More errors predict lower premorbid intelligence. ANART in the entire ADNI population was stratified into tertiles: high (< 8 errors), intermediate (8–16 errors) and low (> 16 errors) reserve levels.
Intracranial volume
Intracranial volume (ICV) was estimated by the automated MRI method, which combined three tissue classes of segmentation: gray matter, white matter and CSF spaces. The ICV (cm3) information is available in the ADNI image database. ICV in the entire ADNI population was stratified into tertiles: high (> 1626 cm3), intermediate (1475–1626 cm3) and low (< 1475 cm3) reserve levels.
Statistical Analyses
Biomarker rates of change
Participants with repeated measures were entered into analyses. We delineated biomarker trajectories and used repeated measures linear regression (an exchangeable working within subject correlation model via a generalized estimating equation, GEE)21 to estimate average rates of change in CSF and imaging biomarkers. Time-varying biomarkers were treated as the outcome and modeled by time and baseline age in the regression. Three diagnostic groups (NC, MCI and AD) were analyzed separately. We used the visit month rather than continuous time, and the unit of time was years in the models.
Longitudinal effect of reserve markers
We used tertiles of reserve markers for primary analyses and assumed the relationships between reserve markers and biomarker changes to be linear without treating the 3-level variable as a categorical variable. We further conducted stratified analyses to confirm that the linearity assumption was generally not violated. To ensure that the longitudinal effect of reserve markers, if any, was not through baseline differences, we first examined the associations between reserve markers and baseline biomarkers in multivariable linear regression models adjusting for age and sex. Each reserve marker as well as its interaction with time (reserve marker × time) was then entered into the GEE models of biomarkers in NC, MCI and AD. Coefficients of the interaction terms reflected the direction and magnitude of how cognitive reserve markers modified biomarker rates of change at different stages.
Longitudinal missing data
Several baseline features have been identified as missing data predictors during follow-up.22 Revised Longitudinal effect of reserve 0924.docx - We examined the associations between reserve markers and missing data predictors by general linear models to ensure that the effect of reserve markers on biomarker change was not confounded by missing data.
Sensitivity analyses
APOE 4 carriers are predisposed to develop AD and a previous study from ADNI also demonstrated that APOE 4 accelerated hippocampal atrophy in MCI and AD.14 Therefore, we included APOE 4 carrier status in GEE models to test the robustness of any reserve marker effect. In addition to primary analyses using stratified reserve marker levels, we also used original continuous measures (e.g. years of education) to confirm that the statistical significance was not due to artificial stratification.
All statistical analyses and graphics were performed in R version 2.11.1. All tests of statistical significance were conducted at the two-tailed alpha level of 0.05.
Results
Trends of decreasing cognitive function, reserve marker levels and AD biomarkers from NC to MCI to AD characterized the inter-group difference at baseline in ADNI (Table 1). After adjusting for age and sex, ICV correlated with MRI hippocampal volume in all diagnostic groups while ANART was associated with hippocampal volume only in AD; otherwise, reserve markers were independent of CSF and imaging biomarkers at baseline. ICV was thus not included in the analysis of MRI hippocampal change. Except for a gender difference in ICV in FDG-PET follow-ups among cognitively normal participants, missing data predictors were not significantly associated with reserve markers.
Table 1.
Baseline characteristics of 819 participants in ADNI
| ADNI diagnostic group | |||
|---|---|---|---|
|
| |||
| NC | MCI | AD | |
| Sample size | 229 | 397 | 193 |
|
| |||
| Mean age, y (SD) | 75.1 (5.0) | 74.0 (7.5) | 74.6 (7.5) |
| M : F, n | 119 : 110 | 256 : 141 | 102 : 91 |
| MMSE score, mean (SD) | 29.1 (1.0) | 27.0 (1.8) | 23.3 (2.1) |
| ADAS-cog, mean (SD) | 6.2 (2.9) | 11.5 (4.4) | 18.6 (6.3) |
| APOE 4 carrier, n (%) | 61(26.6) | 212 (53.4) | 127 (65.8) |
|
| |||
| Reserve proxy | |||
| Education, y (SD) | 16.0 (2.9) | 15.7 (3.0) | 14.7 (3.1) |
| Occupation, n (%) | |||
| I | 138 (60.3) | 190 (47.9) | 75 (38.9) |
| II | 54 (23.6) | 115 (29.0) | 59 (30.6) |
| III | 37 (16.2) | 92 (23.2) | 59 (30.6) |
| ANART error, n (SD) | 9.5 (8.8) | 13.6 (9.9) | 15.8 (10.0) |
| Intracranial volume, cm3 (SD) | 1540 (158) | 1570 (169) | 1550 (184) |
|
| |||
| Mean number of assessments (SD) | |||
| CSF* | 3 (n=35) | 3 (n=52) | 3 (n=16) |
| PET | 3.7 (1.9) (n=133) | 4.5 (2.0) (n=224) | 3.3 (1.1) (n=98) |
| MRI | 3.9 (1.1) (n=228) | 4.3 (1.4) (n=393) | 3.2 (1.0) (n=193) |
|
| |||
| Mean biomarker values | |||
| CSF Aβ42, pg/ml | 210.1 (n=35) | 159.9 (n=51) | 139.6 (n=16) |
| FDG-PET ROIs, normalized intensity | 1.28 (n=103) | 1.20 (n=203) | 1.08 (n=97) |
| MRI hippocampal volume, mm3 | 3633 (n=228) | 3233 (n=393) | 2895 (n=193) |
ADNI: Alzheimer’s Disease Neuroimaging Initiative; NC: normal cognition; MCI: mild cognitive impairment; AD: Alzheimer’s disease; Occupation: I: professional/managerial; II: skilled; III: partly skilled/unskilled. ANART: American national adult reading test; MMSE: mini-mental state examination; ADAS-cog: Alzheimer’s disease assessment scale- cognitive subscale; FDG-PET ROIs: fludeoxyglucose F18- PET region-of-interest. *We restrict to only those included in the longitudinal analysis. Subjects with values that were re-calibrated to the baseline measurement could be used in the longitudinal analyses, which made the number of CSF assessment uniformly 3.
Cognitive reserve markers including education, occupation and ANART significantly modified the rates of CSF Aβ42 change in cognitively normal participants (education: p=0.03; occupation: p=0.01; ANART: p=0.002) (Table 2). People with higher levels of reserve markers had slower rates of CSF Aβ42 decline. CSF Aβ42 trajectories of high, intermediate and low cognitive reserve marker levels were modeled for participants at age 75 (Figure 1A to C). Further analyses of the NC group with repeated CSF studies (n = 35) showed that education levels were associated with occupation and ANART.
Table 2.
Coefficients of cognitive reserve and biomarker rate interactions
| Coefficient of (reserve × time)
|
||||
|---|---|---|---|---|
| Reserve proxy | Biomarker | NC | MCI | AD |
| Education | CSF Aβ42 | 4.39* | −5.9 × 10⁻² | 2.43† |
| FDG-PET | 2.15 × 10⁻³ | −4.2 × 10⁻⁴ | 6.31 × 10⁻³ | |
| MRI hippocampal volume | −4.60 | 6.21† | 3.04 | |
|
| ||||
| Occupation | CSF Aβ42 | 4.78* | −2.1 × 10⁻² | −0.3 |
| FDG-PET | 1.77 × 10⁻³ | −3.29 × 10⁻⁴ | 3.43 × 10⁻³ | |
| MRI hippocampal volume | −3.49 | 1.27 | 3.40 | |
|
| ||||
| ANART | CSF Aβ42 | 6.08* | 0.44 | 2.12 |
| FDG-PET | 6.68 × 10⁻³ | −1.48 × 10⁻³ | 2.05 × 10⁻²* | |
| MRI hippocampal volume | −2.26 | 2.33 | −1.25 | |
|
| ||||
| ICV | CSF Aβ42 | 2.76 | −1.43 | 1.67 |
| FDG-PET | 3.22 × 10⁻³ | 5.97 × 10⁻³ | −1.53 × 10⁻³ | |
NC: normal cognition; MCI: mild cognitive impairment; AD: Alzheimer’s disease; FDG-PET: [18F] fluorodeoxyglucose PET; ANART: American national adult reading test; ICV: intracranial volume;
p < 0.05 or the rate of change is significantly modified by reserve markers;
p < 0.05 only appears when reserve marker is stratified into 3 levels but disappears when using continuous variables, e.g. years of education. Positive coefficients indicate that the biomarker decline is slower in participants with higher levels of reserve markers.
Figure 1.
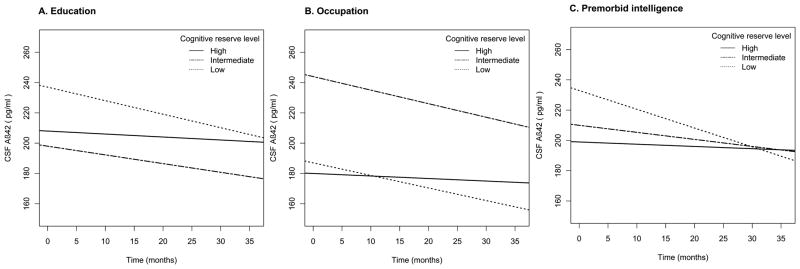
The effect of (A) education, (B) occupation, and (C) premorbid intelligence on CSF Aβ42 rates of change modeled for participants with normal cognition at age 75.
AD participants with better ANART scores had slower progression of glucose hypometabolism (p=0.0003) (Table 2). This pattern also appeared in the NC group, but was not statistically significant (p=0.17) (Table 3). The rates of hippocampal atrophy in MRI were, however, not modified by any of these reserve markers in all three diagnostic groups (Table 4). Unlike NC and AD groups, there was no effect of cognitive reserve markers on AD biomarker changes in the MCI group.
Table 3.
FDG-PET ROIs rates of change stratified by cognitive reserve in GEE models
| FDG-PET ROIs rates of change (mean, 95% CI, unit:10−2 normalized intensity/year)
|
||||
|---|---|---|---|---|
| Reserve proxy | Reserve level | NC | MCI | AD |
| Education | Low | −2.60* (−3.91, −1.29) (n = 46) | −2.92* (−3.82, −2.02) (n = 70) | −6.13* (−7.60, −4.67) (n = 44) |
| Intermediate | −1.42* (−2.52, −0.32) (n = 41) | −3.00* (−3.77, −2.23) (n = 72) | −1.62* (−3.17, −0.07) (n = 30) | |
| High | −2.19* (−3.21, −1.16) (n = 46) | −2.99* (−3.86, −2.12) (n = 82) | −5.79* (−7.71, −3.87) (n = 24) | |
|
| ||||
| Occupation | Low | −2.59* (−3.94, −1.24) (n = 23) | −2.74* (−3.87, −1.60) (n = 43) | −4.76* (−6.33, −3.19) (n = 31) |
| Intermediate | −1.97* (−3.79, −0.14) (n = 32) | −3.12* (−3.95, −2.29) (n = 70) | −5.64* (−7.70, −3.58) (n = 29) | |
| High | −2.10* (−2.89, −1.30) (n = 78) | −2.95* (−3.66, −2.24) (n =111) | −4.05* (−5.81, −2.28) (n = 38) | |
|
| ||||
| ANART | Low | −2.91* (−4.95, −0.87) (n = 25) | −2.43* (−3.19, −1.66) (n = 74) | −6.86* (−8.16, −5.56) (n = 42) |
| Intermediate | −2.55* (−3.66, −1.44) (n = 44) | −4.36* (−5.20, −3.52) (n = 72) | −3.99* (−5.85, −2.13) (n = 28) | |
| High | −1.69* (−2.58, −0.79) (n = 64) | −2.61* (−3.39, −1.83) (n =78) | −2.65* (−4.47, −0.82) (n = 27) | |
|
| ||||
| ICV | Low | −2.65* (−3.94, −1.38) (n = 45) | −3.75* (−4.77, −2.73) (n = 59) | −4.86* (−6.73, −2.99) (n = 31) |
| Intermediate | −2.29* (−3.62, −0.96) (n = 41) | −2.83* (−3.63, −2.03) (n = 77) | −4.53* (−6.49, −2.57) (n = 28) | |
| High | −1.79* (−2.71, −0.88) (n = 47) | −2.54* (−3.21, −1.86) (n =87) | −5.10* (−6.66, −3.54) (n = 38) | |
FDG-PET ROIs: fludeoxyglucose F18- PET region-of-interest; GEE: generalized estimating equations; NC: normal cognition; MCI: mild cognitive impairment; AD: Alzheimer’s disease; ANART: American national adult reading test; ICV: intracranial volume.
p < 0.05 or the rate of change is significantly different from zero.
Table 4.
MRI hippocampal volume rates of change stratified by cognitive reserve in GEE models
| Hippocampal volume rates of change (mean, 95% CI, unit:mm 3/year)
|
||||
|---|---|---|---|---|
| Reserve proxy | Reserve level | NC | MCI | AD |
| Education | Low | −30.8* (−38.1, −23.5) (n= 68) | −69.2* (−77.7, −60.8) (n= 133) | −99.1* (−109.0, −89.0) (n= 89) |
| Intermediate | −34.0* (−41.0, −27.1) (n= 79) | −69.6* (−79.8, −59.4) (n=124) | −94.9* (−113.0, −77.2) (n= 61) | |
| High | −39.5* (−48.1, −30.8) (n= 81) | −57.4* (−65.5, −49.3) (n=136) | −93.3* (−111.0, −75.8) (n= 43) | |
|
| ||||
| Occupation | Low | −32.5* (−40.8, −24.2) (n= 37) | −64.7* (−78.0, −51.4) (n= 91) | −99.9* (−113.0, −86.5) (n= 59) |
| Intermediate | −30.5* (−40.0, −21.0) (n= 54) | −69.2* (−78.5, −60.0) (n=114) | −97.6* (−114.0, −81.4) (n=59) | |
| High | −37.7* (−43.9, −31.5) (n=137) | −63.3* (−70.3, −56.3) (n=188) | −93.1* (−106.0, −80.0) (n=75) | |
|
| ||||
| ANART | Low | −29.7* (−42.9, −16.3) (n= 39) | −69.0* (−79.0, −59.0) (n=136) | −95.2* (−106.0, −84.0) (n=83) |
| Intermediate | −37.2* (−44.1, −30.3) (n= 74) | −62.7* (−71.7, −53.8) (n=124) | −97.1* (−114.0, −80.0) (n=61) | |
| High | −36.2* (−42.8, −29.5) (n=115) | −64.3* (−72.5, −56.2) (n=131) | −97.6* (−115.0, −80.0) (n=47) | |
GEE: generalized estimating equations; NC: normal cognition; MCI: mild cognitive impairment; AD: Alzheimer’s disease; ANART: American national adult reading test.
p < 0.05 or the rate of change is significantly different from zero.
The effects of reserve markers on AD biomarker rates remained unchanged after accounting for APOE 4 and longitudinal missing data. For those whose biomarker rates of change were modified by reserve markers, we further examined their cognitive performance at baseline and there was no apparent difference in MMSE, ADAS-cog and AVLT across each reserve marker stratum (Supplementary Table 1 and 2).
Discussion
To the best of our knowledge, this is the first longitudinal study showing the protective effect of cognitive reserve markers against AD pathological progression. We found that higher levels of education, occupation and premorbid intelligence decelerated the decline of CSF Aβ42 in participants with normal cognition and the effect of premorbid intelligence extended to FDG uptake in patients with AD. The longitudinal effect of cognitive reserve markers on CSF Aβ42 is consistent across different proxies, regardless of whether in continuous or categorical variables, and was not confounded by baseline cognitive function, missing data or APOE 4. Our findings agree with a recent cross-sectional study, which reported that greater lifetime cognitive engagement was associated with reduced Aβ deposition measured by Pittsburg Compound B uptake (PIB).23 Therefore, cognitive reserve markers may not only modify the effect of AD pathology on cognitive performance but also exert direct biological influence to slow pathological progression.
This protective effect of cognitive reserve markers was mainly found among cognitively normal participants. Aβ deposition is considered a pivotal event in the AD pathological cascade which precedes cognitive impairment and triggers subsequent changes in tau, glucose hypometabolism, and hippocampal atrophy.24 Therefore, if reserve markers have any direct influence on AD pathology, the effect may be more likely detected in the dynamics of CSF Aβ42 before any cognitive deficit is manifested. We also observed that ANART modulated the decline of FDG uptake in patients with AD, which seems to be against current reserve hypothesis that people with higher reserve would decline faster once AD becomes symptomatic. Nevertheless, the faster decline in cognitive function may not reflect underlying metabolic decline. Although there was evidence in the inverse relationship between cognitive reserve and parietal flow from an earlier, cross-sectional study,25 evidence on longitudinal FDG-PET in AD is still lacking. A larger sample of AD with repeated FDG-PET scans may help clarify this difference.
The underlying mechanism of how cognitive reserve markers might shape AD pathological change is intriguing. Transgenic mice studies have shown that exposure to environmental enrichment reduced cerebral Aβ deposition,26 suggesting that AD pathology can be modulated by environmental experience. Furthermore, as Aβ release is synaptically regulated, greater synaptic activity increases the level of Aβ in brain interstitial fluid and leads to region-specific Aβ aggregation.27, 28 These vulnerable regions overlap with a set of highly interconnected networks, also known as cortical hubs, which include posterior cingulate, lateral temporal, lateral parietal, and medial/lateral prefrontal regions.29 The spatial convergence of cortical amyloid and these metabolically active cortical hubs leads to a unifying framework recently proposed to explain the relationship between lifespan brain activity and AD.30 Based on the framework, these interconnected networks are responsible for information processing and therefore synaptically active, which may in turn provoke regional deposition of Aβ. The role of cognitive reserve in this model is proposed to support neural efficiency and flexibility for cognitive function. Thus, individuals with higher cognitive reserve would utilize more efficient neural processes, require less synaptic activation and have slower cerebral deposition of Aβ detected as slower CSF Aβ42 decline.
Larger brain size was associated with a lower risk of AD in some9 if not all studies.31 In our study, the effect of large ICV also appeared to protect against CSF Aβ42 and FDG uptake decline in the NC group, though not with statistical significance. Our brain size measure was approximated by combining the volume of CSF space, gray and white matter; however, how valid and precise this approach is for defining maximum synapse count in adulthood or the physical basis of reserve is unclear.
MCI participants were enrolled in ADNI based on clinical criteria, but their underlying pathological profile is likely to be heterogeneous.32 Despite a larger sample size than NC and AD groups, the effect of reserve markers on AD biomarker changes did not appear in the MCI group, consistent with a higher degree of heterogeneity in MCI than in NC or AD.
Education might mediate microstructural changes in hippocampus,33 but we did not observe any effect of cognitive reserve markers on the rates of MRI hippocampal atrophy. Hippocampal volume is a macrostructural measure and the effect of education or other proxies may be more difficult to detect by volumetric MRI. Most importantly, hippocampal atrophy probably represents a late change in the AD pathological cascade and cognitive reserve markers may be no longer protective once the pathological cascade becomes advanced.
One of the unique strengths in our study is that we have repeated measures of AD biomarkers to delineate AD pathological changes over time. Unlike cross-sectional approaches, longitudinal study does not require the assumption that an age effect is uniform across different individuals. For instance, two different participants at age 60 and 70 in the same group are treated separately and we do not assume that the pathological burden of the individual at age 60 will develop into what the 70 year old expresses after 10 years. Second, we have multiple reserve proxies typically employed in past studies: education, occupation, ANART and even ICV, all within the same database; which is rarely available in a clinical study. These reserve proxies share some features but also capture different components of the reserve construct: cognitive experience early in life, cognitive activity during adulthood, and steady-state linguistic capacity for example. Cognitive reserve is a hypothetical construct and cannot be directly measured. It is therefore beneficial to address the effect of cognitive reserve markers from more than one perspective. Third, ADNI comprises a wealth of information, allowing us to assess the potential confounding from missing data, APOE 4 and baseline cognitive function. Since all participants were enrolled at different stages in the disease course, baseline evaluation did not reflect their pathological states when they first had cognitive change. We therefore carefully applied GEE to avoid the unverifiable assumption about the distribution of baseline AD pathology.34 The longitudinal structure and comprehensiveness of ADNI data, together with our statistical approach, all strengthen our results to be less biased.
There are several limitations in our study. First, although over 800 people participated in ADNI, the robust longitudinal effect of cognitive reserve mainly came from 35 cognitively normal subjects with 3 repeated CSF studies. This small sample size may be a concern if we want to generalize our results to a larger population. Because missing data and other potential confounders have been considered in our analyses the internal validity for all 229 participants in the NC group is likely achieved. In addition, the statistical significance from a small sample suggests that the actual effect may be striking. However, the reserve markers we examined actually reflect complex phenomena with a variety of effects on participants, so that we cannot rule out residual confounding. Since we made several hypothesis tests with different biomarkers and cognitive reserve surrogates in the same study population, some significant results might be due to multiple comparisons. Second, there are only up to 3 time points of CSF Aβ42 for longitudinal analysis. Although we could evaluate both change and the variance of change based on 3 repeated measures, we might need more data points to sufficiently minimize the effect of “regression toward the mean”. However, lumbar puncture is an invasive procedure; it is practically challenging to repeat CSF studies especially on normal participants. Amyloid PET imaging, a similar but non-invasive biomarker, may replace the use of CSF Aβ42 to follow cerebral amyloid dynamics in the future. Third, only 55 participants (6.7%) had less than 12 years of education, and highly educated participants were over-represented in the ADNI population (Supplementary Table 3). Therefore, the effects we detected were relatively confined to those with actually moderate to high levels of education. Nevertheless this relationship was also seen in our other reserve markers. Fourth, ADNI participants were enrolled based on clinical criteria but not biomarker measurement. They likely had developed various degrees of AD pathology by the time of enrollment. Although we showed that baseline AD biomarkers were independent of cognitive reserve levels, how baseline differences in pathology would affect rates of change is not known. We therefore need to assume that baseline AD pathology for participants within the same cognitive group is homogeneous. Ideally, we would like to begin with a group of people with a similar amount of AD pathological burden and then follow them to assess the effect of cognitive reserve markers.
High levels of reserve markers may not only reduce the risk of AD or modify the effect of AD pathology on cognitive performance but also have direct biological influence to slow Aβ deposition and compensate for synapse loss in the brain. The protective effect of reserve markers mainly occurs before cognitive impairment, implying that if cognitive intervention can be effective in preventing the occurrence of AD it should be initiated as early as possible.
Supplementary Material
Acknowledgments
Data collection and sharing for this project was funded by the Alzheimer’s Disease Neuroimaging Initiative (ADNI) (National Institutes of Health Grant U01 AG024904). ADNI is funded by the National Institute on Aging, the National Institute of Biomedical Imaging and Bioengineering, and through generous contributions from the following: Abbott; Alzheimer’s Association; Alzheimer’s Drug Discovery Foundation; Amorfix Life Sciences Ltd.; AstraZeneca; Bayer HealthCare; BioClinica, Inc.; Biogen Idec Inc.; Bristol-Myers Squibb Company; Eisai Inc.; Elan Pharmaceuticals Inc.; Eli Lilly and Company; F. Hoffmann-La Roche Ltd and its affiliated company Genentech, Inc.; GE Healthcare; Innogenetics, N.V.; Janssen Alzheimer Immunotherapy Research & Development, LLC.; Johnson & Johnson Pharmaceutical Research & Development LLC.; Medpace, Inc.; Merck & Co., Inc.; Meso Scale Diagnostics, LLC.; Novartis Pharmaceuticals Corporation; Pfizer Inc.; Servier; Synarc Inc.; and Takeda Pharmaceutical Company. The Canadian Institutes of Health Research is providing funds to support ADNI clinical sites in Canada. Private sector contributions are facilitated by the Foundation for the National Institutes of Health (www.fnih.org). The grantee organization is the Northern California Institute for Research and Education, and the study is coordinated by the Alzheimer’s Disease Cooperative Study at the University of California, San Diego. ADNI data are disseminated by the Laboratory for Neuro Imaging at the University of California, Los Angeles. This research was also supported by NIH grants P30 AG010129, K01 AG030514, and the Dana Foundation.
Footnotes
Author contribution:
Study concept and design: Raymond Y. Lo and William J. Jagust Data interpretation: Raymond Y. Lo and William J. Jagust Drafting of the manuscript: Raymond Y. Lo Statistical analysis: Raymond Y. Lo Critical revision of the manuscript: William J. Jagust
Disclosure:
Dr. Lo reports no disclosure. Dr. Jagust has served on a scientific advisory board for Genentech, Inc.; has served as a consultant for Siemens, Synarc, Janssen Alzheimer Immunotherapy, Genentech, Inc., TauRx, and Merck & Co; and receives research support from the NIH (AG027859 [PI], AG027984 [PI], and AG 024904 [Co-I]).
References
- 1.Katzman R, Terry R, DeTeresa R, et al. Clinical, pathological, and neurochemical changes in dementia: a subgroup with preserved mental status and numerous neocortical plaques. Ann Neurol. 1988;23:138–144. doi: 10.1002/ana.410230206. [DOI] [PubMed] [Google Scholar]
- 2.Stern Y. What is cognitive reserve? Theory and research application of the reserve concept. J Int Neuropsychol Soc. 2002;8:448–460. [PubMed] [Google Scholar]
- 3.Stern Y, Gurland B, Tatemichi TK, Tang MX, Wilder D, Mayeux R. Influence of education and occupation on the incidence of Alzheimer’s disease. JAMA. 1994;271:1004–1010. [PubMed] [Google Scholar]
- 4.Evans DA, Hebert LE, Beckett LA, et al. Education and other measures of socioeconomic status and risk of incident Alzheimer disease in a defined population of older persons. Arch Neurol. 1997;54:1399–1405. doi: 10.1001/archneur.1997.00550230066019. [DOI] [PubMed] [Google Scholar]
- 5.Karp A, Kareholt I, Qiu C, Bellander T, Winblad B, Fratiglioni L. Relation of education and occupation-based socioeconomic status to incident Alzheimer’s disease. Am J Epidemiol. 2004;159:175–183. doi: 10.1093/aje/kwh018. [DOI] [PubMed] [Google Scholar]
- 6.Qiu C, Karp A, von Strauss E, Winblad B, Fratiglioni L, Bellander T. Lifetime principal occupation and risk of Alzheimer’s disease in the Kungsholmen project. Am J Ind Med. 2003;43:204–211. doi: 10.1002/ajim.10159. [DOI] [PubMed] [Google Scholar]
- 7.Fratiglioni L, Ahlbom A, Viitanen M, Winblad B. Risk factors for late-onset Alzheimer’s disease: a population-based, case-control study. Ann Neurol. 1993;33:258–266. doi: 10.1002/ana.410330306. [DOI] [PubMed] [Google Scholar]
- 8.Schmand B, Smit JH, Geerlings MI, Lindeboom J. The effects of intelligence and education on the development of dementia. A test of the brain reserve hypothesis. Psychol Med. 1997;27:1337–1344. doi: 10.1017/s0033291797005461. [DOI] [PubMed] [Google Scholar]
- 9.Schofield PW, Logroscino G, Andrews HF, Albert S, Stern Y. An association between head circumference and Alzheimer’s disease in a population-based study of aging and dementia. Neurology. 1997;49:30–37. doi: 10.1212/wnl.49.1.30. [DOI] [PubMed] [Google Scholar]
- 10.Unverzagt FW, Hui SL, Farlow MR, Hall KS, Hendrie HC. Cognitive decline and education in mild dementia. Neurology. 1998;50:181–185. doi: 10.1212/wnl.50.1.181. [DOI] [PubMed] [Google Scholar]
- 11.Wilson RS, Li Y, Aggarwal NT, et al. Education and the course of cognitive decline in Alzheimer disease. Neurology. 2004;63:1198–1202. doi: 10.1212/01.wnl.0000140488.65299.53. [DOI] [PubMed] [Google Scholar]
- 12.Scarmeas N, Albert SM, Manly JJ, Stern Y. Education and rates of cognitive decline in incident Alzheimer’s disease. J Neurol Neurosurg Psychiatry. 2006;77:308–316. doi: 10.1136/jnnp.2005.072306. [DOI] [PMC free article] [PubMed] [Google Scholar]
- 13.Del Ser T, Hachinski V, Merskey H, Munoz DG. An autopsy-verified study of the effect of education on degenerative dementia. Brain. 1999;122 (Pt 12):2309–2319. doi: 10.1093/brain/122.12.2309. [DOI] [PubMed] [Google Scholar]
- 14.Lo RY, Hubbard AE, Shaw LM, et al. Longitudinal change of biomarkers in cognitive decline. Arch Neurol. 2011;68:1257–1266. doi: 10.1001/archneurol.2011.123. [DOI] [PMC free article] [PubMed] [Google Scholar]
- 15.Petersen RC, Aisen PS, Beckett LA, et al. Alzheimer’s Disease Neuroimaging Initiative (ADNI): clinical characterization. Neurology. 2010;74:201–209. doi: 10.1212/WNL.0b013e3181cb3e25. [DOI] [PMC free article] [PubMed] [Google Scholar]
- 16.Shaw LM. PENN biomarker core of the Alzheimer’s disease Neuroimaging Initiative. Neurosignals. 2008;16:19–23. doi: 10.1159/000109755. [DOI] [PMC free article] [PubMed] [Google Scholar]
- 17.Landau SM, Harvey D, Madison CM, et al. Associations between cognitive, functional, and FDG-PET measures of decline in AD and MCI. Neurobiol Aging. 2011;32:1207–1218. doi: 10.1016/j.neurobiolaging.2009.07.002. [DOI] [PMC free article] [PubMed] [Google Scholar]
- 18.Jack CR, Jr, Bernstein MA, Fox NC, et al. The Alzheimer’s Disease Neuroimaging Initiative (ADNI): MRI methods. J Magn Reson Imaging. 2008;27:685–691. doi: 10.1002/jmri.21049. [DOI] [PMC free article] [PubMed] [Google Scholar]
- 19.Chandola T, Jenkinson C. The new UK National Statistics Socio-Economic Classification (NS-SEC); investigating social class differences in self-reported health status. J Public Health Med. 2000;22:182–190. doi: 10.1093/pubmed/22.2.182. [DOI] [PubMed] [Google Scholar]
- 20.McGurn B, Starr JM, Topfer JA, et al. Pronunciation of irregular words is preserved in dementia, validating premorbid IQ estimation. Neurology. 2004;62:1184–1186. doi: 10.1212/01.wnl.0000103169.80910.8b. [DOI] [PubMed] [Google Scholar]
- 21.Zeger SL, Liang KY, Albert PS. Models for longitudinal data: a generalized estimating equation approach. Biometrics. 1988;44:1049–1060. [PubMed] [Google Scholar]
- 22.Lo RY, Jagust WJ Alzheimer’s Disease Neuroimaging I. Predicting missing biomarker data in a longitudinal study of Alzheimer disease. Neurology. 2012;78:1376–1382. doi: 10.1212/WNL.0b013e318253d5b3. [DOI] [PMC free article] [PubMed] [Google Scholar]
- 23.Landau SM, Marks SM, Mormino EC, et al. Association of Lifetime Cognitive Engagement and Low beta-Amyloid Deposition. Arch Neurol. 2012 doi: 10.1001/archneurol.2011.2748. [DOI] [PMC free article] [PubMed] [Google Scholar]
- 24.Jack CR, Jr, Knopman DS, Jagust WJ, et al. Hypothetical model of dynamic biomarkers of the Alzheimer’s pathological cascade. Lancet Neurol. 2010;9:119–128. doi: 10.1016/S1474-4422(09)70299-6. [DOI] [PMC free article] [PubMed] [Google Scholar]
- 25.Stern Y, Alexander GE, Prohovnik I, et al. Relationship between lifetime occupation and parietal flow: implications for a reserve against Alzheimer’s disease pathology. Neurology. 1995;45:55–60. doi: 10.1212/wnl.45.1.55. [DOI] [PubMed] [Google Scholar]
- 26.Lazarov O, Robinson J, Tang YP, et al. Environmental enrichment reduces Abeta levels and amyloid deposition in transgenic mice. Cell. 2005;120:701–713. doi: 10.1016/j.cell.2005.01.015. [DOI] [PubMed] [Google Scholar]
- 27.Cirrito JR, Yamada KA, Finn MB, et al. Synaptic activity regulates interstitial fluid amyloid-beta levels in vivo. Neuron. 2005;48:913–922. doi: 10.1016/j.neuron.2005.10.028. [DOI] [PubMed] [Google Scholar]
- 28.Bero AW, Yan P, Roh JH, et al. Neuronal activity regulates the regional vulnerability to amyloid-beta deposition. Nat Neurosci. 2011;14:750–756. doi: 10.1038/nn.2801. [DOI] [PMC free article] [PubMed] [Google Scholar]
- 29.Buckner RL, Sepulcre J, Talukdar T, et al. Cortical hubs revealed by intrinsic functional connectivity: mapping, assessment of stability, and relation to Alzheimer’s disease. J Neurosci. 2009;29:1860–1873. doi: 10.1523/JNEUROSCI.5062-08.2009. [DOI] [PMC free article] [PubMed] [Google Scholar]
- 30.Jagust WJ, Mormino EC. Lifespan brain activity, beta-amyloid, and Alzheimer’s disease. Trends Cogn Sci. 2011;15:520–526. doi: 10.1016/j.tics.2011.09.004. [DOI] [PMC free article] [PubMed] [Google Scholar]
- 31.Edland SD, Xu Y, Plevak M, et al. Total intracranial volume: normative values and lack of association with Alzheimer’s disease. Neurology. 2002;59:272–274. doi: 10.1212/wnl.59.2.272. [DOI] [PubMed] [Google Scholar]
- 32.Stephan BC, Matthews FE, Hunter S, et al. Neuropathological Profile of Mild Cognitive Impairment from a Population Perspective. Alzheimer Dis Assoc Disord. 2011 doi: 10.1097/WAD.0b013e31822fc24d. [DOI] [PubMed] [Google Scholar]
- 33.Piras F, Cherubini A, Caltagirone C, Spalletta G. Education mediates microstructural changes in bilateral hippocampus. Hum Brain Mapp. 2010 doi: 10.1002/hbm.21018. [DOI] [PMC free article] [PubMed] [Google Scholar]
- 34.Hubbard AE, Ahern J, Fleischer NL, et al. To GEE or not to GEE: comparing population average and mixed models for estimating the associations between neighborhood risk factors and health. Epidemiology. 2010;21:467–474. doi: 10.1097/EDE.0b013e3181caeb90. [DOI] [PubMed] [Google Scholar]
Associated Data
This section collects any data citations, data availability statements, or supplementary materials included in this article.