Abstract
Extracorporeal shock wave therapy (ESWT) uses acoustic pulses to treat certain musculoskeletal disorders. In this paper the acoustic field of a clinical portable ESWT device (Duolith SD1) was characterized. Field mapping was performed in water for two different standoffs of the electromagnetic head (15 or 30 mm) using a fiber optic probe hydrophone. Peak positive pressures at the focus ranged from 2 to 45 MPa, while peak negative pressures ranged from −2 to −11 MPa. Pulse rise times ranged from 8 to 500 ns; shock formation did not occur for any machine settings. The maximum standard deviation in peak pressure at the focus was 1.2%, indicating that the Duolith SD1 generates stable pulses. The results compare qualitatively, but not quantitatively with manufacturer specifications. Simulations were carried out for the short standoff by matching a Khokhlov-Zabolotskaya-Kuznetzov equation to the measured field at a plane near the source, and then propagating the wave outward. The results of modeling agree well with experimental data. The model was used to analyze the spatial structure of the peak pressures. Predictions from the model suggest that a true shock wave could be obtained in water if the initial pressure output of the device were doubled.
INTRODUCTION
Extracorporeal shock wave therapy (ESWT, or SWT) is a noninvasive technology used to treat several musculoskeletal disorders, including chronic plantar fasciitis,1, 2 calcific tendonitis of the shoulder,3 lateral epicondylitis,4, 5 Achilles tendinopathy,6, 7 and nonunion of fractures of long bones.8 Therapeutic bioeffects induced by ESWT include angiogenesis,9, 10, 11 osteogenesis,12, 13, 14 and antinociceptive effects.14, 15, 16 Several studies suggest that ESWT is associated with up-regulation of proteins like vessel endothelial growth factor (VEGF),10, 11 bone morphogenic protein (BMP),12, 13, 17 osteogenic protein (OP),12, 13 and nitride oxide syntheses (NOS) in multiple tissues,15, 16 and these might activate pathways to induce beneficial bioeffects.13, 16 Although some of these bioeffects have been identified, the actual physical mechanisms of ultrasound action on bones and surrounding tissues in ESWT remain unknown. The problem is exasperated from clinical reporting of ESWT effects. Clinical studies often do not report acoustic parameters and treatment protocols used for trials, which may lead to conflicting therapeutic interpretations.
Progress toward understanding the mechanisms of bioeffects requires accurate characterization of the parameters of ultrasound fields generated by clinical devices. ESWT devices include electromagnetic, electrohydraulic, ballistic, and piezoelectric sources. The acoustic outputs from similar devices used for shock wave lithotripsy have been measured,18, 19, 20 but independent measurements of clinical ESWT devices have not been done for several machines that are commercially available. In one independent study, Chitnis and Cleveland reported that the electrohydraulic source of the Equitron/Evotron system produces an output that does not change by varying device settings.21 A second publication by the same group showed that the ballistic source of the same system generates a wave that does not resemble a shock front.22 Thus, while self-reported results by manufacturers are useful, independent characterization is needed. Towards that goal, the acoustic field generated by the electromagnetic therapy head of the Duolith SD1 T-Top (Storz Medical AG, Tägerwilen, Switzerland) was characterized.
The Duolith SD1 T-Top device has dual modes of operation, one called “focused shock wave therapy” (focused electromagnetic head), and the other “radial shock wave therapy” (ballistic head). The focused therapy head is composed of a cylindrical coil and a parabolic reflector. A coil excites a cylindrical membrane, which generates a wave that is focused, similar to lithotripsy spark sources, by a parabolic reflector.23 The ballistic source consists of an air-pressure driven projectile that impacts a metallic applicator and distributes a pressure wave when contacted against the treatment area. Some studies have addressed clinical aspects such as efficacy and safety of the focused head,24, 25, 26, 27, 28 but to our knowledge, no independent studies of the acoustic output at various machine settings, measured or modeled, have been published.
Treatment parameters for ESWT span from low energy (mentioned below) to high energy settings, comparable to the higher levels reached by the measured device.29, 30, 31, 32, 33, 34 ESWT treatment parameters for the Duolith SD1 reported in the literature span several output settings. High nominal levels of 43 MPa have been used for studies that explored the potential of shock waves to remove calculi and biofilms,25 and for case reports on the treatment of pseudoarthrosis.17, 35 Lower settings are more common with more recent studies: A nominal level of 25 MPa was used in studies of chronic pelvic pain syndrome,27, 36 systemic sclerosis,26 and Peyronie's disease.37 Nominal levels of 14–31 MPa were used to explore shock wave treatment for tibial stress syndrome in athletes.38
Characterization of the acoustic fields produced by medical devices is usually performed in water and then the results are translated (derated) into tissue, where direct measurements are impossible in most cases. In recent studies, numerical modeling combined with measurements has been actively used to characterize acoustics fields from high-power ultrasound medical devices. Simulation data based on the nonlinear parabolic Khokhlov–Zabolotskaya–Kuznetzov (KZK) type equation that accounts for effects of nonlinearity, diffraction, and absorption in ultrasound beams has been shown to agree well with experimental data. This model has been applied to predict acoustic fields of lithotripters, unfocused transducers, diagnostic ultrasound probes, and high intensity focused ultrasound (HIFU) sources.39, 40, 41, 42, 43 It has been also shown that a critical component for accurate simulations is to define a boundary condition for the model using actual data, obtained from the measurements for that particular device.39, 41, 43
Following this approach, modeling was combined with measurements to characterize the nonlinear ultrasound fields generated by the Duolith SD1 electromagnetic head. The paper is organized as follows. The experimental system is described first, followed by the model and procedure of setting the boundary condition (Sec. 2). Experimental results are provided for various machine settings and compared with modeling at the highest operating level of the device; simulation results are presented to provide more detailed analysis of the spatial structure of the peak positive and negative pressures and temporal characteristics of the pressure pulse in the focal region (Sec. 3). The results are discussed in Sec. 4.
MATERIALS AND METHODS
Experimental arrangement
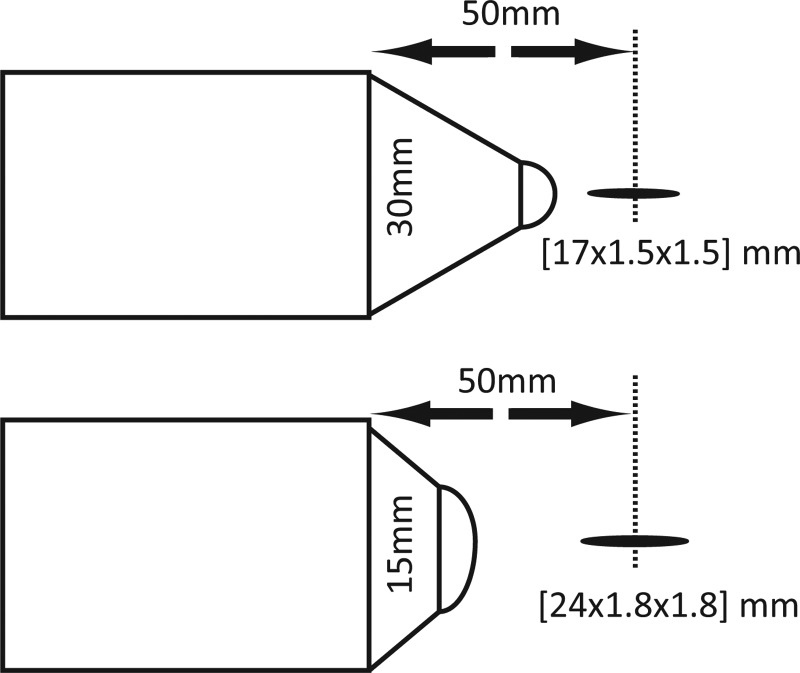
Measurements were performed on the portable Duolith SD1 T-Top ESWT device (Storz Medical AG, Tägerwilen, Switzerland). The device output has a number of settings, some of which are shown in Table TABLE I.. The machine pulse repetition frequency (PRF) ranges from 1 to 8 Hz (in the higher output settings it can only go up to 3 or 4 Hz, depending on the setting). The electromagnetic source provides two different standoffs that require an oil bag attachment as a film coupling to the membrane of the therapy head with lengths of 15 or 30 mm, respectively (Fig. 1). The other therapy head is a ballistic source advertised as a radial shock wave, respectively pressure wave source. The ballistic head has an applicator/transmitter with a diameter of 15 mm, but a number of other transmitters are available. It uses compressed air to fire a projectile against the tip of the applicator, generating a pressure pulse, and can operate at a PRF of 1–21 Hz. A full characterization of a different ballistic head (EMS Swiss Dolorclast Vet) has previously been performed,22 thus we devote the majority of this work to the focused electromagnetic therapy head.
TABLE I.
Selected output settings of the Duolith SD1 discussed throughout the results and discussion sections.
| Nominal settings a | Measured parameters, 30 mm standoff | Measured parameters, 15 mm standoff | ||||||||
|---|---|---|---|---|---|---|---|---|---|---|
| No. | p+, MPa | ED, mJ/mm2 | p+, MPa | p−, MPa | p-to-p, MPa | ED, mJ/mm2 | p+, MPa | p−, MPa | p-to-p, MPa | ED, mJ/mm2 |
| 1 | 3 | 0.01 | 1.8 | −2.3 | 4.1 | 0.01 | 2.1 | −2.0 | 4.1 | 0.01 |
| 2 | 10 | 0.07 | 5.7 | −5.0 | 10.7 | 0.04 | 5.7 | −4.7 | 10.4 | 0.03 |
| 3 | 31 | 0.3 | 17.5 | −8.0 | 25.5 | 0.12 | 17.4 | −7.3 | 24.7 | 0.11 |
| 4 | 36 | 0.35 | 20.3 | −8.3 | 28.6 | 0.13 | 19.5 | −7.7 | 27.2 | 0.13 |
| 5 | 51 | 0.45 | 29.9 | −9.2 | 39.1 | 0.19 | 26.3 | −8.6 | 34.9 | 0.17 |
| 6 | 56 | 0.5 | 35.8 | −9.5 | 45.3 | 0.21 | 30.8 | −8.9 | 39.7 | 0.19 |
| 7 | 62 | 0.55 | 42.7 | −9.9 | 52.6 | 0.23 | 39 | −9.3 | 48.3 | 0.22 |
According to the manufacturer, in-house measurements were done without the coupling cone.
Figure 1.
Electromagnetic treatment heads. The −3 dB focal zone is shown for the 30 mm (top) and 15 mm (bottom) standoff. Axial focal length from the tip depends on which standoff is used (15 and 30 mm, respectively). The focal dimensions shown were obtained from measurements.
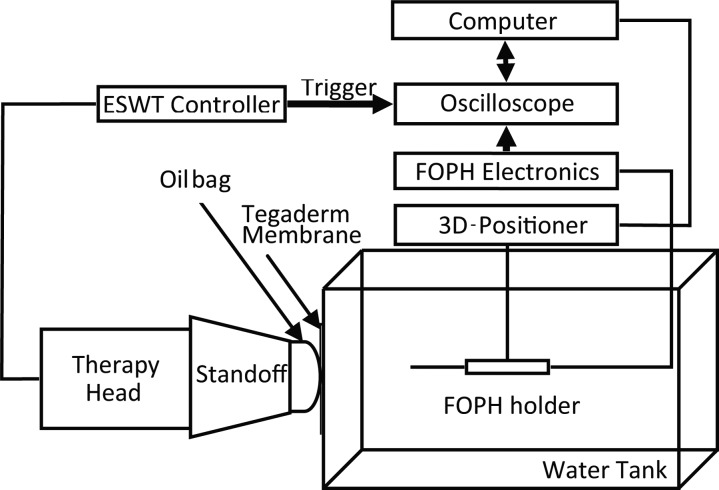
Figure 2 displays the experimental setup: A computer-controlled 3D positioning system (Velmex NF90, Bloomfield, NY) was used to move a fiber optic probe hydrophone (FOPH 2000, RP Acoustics, Germany) for field mapping. The fiber tip was 100 μm in diameter. The step-size increment was 0.5 mm. Alignment of the FOPH to the acoustic field was done by performing a raster scan in two separate planes: One plane intersected the acoustic axis at the focus, with the maximum pressure at the center. The other plane was distal to the first. The beam axis was found as a line crossing the pressure maxima of the two planes. The FOPH was positioned parallel to the axis.
Figure 2.
Illustration of experimental setup. The therapy head can be either ballistic (no standoff used) or electromagnetic (as shown). Coupling of the treatment head to the water was facilitated by a Tegaderm window and coupling gel.
The treatment heads (electromagnetic or ballistic) were located outside the water bath (31 cm long × 18 cm deep × 18 cm wide, maximum degassed level 8% O2, at room temperature). They were coupled to the bath via a Tegaderm (3 M, MN, USA) window on one end of the bath and coupling gel. Care was taken to ensure that there were no visible bubbles in the contact area. The bath was large enough to avoid interference from reflections.
Measurement protocols and pulse definitions
The fiber optic hydrophone (FOPH 2000, RPI Acoustics, Germany) was originally developed specifically as a tool for shock wave measurements.44 It was also used to measure the field generated by the ballistic source because it is calibrated even at lower frequencies (down to 100 kHz) and provides a broadband (up to 100 MHz) frequency response. An equi-potential discharge pin located on the back of the Duolith was used as a reliable trigger. The FOPH signals were digitized by an oscilloscope (LT344 Waverunner, LeCroy, NY) at 500 MSamples/s. The FOPH 2000 software CALDEC was used to calculate pressure values from the oscilloscope data and to deconvolve the signal to account for the frequency response of the system.44 Data collection was automated using LabVIEW (National Instruments, Austin, TX).
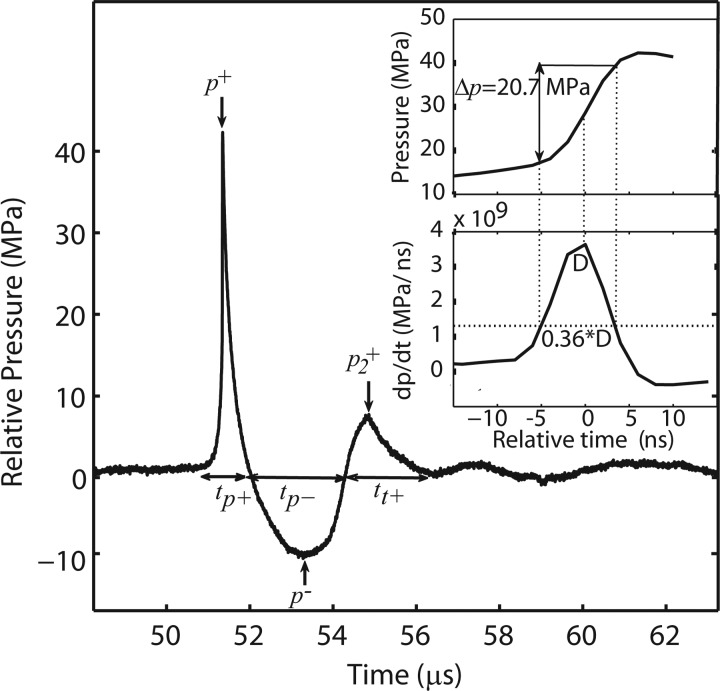
Acoustic parameters for pressure waveforms associated with the focused electromagnetic source are illustrated in Fig. 3. Peak positive (p+) or negative (p−) pressure corresponds to the maximum or minimum pressure value in the pulse. Compression phase duration (tp+) is defined as the length of time between zero crossings for the positive pressure, while tensile phase duration (tp−) is equivalently defined for the rarefaction phase. There is a secondary pulse (characteristic of electromagnetic sources) with a peak pressure p2+ and duration tt+. The energy flux density for a pulse was calculated by computing the pulse intensity integral (PII) based on the International Electrical Commission (IEC) standard for shock wave lithotripsy (IEC 1998),45 defined as the integral of the intensity over the duration of the entire temporal waveform between time points where the pulse first and last reaches 10% of its maximum pressure value.
Figure 3.
Typical averaged pressure waveform (25 averages) at the focus (15 mm from the long standoff) at the maximum output setting of the Duolith SD1 T-Top. The main pulse has a sharp front followed by a longer negative tail. Here, maximum and minimum pressure amplitudes are p+ = 42.3 MPa and p− = 9.9 MPa. There is a repeatable trailing pulse that is particular to electromagnetic sources. Inset: Close up of the pulse front of the waveform (top) and its time derivative (bottom). These are used to measure the rise time (trt) of the main pulse, in this case trt = 8 ns (see text).
The rise time of the main pulse at the focus, trt, was defined from the time derivative of the pulse profile (see Fig. 3 inset). It is given by the duration of the derivative at 0.36 of the maximum derivative value. This definition of the rise time, which corresponds to the steepest region of the front, was recently proposed from laboratory-scale sonic boom studies to characterize shock structures of spark-generated pulses propagating in air.46, 47 The definition is equivalent to the classical definition (time needed for the pressure at the shock of the amplitude As to increase from 0.1·As to 0.9·As) for shocks governed by the stationary solution of the Burgers equation:48
| (1) |
where p is the acoustic pressure, τ = t − z/c is the retarded time, z is the propagation distance, c is the propagation speed of the shock, the parameter is introduced as , β is the coefficient of nonlinearity of the propagation medium, and b is the thermoviscous absorption of the medium. Classical weak shocks, Eq. 1, with short rise times form when high amplitude acoustic waves propagate in a nonlinear thermoviscous medium.48 Nonlinear effects tend to steepen the shock, while thermoviscous effects of energy absorption at the shock tend to smoothen it. The balance of these two effects creates a shock of quasi stationary thickness, inversely proportional to the shock amplitude. The 10% to 90% rise time of the pressure Δp at the shock in Eq. 1 is the length of time for the function tanh(τ/τ0) to change from −0.8 to 0.8, and is equal to 2.2·τ0. The time derivative of Eq. 1 is . It is equal to 0.36 of the maximum value of the derivative when tanh(τ/τ0) is equal to plus or minus 0.8. For a stationary shock such as governed by Eq. 1, these two definitions are equivalent. In estimating the rise time of the experimental waveforms (Fig. 3), the definition based on the time derivative is more accurate, as it rejects the smooth “pedestal” rise that precedes the sharp pressure jump; this pedestal is often in excess of 10% of the shock front amplitude. The presence of the pedestal in the focal waveform is typical for electromagnetic sources and leads to over estimation of the rise time if it is defined from 10% to 90% of the peak positive pressure (shock amplitude). On the contrary, the time derivative definition leads to an estimate for the characteristic time width of the steepest part of the shock front. For example, in water c = 1486 m/s, β = 3.5, and b = 4.33·10−3 kg·s−1·m−1; Δp = 0.8·p+ ≈ 20 MPa (see inset to Fig. 3). If a shock front is formed with p+ = 25 MPa, and its steepness is balanced by nonlinear and thermoviscous effects, the theoretical rise time would be about 0.27 ns.
Numerical model and experimental data processing for the model
Numerical modeling of the nonlinear propagation of focused acoustic pulses generated by the electromagnetic source in water was performed using the KZK nonlinear parabolic equation:
| (2) |
Here r is the radial distance from the beam axis, c0 is the ambient sound speed, ρ0 is the density in water, and other variables are the same as used in Eq. 1. The equation accounts for the combined effects of nonlinearity, diffraction, and weak thermoviscous absorption in water. The key component for using Eq. 2 to simulate the experiment was to set a boundary condition for the model. The most accurate way is to obtain the boundary condition directly from measurements.39, 41, 43
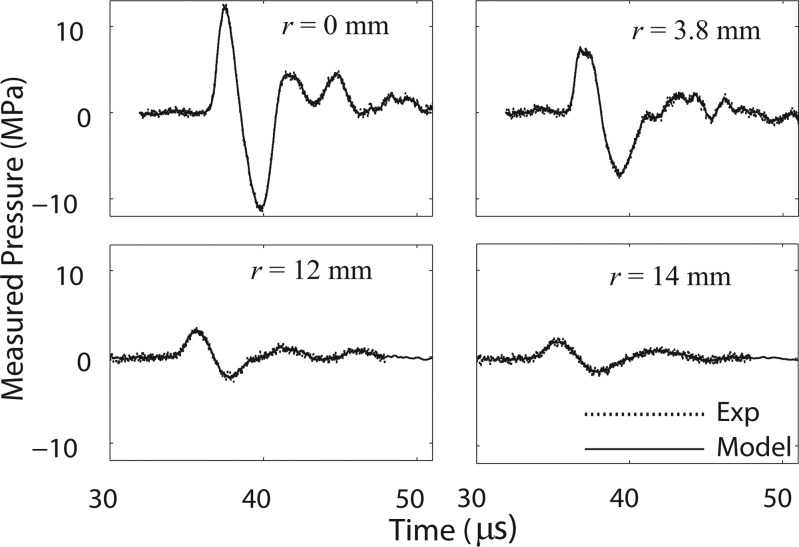
To set a boundary condition at some initial plane, pressure waveforms were measured radially in a plane as close to the therapy head as possible for the existing experimental arrangement, which was approximately 5 mm from the short standoff. A total of 71 waveforms (each an average of 20 individual waveforms) were measured in increments of 0.2 mm radially away from the axis of the beam up to 14 mm. Signals were sampled at 500 MSample/s. Radial symmetry was assumed after initial experiments (not shown) confirmed that the emitted field from the device was indeed symmetric. Measurements of waveforms were carried out up to 14 mm from the beam axis; measurements at longer distances from the axis were not obtained because of low signal-to-noise levels. Representative examples of averaged waveforms collected from the experiment, along with the model fits, are shown in Fig. 4. To facilitate the modeling effort by reducing the noise level in the measured signal, each experimental waveform was further numerically smoothed 3 times over 5 points in the region around the maximum peak positive pressure (within 1.25 μs) and 3 times over 30 points in the other smoother parts of the pulse.
Figure 4.
Selected radial scan averaged waveforms collected from the measurements in a plane 5 mm from the short standoff, along with simulation fit from model. Radial scan had a total length of 14 mm and waveforms along the way were used as a boundary condition for the model.
The general properties of the solution to the KZK equation assumes that the time integral over the pulse is equal to zero, as the zero frequency component in the FFT series expansion of the signal is eliminated by diffraction. To ensure that the pulses used for the boundary condition satisfy this requirement, a tail of Δt = 30 μs duration was added at the end of each pulse as:
| (3) |
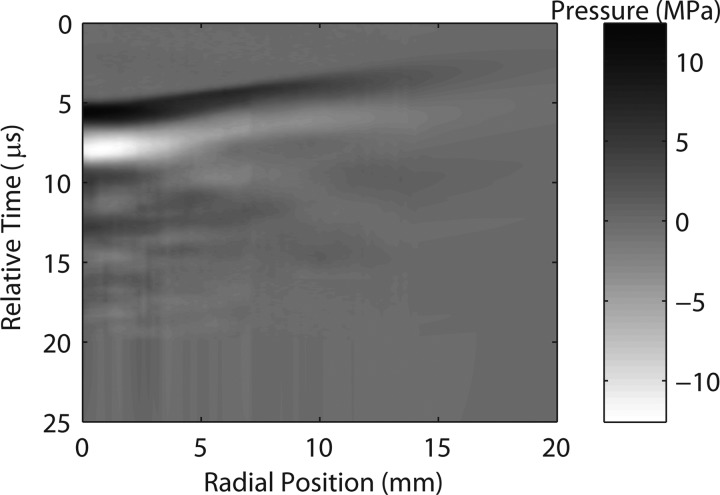
Here p1 is the pressure value at the last measured time point of each waveform, t is the time counted from this last point, S is the integral over the averaged waveform. The absolute value of the maximum pressure in the tail did not exceed 1.6 MPa, i.e., it was of the same order as the level of noise in the measured waveforms (± 0.7 MPa). To account for non-measured waveforms in the radial scan from 14 to 20 mm from the axis, additional waveforms were numerically introduced in the boundary condition by taking the very last radial waveform at 14 mm and exponentially decreasing its amplitude along the radial coordinate with a linear time delay that followed the overall geometry of the measured field. The radial step in the numerical modeling was refined by adding 36 waveforms in between each two experimental waveforms in the neighboring spatial points with linear interpolation of pressure for each time point. The boundary condition map for the modeling algorithm is shown in Fig. 5, where every vertical line depicts a pressure waveform at a certain radial distance from the beam axis.
Figure 5.
Boundary condition map for the modeling algorithm. Experimental pressure waveforms were measured 5 mm from the short standoff along the radial (transverse) coordinate out to 14 mm. Numerically extrapolated waveforms extends the map out to 20 mm. In addition, 36 additional numerically interpolated waveforms were added between each two experimental waveforms, giving the map a total of 3701 waveforms. The low pressure tail described by Eq. 3 is not shown. Waveforms are represented by vertical lines; pressure is shown as in gray scale; the actual computational windows were 65.5 μs in time and 43.2 mm in the radial (transverse) direction. The time axis is relative to the time in Fig. 4 where the “0” corresponds to a time shift by 32 μs from the data in Fig. 4.
The KZK equation [Eq. 2] with the boundary condition described above was simulated using an algorithm previously described in detail.49, 50, 51 A method of fractional steps with an operator splitting procedure was used to march the solution over the axial coordinate z. A combined time and frequency domain solution was used. The effect of diffraction was calculated in the frequency domain for each harmonic using a finite-difference implicit backward algorithm at shorter distances from the initial plane (up to 4.4 mm) and then using the Crank–Nicholson algorithm. Absorption was also calculated in the frequency domain using the exact solution for each harmonic. Nonlinear effects were calculated in the time domain using a Godunov-type scheme. Transition between the spectral and time domains was performed using the fast Fourier transform. Simulations were run in water with physical parameters introduced earlier in this section. The parameters for the modeling were: 16 384 harmonics, 32 768 time-steps, 65.5 μs time window, 2 ns time step, 43.2 mm radial window, 8000 radial grid points, 5.4 μm radial step, and 0.11 mm axial step.
RESULTS
Experimental results were obtained for the long and short standoffs. Given the relatively small difference between the measured fields from different standoffs, numerical simulations are only provided for the short standoff.
Measurements of individual waveforms were used to present the results with means and standard deviations. However, in many cases, to reduce noise levels for figure presentation or for collecting boundary condition waveforms, waveform averages were used. It was thus important to determine whether or not the waveform average affected the actual peak amplitudes or rise times. The peak amplitudes and rise times of an averaged pulse were compared to those of an individual pulse. The averaged amplitude was at most 1.2% lower than the peak amplitude of an individual pulse and no difference in rise times was observed; this can be explained by two factors. First, the electromagnetic source is stable, much more stable than an electrohydraulic source. Second, the FOPH is band-limited at 100 MHz, therefore the measured rise time was most probably over estimated and limited by the hydrophone bandwidth in both cases. It is further instructive to examine the jitter by taking the time derivative of each individual pulse and computing the time difference between the maxima of the resulting derivative. The maximum jitter at the highest output setting of the machine was on the order of 5 ns.
A typical (averaged) waveform measured at the focus (15 mm from the long standoff) at the highest output setting of the machine (no. 7, Table TABLE I.), is displayed in Fig. 3. This characteristic waveform has a rapid rise in positive pressure, followed by a negative tail, and then a second trailing pulse that is characteristic of electromagnetic shock wave devices.23 The measured peak positive pressure in the pulse is p+ = 42.3 MPa (for the individual pulses, p+ = 42.7 ± 1.2 MPa); the positive phase lasts about 1 μs (tp+) for the highest machine setting (no. 7, Table TABLE I.) and 1.4 μs for the lowest setting (no.1, Table TABLE I.). The negative tail has a peak amplitude of p− = −9.9 MPa (for the individual pulses, p− = −9.9 ± 0.24 MPa) and lasts 2.2 μs (tp−) for the highest setting and 1.8 μs for the lowest setting. The secondary pulse has a peak positive pressure of p2+ = 7.0 ± 0.4 MPa. The ratio of the tensile tail length to the positive tail length (tp−/tp+) increases from 1.2 to 2.1 with increasing machine output setting and the pressure ratio between peak positive and peak negative pressures (p+/ p−) increases from 0.8 to 4.3 with increasing machine output setting. The secondary pulse becomes a significant fraction of the maximum peak pressure (p2+/p+) as the energy setting of the machine decreases, ranging from about 17% of the peak positive pressure at the highest output setting (no. 7, Table TABLE I.) to almost 62% at the lowest machine output setting (no. 1, Table TABLE I.). The length of the secondary pulse tt+ decreases as the machine setting decreases from 1.4 to 0.8 μs.
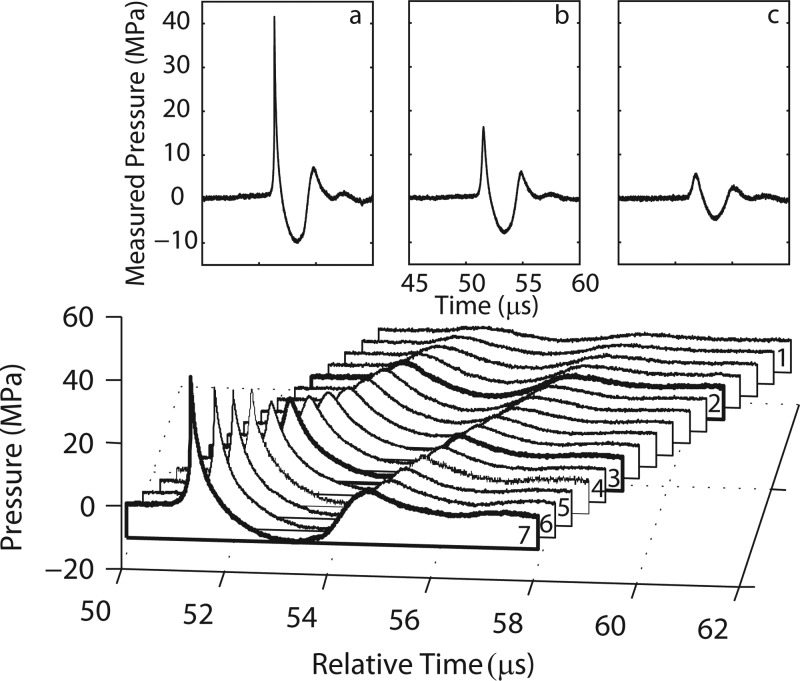
The inset waveforms (Fig. 6) also illustrate the fact that the secondary pulse becomes relatively more important as the machine setting is lowered. That is, the ratio of the second positive peak to the first peak for the settings no. 7, no. 3, and no. 2 from Table TABLE I. is 17%, 37%, and 62%, respectively; corresponding waveforms are shown in Figs. 6a, 6b, 6c. At the low settings, the device essentially delivers a low-amplitude double pulse. The ratio of the peak positive to the peak negative pressure, on the other hand, decreased from 4.3 at the highest machine output setting to 0.8 for the lowest setting.
Figure 6.
Waterfall plot for all machine output settings from the long standoff. Individually labeled waveforms correspond to the machine setting shown in Table TABLE I.. Inset displays averaged waveforms for three different machine settings indicated as dark lines in the waterfall plot. (a) Setting no. 7 of 62 MPa nominal peak positive pressure; (b) setting no. 3 of 31 MPa; (c) setting no. 2 of 10 MPa.
Returning to Fig. 3, the rise time in the experimental waveform was estimated at 8 ns. It was determined by the width of the derivative of the pressure waveform at a level of 0.36 from its maximum value (see discussion in Sec. 2B). This is illustrated in the inset of Fig. 3, where a rapid pressure jump of about 25 MPa at the pulse front occurs. For this setting, the value of 8 ns is over an order of magnitude greater than the theoretical rise time for a shock front of the same amplitude defined from the hyperbolic tangent solution of the Burgers equation (0.27 ns). It was not possible to determine from measurements whether or not the true rise time in the pulse was overestimated because of the limited 100 MHz bandwidth of the FOPH that can provide time resolution of about 10 ns. Thus, it was not possible to determine whether the true weak shock was present in the waveform. This issue is examined further in the discussion section, where numerical modeling was used to show that the waveform was indeed not yet shocked.
Axial and radial scans
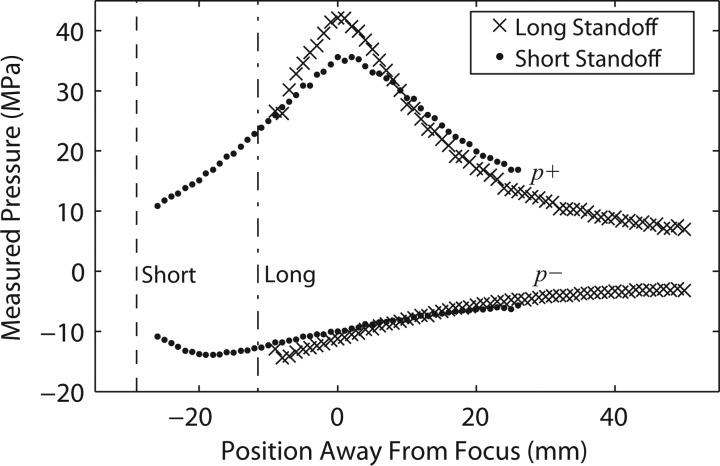
Axial scans for both the short and long standoffs at the machine's highest output (no. 7) are displayed in Fig. 7. The axial scans show a clear positive peak corresponding to the focus of the short or long therapy head (the tips of the standoffs are illustrated by the dashed vertical lines). For the short standoff, the spatial maximum for the peak negative pressure is almost 20 mm closer to the standoff than for the peak positive pressure. For the long standoff, there is only the hint of a peak near −9 mm. The peak negative pressure is higher prefocally than post focally, and not as symmetric as the peak positive pressure along the axis. To prevent damage to the FOPH, the tip was never brought into contact with the standoff. Thus, there is some uncertainty in the exact location of the tip of the therapy head membrane with respect to the focus (the position represented by the dashed lines in Fig. 7), by as much as ± 1.5 mm.
Figure 7.
Axial scans along the beam axis for the focused source using 30 mm and 15 mm standoffs with a 1 mm step-size and 20 averages per location. Measurements include p+ and p− (“x” symbols for 30 mm standoff and black circles for 15 mm standoff). “Short” and “Long” correspond to the position of the tips of the short and long standoffs, respectively. The distance between standoff tips is 15 mm.
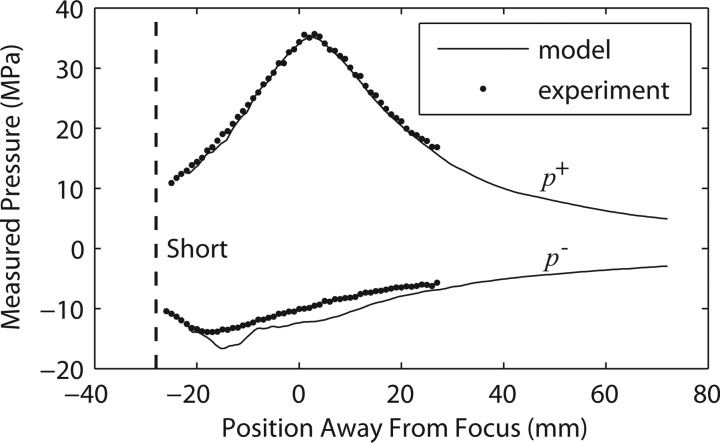
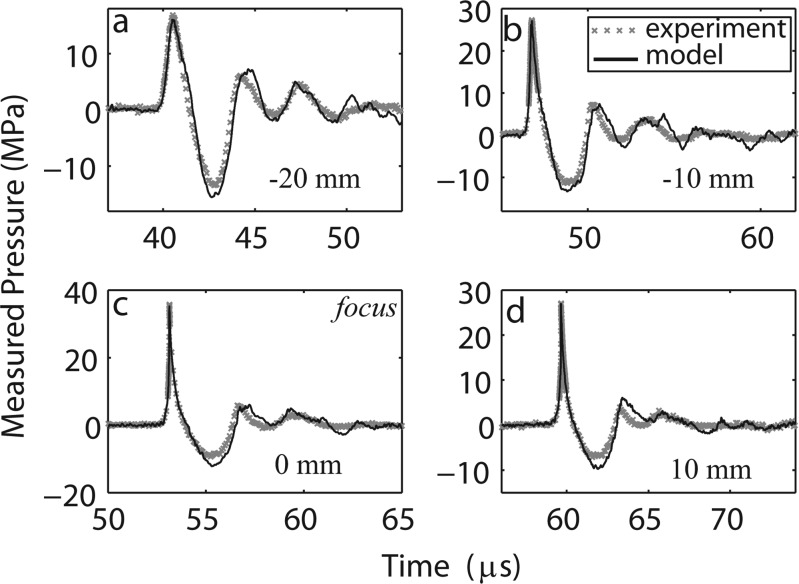
A comparison of measurement and modeling results along the axis of the short standoff is shown in Fig. 8. The simulation results are in good agreement with the experimental data. There appears to be a systematic shift that biases the simulation to slightly more negative values than the data for peak negative pressures, but the discrepancies are all within experimental error. Finally, we show a comparison of actual waveforms at different distances from the short standoff (along the beam axis) in Fig. 9. There is excellent agreement between the measured and modeled axial waveforms, where again, the simulations predict a slightly more negative peak pressure.
Figure 8.
Axial distribution of the averaged peak positive and peak negative pressures measured for the short standoff (black circles) and compared to the modeling results (solid lines) at the highest machine output setting (no. 7, 62 MPa). “Short” corresponds to the position of the therapy head edge of the short standoff.
Figure 9.
Axial waveform measured and modeled for the short standoff at the distances −20 mm (a), −10 mm (b), 0 mm (c, the focus), and 10 mm (d) away from focus at the highest machine output setting (no. 7, 62 MPa). The experimental waveform was averaged over 25 individual waveforms in order to reduce the noise level.
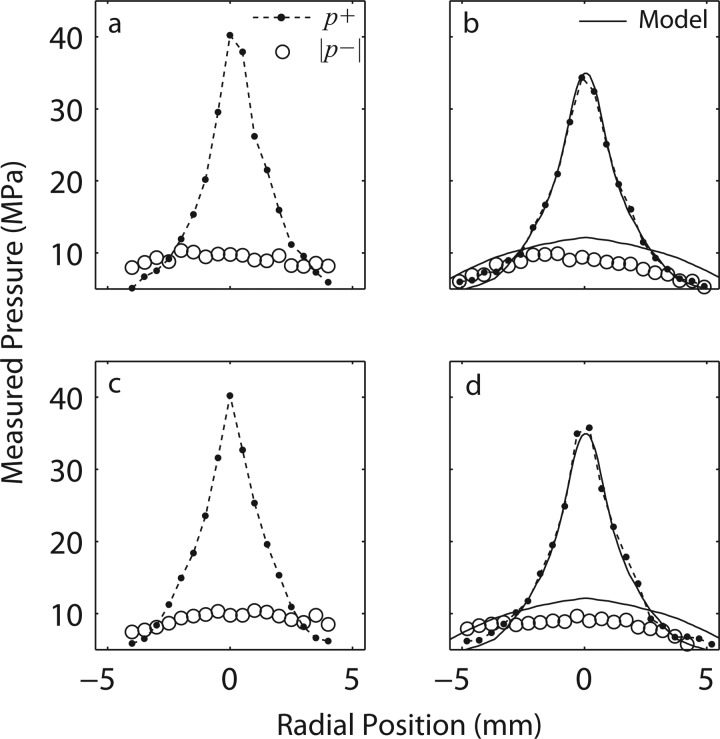
The radial (transverse) scans for both long [(a) and (c)] and short [(b) and (d)] standoffs (at setting no. 7, Table TABLE I.) in the focal plane are shown in Fig. 10. For the short standoff, the corresponding simulation results are also shown (represented by the solid line in Figs. 10b, 10d. The modeling results are in excellent agreement with the measurements, but the simulations again predict a slightly more negative peak pressure (absolute values are shown).
Figure 10.
Radial (transverse) scans at the focus for both long and short standoffs. The labels and legends apply for all of the plots: (a) and (c) - x and y scan for the 30 mm standoff; (b) and (d) - x and y scan for the 15 mm standoff. The coordinate x corresponds to the vertical direction and y - to in and out of the page from geometry of Fig. 2. Each figure represents the peak positive pressure and absolute value of the peak negative pressure. Modeling results are presented for the short standoff experiments (b) and (d).
By combining all the measurements together from different axial and radial scans the focal zones were constructed for each standoff, and are shown in the diagram of Fig. 1. The focal zone was defined as the −3 dB region where peak positive pressures are within 70.8% of their maximum values. The measured −3 dB focal zone is narrower with the 30 mm standoff [17 × 1.5 × 1.5 mm] compared to that of the 15 mm standoff [24 × 1.8 × 1.8 mm]. While measurements were performed only along the axis and radially in the focal plane, simulations provided full reconstruction of the spatial structure of the field. Shown in Fig. 11 are simulations of the 2D spatial distributions of the peak positive (left) and peak negative pressure fields (middle), and energy density (right) for the short standoff, at the highest machine output. The plots indicate that the spatial distributions of the peak pressures and the energy densities are very different. The spatial maximum of the peak negative pressure is located 20 mm closer to the therapy head than the maximum of the peak positive pressure; the focal region for p− is much larger (the −3 dB focal zone for p− is > 27.6 mm × 4.9 mm compared to the one for p+ of 23.7 mm × 1.8 mm). The energy density has a maximum at −18.3 mm (closer to the head than both p+ and p−) and has a −3 dB focal zone of >26.3 mm × 5.2 mm. The values above, which are extracted from the 2D modeled figures, agree very well with the experimental focal zone measurements already provided. This may have important consequences for therapy, depending on whether the positive (associated with stress) or negative (associated with cavitation) component is responsible for therapeutic bioeffects.
Figure 11.
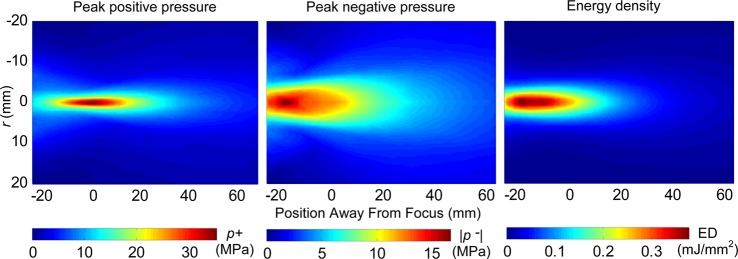
(Color online) Two-dimensional spatial distributions of the peak positive (left) and peak negative (middle) pressures, and energy density (right) in the field generated with the short standoff obtained in the modeling.
Peak pressures at different machine settings
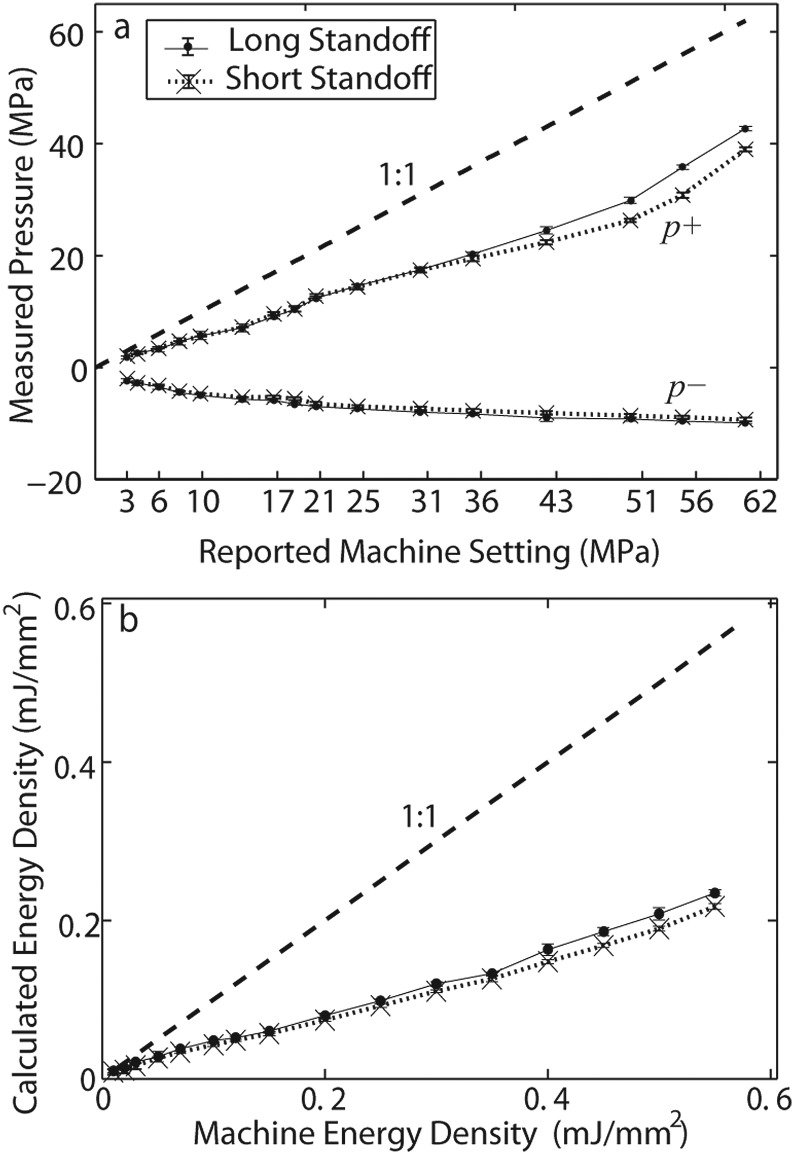
The peak positive and negative pressure and calculated energy density at the focus at each setting for both standoffs are shown in Fig. 12. Because the position of the focus on the beam axis changes due to nonlinear wave propagation, the hydrophone was scanned for each new setting to find the spatial maximum of the peak positive pressure. A total of 25 waveforms were independently recorded at each machine output setting. The means and standard deviations are displayed.
Figure 12.
(a) p+ and p− pressures measured at each machine output setting for both standoffs. (b) Calculated energy density (E.D.) at each machine setting for both standoffs. 1:1 line plotted for comparison on each plot. Measurements were collected at the measured focal point starting with the highest energy level and recording 25 waveforms independently for each energy level. Means and standard deviations (error bars) are shown.
The results shown in Fig. 12a indicate that neither standoff generates peak positive pressures that correspond to the machine display settings shown by the dashed line and labeled as 1:1. The measured pressure, except at the extreme lowest machine settings, is always less than the displayed setting. The peak negative pressures increase as the machine setting is increased. The trends for both standoffs are quantitatively the same. On the other hand, the peak positive pressures diverge slightly at higher machine settings, with the long standoff having slightly higher pressure amplitudes. As the machine settings were increased, the peak negative pressures increased at a slower rate than peak positive pressures.
The Duolith settings also display an energy level (in mJ/mm2). Figure 12b compares the pulse intensity integral calculated from the actual waveform to the machine display. Again, the measured energy density was much less than the displayed setting at all levels except the lowest.
Variation of peak pressures at different pulse repetition frequencies (PRF)
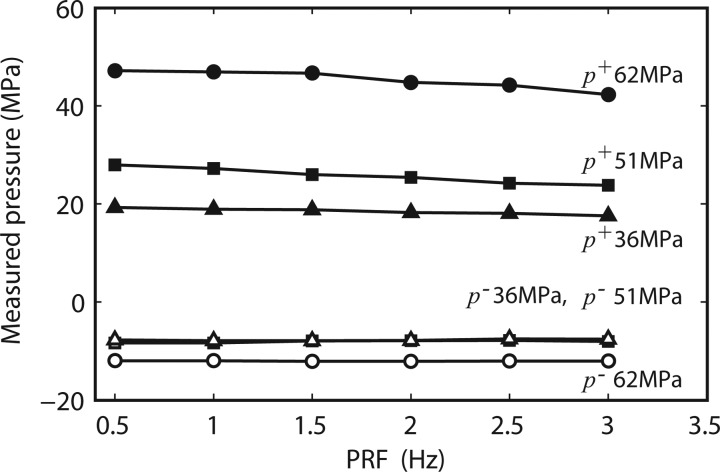
Three different machine settings were compared to determine if the pulse repetition frequency (PRF) affected peak positive or negative pressures (Fig. 13). The measurements were done at the focus using the long standoff. The PRF setting affected the peak positive pressures only when the PRF was set above 2.5 Hz. The maximum amplitude reduction was between 9% and 15%. 3 Hz was the maximum PRF available for these settings.
Figure 13.
Change in p+ (solid symbols) and p− (open symbols) pressure with respect to a change in machine PRF for three selected machine output settings: 62 MPa (no. 7), 51 MPa (no. 5), and 36 MPa (no. 4). The long 30 mm standoff was used for these measurements. Data acquired shows averaged pulses (50 pulses averaged) at a specific PRF. Means and STDs are less than 2% in all the cases.
Rise time measurements
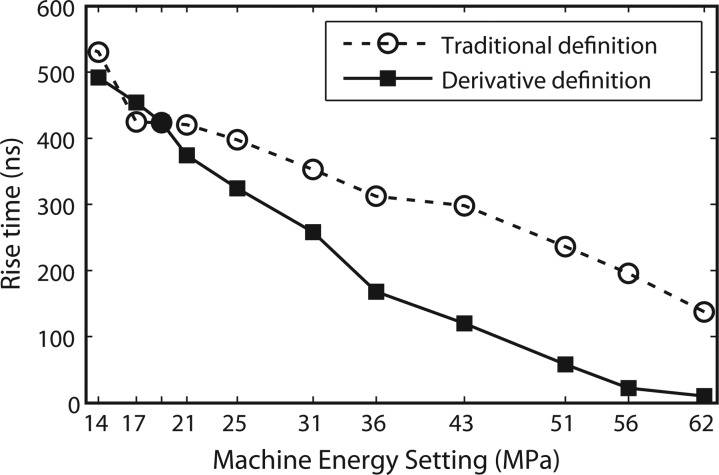
The rise times were calculated using the long standoff for most machine settings following the definition described in Sec. 2B along with the traditional definition for comparison, and are shown in Fig. 14. However, because there is noise in the measured waveforms, the derivative will also have noise. To reduce the noise levels for settings below no. 5, finite impulse response (FIR) filtering was implemented to smooth out the function around the peak in the derivative (see Fig. 3, inset). In general, as the output levels decreased, the rise times increased, from a minimum of 8 ns at setting no. 7 (Table TABLE I.), to almost 500 ns at a low machine setting (not shown in Table TABLE I.).
Figure 14.
Rise time versus machine setting pressure levels for most of the machine settings using the long standoff. The rise time of the shock front of the electromagnetic source at a range of machine output settings is measured from averaged waveforms obtained at the beam focus. Rise time called “derivative definition” was calculated at the 36% level of the derivative of the pressure wave based on Fig. 3. The “traditional definition” is the standard rise time from 10% to 90% of p+. Settings between no. 2 and no. 1 (Table TABLE I.) are difficult to detect since the signal is very noisy and the noise level is comparable to the amplitude when the derivative is calculated. A more powerful derivative method could be implemented to calculate rise times in these low amplitude sinusoidal-like waveforms.
DISCUSSION
The pressure field of a clinical shock wave device, the Storz Medical Duolith SD1 T-Top, was studied in detail. In particular, measurements were performed with two standoffs for the electromagnetic therapy head (30 and 15 mm in length). Several aspects of the measurements are worth additional discussion, including differences between standoffs, and comparisons with simulations.
The Duolith SD1 has several operating modes. The electromagnetic handpiece can be configured without a standoff, or with one of two different length standoffs. The standoffs are advertised as a way to mechanically change the “therapeutic penetration depth.” Our goal was not to measure every possible configuration. Instead, we compared some aspects of the two standoffs, and at other times, performed detailed measurements from one or the other standoff.
The SD1 output can be displayed in units of pressure (MPa) or energy flux density (mJ/mm2). Peak pressure amplitudes (or calculated energy densities based on the measured waveform) measured in this study were lower than the values displayed on the device (see Fig. 12). However, the focal lengths for the two standoffs were similar to device specifications. There is a large discrepancy between our measurements and those reported by the manufacturer. Their in-house measurements were performed without a coupling cone; the measurement equipment was different as well, but not specified by the manufacturer. These differences in experimental conditions may account for the major discrepancies observed. (Personal communication with Storz.)
There is also a difference in p+ between the two standoffs at the higher machine settings (Fig. 12). This may be due to extra focusing and stronger nonlinear effects caused by the difference in the lengths of the standoffs (15 mm). That is, each standoff is filled with oil (proprietary information); the sound speed for some oils (e.g., silicon oil, 1350 m/s) is lower than in water. The linear focusing gain, which is inversely proportional to the sound speed, is thus increased for the longer standoff. In addition, nonlinear effects are also stronger in a medium with lower sound speed, leading to further enhancement of the focusing gain.43, 50 The difference in standoff lengths also resulted in a slight narrowing of the focal region of the beam in the axial scan (Fig. 7). But the differences are not large. This suggests that selection of a particular standoff is indeed related to the advertised function of mechanically changing the focus.
Peak positive and negative pressures measured at different PRFs showed relatively little change (Fig. 13). There is only a slight drop off in pressure amplitude at the highest PRFs (maximum drop was 15% for p+ at the highest setting). The drop-off may be a function of the device electronics, but also, at higher PRFs, cavitation may occur. Signals affected by cavitation can show a reduction in level, but our observations of signals affected by cavitation usually result in a much different waveform, not just a slight reduction in signal amplitude; this was not observed. We believe the amplitude reduction is a function of the device itself.
One of the important issues of using shock wave therapy devices is the question whether or not they actually produce shock waves. In addition to being an intriguing question in terms of nonlinear wave physics, it also has an important clinical implication, as the width of the shock might be responsible for various bioeffects. This is worth some discussion.
The potential for shock formation was evaluated by examining the rise time of the acoustic pulse at several machine settings. Details of the procedure used to calculate the rise time is discussed in Secs. 2B, 3. The standard definition from 10% to 90% of the peak positive pressure is not accurate if the shock wave is superimposed with an earlier-arriving smooth pressure-wave (the “pedestal”) as observed in Fig. 3. This slow rise may be due to capacitive effects, or perhaps the inertia of the cylindrical coil plate that has to expand and generate the cylindrical wave. Electrohydraulic lithotripters do not have a pedestal wave as spark discharges are generated almost instantaneously. Furthermore, the propagation distance to the focus is longer in lithotripters than in ESWT devices and thus nonlinear effects, which are cumulative in nature, are stronger. Once the shock is formed prefocally, it propagates with higher speed than the ambient sound and overrides the preshock low amplitude component of the pulse. When measuring rise times using the traditional definition, the reported measurements for rise times of electromagnetic sources are on the order of hundreds of nanoseconds.18, 19
When using the proposed definition of rise time that excludes the smooth pedestal part, the values agree with some electrohydraulic and piezo electric shock wave devices in which rise times are tens of nanoseconds or equal to the bandwidth limit of the hydrophone.18, 19 However, the rise time for the electromagnetic device measured at the highest output setting was about 8 ns, which is still 30 times longer than the theoretical rise time of a quasi-stationary shock (0.27 ns) with the same amplitude. Because shorter rise times cannot be measured with the FOPH, the question is whether the shock has not been formed, or was simply not resolved.
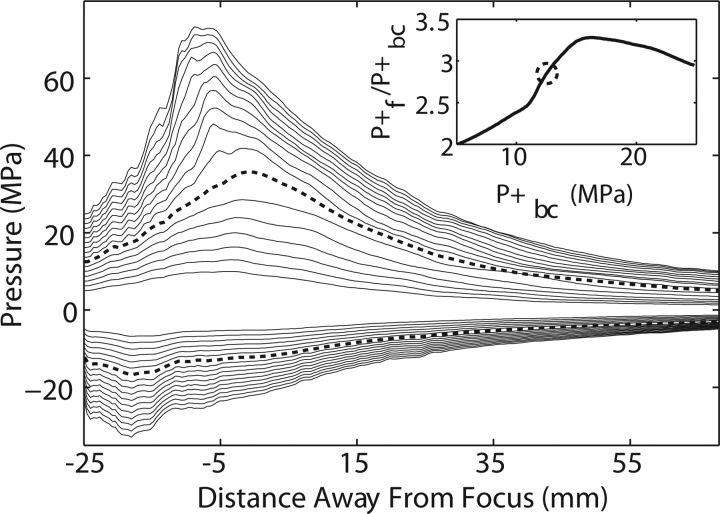
The structure of a weak shock in a nonlinear viscous medium is determined by a balance between nonlinear and dissipation effects as the wave propagates in the medium. Dissipation at the shock front is very strong, therefore once the shock is formed prefocally, its propagation is accompanied by energy losses that lead to reduction of the focusing gain of the peak positive pressure.41, 43, 50, 51, 52 In these previous simulation studies it was shown that the maximum focusing gain of the peak positive pressure is reached at an output level when the shock starts to develop at the focus. Here, additional simulations were performed to determine if a shock would develop if higher pressures were achieved. This was done by scaling the pressure amplitudes of the boundary condition (Fig. 4) from 0.5 to 2 x in steps of 0.1. From these scaled pressures, the axial distributions and focusing gain can be compared for increasing source output. Although this linear scaling does not precisely correspond to changing the output level of the device, it was an adequate approach as nonlinear effects were weak at the distance where measurements for the boundary condition were taken.
The results of these additional simulations are shown in Fig. 15. The dashed lines correspond to (simulations of) the experimental conditions for the short standoff at the highest machine output (no. 7). The inset shows the peak positive focusing gain, given by the ratio of p+ at the focus to its initial value at the boundary, as a function of the source pressure output. Formation of a shock is expected when the focusing gain curve reaches a maximum. In our case, the experimental conditions correspond to the output level that is lower than the level of the maximum focusing gain, i.e., the shock has not yet formed. Unfortunately, it was not possible to resolve the fine structure of shocks with 2 ns time steps used in the modeling, and the simulations became unreasonably long with finer grid. But the focusing gain curve (inset) does suggest that a shock has not formed. Apparently, if the device could generate an extra factor of 2 in pressure at the source, a shock may indeed form at the focus.
Figure 15.
Simulations of the axial peak pressure distributions. Inset: The focusing gain for the peak positive pressure (inset). The dashed lines correspond to the results simulating the experimental conditions for the short standoff at the highest machine output (no. 7, Table TABLE I.). The inset shows the ratio of the peak positive pressure at the focus to its initial value at the boundary as a function of the source pressure output. The dashed circle in the inset indicates the experimental point corresponding to that gain curve.
Figure 15 also illustrates how the focal zone changes with source pressure amplitude. With an increase in source output, the position of the spatial maximum of p+ on the beam axis changes non-monotonically. It first moves away from the source and then backward. This effect is typical for nonlinear focused beams and has been observed in the earlier studies.50, 52 The shift away from the source is characteristic for focusing without formation of shocks. It is caused by strengthening of the nonlinear self-refraction phenomenon because the speed of the pulse front depends on its amplitude. At very high source outputs, when a shock is formed prefocally, strong absorption at the shock results in diminishing of the peak positive pressure and the maximum moves backward. Note also that the maximum shift in the natural focus from the lowest to highest setting is about 6 mm. The peak negative pressure maximum always moves toward the source with the increase of its output.
Therapeutic bioeffects from ESWT are often categorized as being due to the peak pressure (p+), rise time, or negative pressure (both peak and duration). The peak positive pressure and/or the rise time can generate compressional and shear stresses that might generate a bioeffect. If so, higher settings would most likely generate larger bioeffects, although at low settings, the secondary pulse becomes a significant fraction of the main pulse height (see text describing Fig. 3), suggesting that at these settings the machine generates a pulse “doublet.” Negative pressures are associated with cavitation. As the machine setting is increased, the peak negative pressure also increases, but also, so does the length of the tensile tail. This suggests that the cavitation fields will have longer characteristic lifetimes, possibly inducing more violent collapses, and more bioeffects. Note also that the size and position of the positive and negative pressure fields differ (Fig. 11). The negative pressure field is broader and is focused closer to the therapy head than is the positive pressure field.
Returning to the rise time, according to our own experimental data shown in Fig. 3, a rise time measurement of 8 ns would correspond to a spatial scale on the order of 10 μm, which is comparable to the typical size of cells (1–100 μm). Thus many cells could experience an internal pressure gradient. According to Cleveland and Mcateer,23 although tissue is usually robust to isotropic compression, a leading shock front with rise times on the order of 70 ns (spatial scale of 100 μm) suggests that structures in the range of 10 μm to 1 mm will experience a significant variation in stress across them as the shock wave passes. The short rise time associated with the shock will lead to non-uniform straining of the tissue, resulting in shear forces. Lokhandwalla et al. showed that hemolysis is directly related to the pressure gradient at the shock and validated shearing as a cell lysis mechanism in SWL.53 It has also been shown that tissue structures are sensitive to shear stress and that the distortion of tissue by a shock wave can cause damage.54 We thus hypothesize that mechanical tissue damage is associated with a shock front. In addition, mechanoreceptors in cells can be affected by shear. According to Wang et al., application of a mechanical stimulus like shear stress to a cell turns on mechanosensitive ion channels, heterotrimeric G proteins, protein kinases, and other signaling molecules; these trigger downstream signaling cascades that lead to force-dependent changes in gene expression.55 Based on all the above we conclude that shear stresses from the shock front might be an active mechanism for ESWT. It is thus important to determine whether or not therapeutic bioeffects are due to the positive (i.e., stress) or negative (e.g., cavitation) pressures in order to optimize ESWT treatments. For example, if shear stress were the major therapeutic mechanism, then treatments for near-surface conditions (i.e., wound healing) might benefit from the longer standoff.
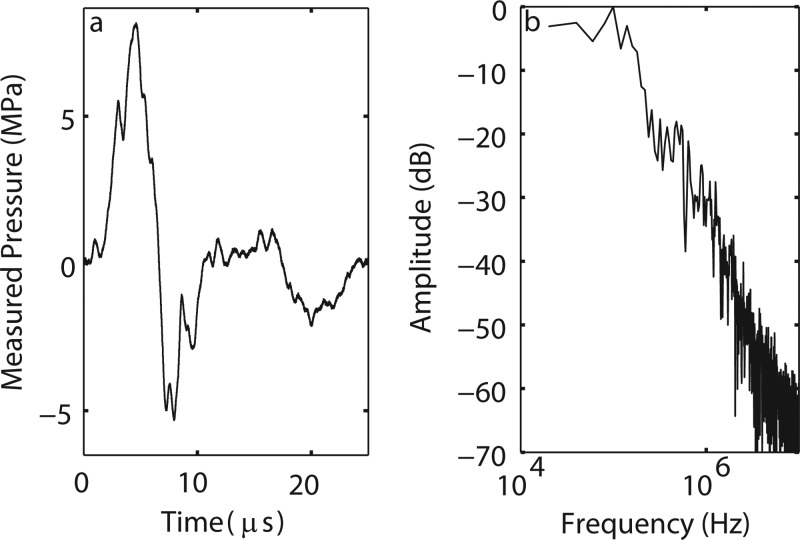
The focus of this paper has been on the electromagnetic therapy head. The Duolith also comes with a ballistic (termed ‘radial shock wave’) source. A previous study showed that ballistic sources do not generate a shock wave.22 For completeness, we show a characteristic averaged pressure waveform (20 averages) from the Duolith ballistic source at a setting of 5 bar in Fig. 16. The pulse consists of a leading positive phase with p+ = 8 MPa and duration of 5 μs. The trailing negative phase has p− = −5.7 MPa. The spectrum of the wave is shown in Fig. 16b. Most of the energy is contained at or below 200 kHz. The energy flux density is 0.115 mJ/mm2, calculated according to the PII described in Sec. 2. The measurements taken here for the ballistic source are similar, but not identical to the ones presented by Chitnis and Cleveland 2007 for the Dolorclast Vet device (our measurements have lower peak negative pressures).22 Although the signal does not resemble a shock wave, the International Society for Medical Shockwave Treatment (ISMST) defines it as a shock wave.
Figure 16.
The pressure waveform (a) and corresponding spectrum (b) measured at a distance of 5 mm from the metal applicator for the ballistic source operated at 5 bar setting level.
The measurements reported here are important for device characterization and understanding wave propagation in water, but for in vivo settings, especially in musculoskeletal tissues, the waveform shape and amplitude would be expected to differ greatly from in vitro results. Bones and inhomogeneous tissues will create complicated reflections and re-focusing, and shear waves that can disturb the field and shift the focus as well. This is the direction of our future efforts.56, 57
CONCLUSION
In this paper it was shown that the combination of measurements together with mathematical modeling provided a suitable tool for acoustic characterization of high intensity pressure fields generated by electromagnetic shock wave medical devices. Acoustic parameters of the field of a clinical device used to treat musculoskeletal conditions in patients were measured using a fiber optic hydrophone: focal peak pressures, axial and radial distributions, and rise time of the pulse front were determined at several machine power output settings. Radial scanning in the plane close to the therapy head was performed at the highest output setting and the results were used as a boundary condition for an acoustic nonlinear propagation model. The results of modeling were validated by comparing pressure waveforms obtained in simulations and measurements. Simulation data provided additional information on the spatial distributions of the peak pressures and the degree of nonlinear effects to form a shock in the pulse at the focus. It was shown that shock formation did not occur for any machine settings and that a true shock formation could be reached if the maximum initial pressure output of the device is doubled. Although characterization was performed in water and strong distortions of the field occur while propagating through the complicated musculoskeletal geometries and impedances that are present in the human body, this study provides the important step at calibrating a device toward understanding the implication of high intensity pressure fields in vivo.
ACKNOWLEDGMENTS
This work was supported in parts by the National Institute of Health (NIAMS: AR053652 and NIBIB: EB007643) and by the Russian Foundation for Basic Research (10-02-91062-CNRS and 12-02-31830). Numerical simulations were performed on the SKIF “Chebyshev” and the “Lomonosov” clusters of the supercomputer center at Moscow State University. The authors want to thank Oleg A. Sapozhnikov, Wayne Kreider, and Parag Chitnis for helpful discussions and Pavel Novak (Storz Medical) for advice and help with setting up the Duolith.
References
- Kudo P., Dainty K., Clarfield M., Coughlin L., Lavoie P., and Lebrun C., “ Randomized, placebo-controlled, double-blind clinical trial evaluating the treatment of plantar fasciitis with an extracoporeal shock wave therapy (ESWT) device: a North American confirmatory study,” J. Orthop. Res. 24, 115–123 (2006). 10.1002/jor.20008 [DOI] [PubMed] [Google Scholar]
- Rompe J. D., Decking J., Schoellner C., and Nafe B., “ Shock wave application for chronic plantar fasciitis in running athletes: a prospective, randomized, placebo-controlled trial,” Am. J. Sports Med. 31, 268–275 (2003). [DOI] [PubMed] [Google Scholar]
- Gerdesmeyer L., Wagenpfeil S., Haake M., Maier M., Loew M., Wörtler K., Lampe R., Seil R., Handle G., Gassel S., and Rompe J. D., “ Extracorporeal shock wave therapy for the treatment of chronic calcifying tendonitis of the rotator cuff: a randomized controlled trial,” JAMA-J. Am. Med. Assoc. 290, 2573–2580 (2003). 10.1001/jama.290.19.2573 [DOI] [PubMed] [Google Scholar]
- Furia J. P., “ Safety and efficacy of extracorporeal shock wave therapy for chronic lateral epicondylitis,” Am. J. Orthop. (Belle Mead, NJ). 34, 13–19 (2005). [PubMed] [Google Scholar]
- Rompe J. D., “ Repetitive low-energy shock wave treatment for chronic lateral epicondylitis in tennis players,” Am. J. Sports Med. 32, 734–743 (2004). 10.1177/0363546503261697 [DOI] [PubMed] [Google Scholar]
- Peers K., Extracorporeal Shock Wave Therapy in Chronic Achilles and Patellar Tendinopathy (Leuven University Press, Leuven (Belgium), 2003), pp. 61–75. [Google Scholar]
- Yoo S. D., Choi S., Lee G.-J., Chon J., Jeong Y. S., Park H.-K., and Kim H.-S., “ Effects of extracorporeal shock wave therapy on nanostructural and biomechanical responses in the collagenase-induced Achilles tendinitis animal model,” Laser. Med. Sci. 27, 1195–1204 (2012). 10.1007/s10103-011-1049-0 [DOI] [PubMed] [Google Scholar]
- Valchanou V. D. and Michailov P., “ High energy shock waves in the treatment of delayed and nonunion of fractures,” Int. Orthop. 15, 181–184 (1991). [DOI] [PubMed] [Google Scholar]
- Wang C.-J., Wang F.-S., Yang K. D., Weng L.-H., Hsu C.-C., Huang C.-S., and Yang L.-C., “ Shock wave therapy induces neovascularization at the tendon-bone junction. A study in rabbits,” J. Orthop. Res. 21, 984–989 (2003). 10.1016/S0736-0266(03)00104-9 [DOI] [PubMed] [Google Scholar]
- Meirer R., Huemer G. M., Oehlbauer M., Wanner S., Piza-Katzer H., and Kamelger F. S., “ Comparison of the effectiveness of gene therapy with vascular endothelial growth factor or shock wave therapy to reduce ischaemic necrosis in an epigastric skin flap model in rats,” J. Plast. Reconstr. Aesthet. Surg. 60, 266–271 (2007). 10.1016/j.bjps.2005.12.050 [DOI] [PubMed] [Google Scholar]
- Meirer R., Brunner A., Deibl M., Oehlbauer M., Piza-katzer H., and Kamelger F. S., “ Shock wave therapy reduces necrotic flap zones and induces vegf expression in animal epigastric skin flap model,” J. Reconstr. Microsurg. 23, 231–235 (2007). 10.1055/s-2007-981506 [DOI] [PubMed] [Google Scholar]
- Wang C.-J., Sun Y.-C., Wong T., Hsu S.-L., Chou W.-Y., and Chang H.-W., “ Extracorporeal shock wave therapy shows time-dependent chondroprotective effects in osteoarthritis of the knee in rats,” J. Surg. Res. 178, 196–205 (2012). 10.1016/j.jss.2012.01.010 [DOI] [PubMed] [Google Scholar]
- Wang C.-J., “ Extracorporeal shock wave therapy in musculoskeletal disorders,” J. Orthop. Surg. Res. 7, 11 (2012). 10.1186/1749-799X-7-11 [DOI] [PMC free article] [PubMed] [Google Scholar]
- Wang C.-J., “ An overview of shock wave therapy in musculoskeletal disorders,” Chang Gung Med. J. 26, 220–232 (2003). [PubMed] [Google Scholar]
- Mariotto S., Cavalieri E., Amelio E., Ciampa A. R., de Prati A. C., Marlinghaus E., Russo S., and Suzuki H., “ Extracorporeal shock waves: from lithotripsy to anti-inflammatory action by NO production,” Nitric. Oxide-Biol. Ch. 12, 89–96 (2005). 10.1016/j.niox.2004.12.005 [DOI] [PubMed] [Google Scholar]
- Ito K., Fukumoto Y., and Shimokawa H., “ Extracorporeal shock wave therapy as a new and non-invasive angiogenic strategy,” Tohoku. J. Exp. Med. 219, 1–9 (2009). 10.1620/tjem.219.1 [DOI] [PubMed] [Google Scholar]
- Notarnicola A., Moretti L., Tafuri S., Gigliotti S., Russo S., Musci L., and Moretti B., “ Extracorporeal shock waves versus surgery in the treatment of pseudoarthrosis of the carpal scaphoid,” Ultrasound Med. Biol. 36, 1306–1313 (2010). 10.1016/j.ultrasmedbio.2010.05.004 [DOI] [PubMed] [Google Scholar]
- Coleman A. J. and Saunders J. E., “ A survey of the acoustic output of comercial extracorporeal shock wave lithotripters,” Ultrasound Med. Biol. 15, 213–227 (1989). 10.1016/0301-5629(89)90066-5 [DOI] [PubMed] [Google Scholar]
- Buizza A., Dell'Aquila T., Giribona P., and Spagno C., “ The performance of different pressure pulse generators for extracorporeal lithotripsy: A comparison based on commercial lithotripters for kidney stones,” Ultrasound Med. Biol. 21, 259–272 (1995). 10.1016/S0301-5629(94)00104-9 [DOI] [PubMed] [Google Scholar]
- Cleveland R. O., Bailey M. R., Fineberg N., Hartenbaum B., Lokhandwalla M., McAteer J. A., and Sturtevant B., “ Design and characterization of a research electrohydraulic lithotripter patterned after the Dornier HM3,” Rev. Sci. Instrum. 71, 2514–2525 (2000). 10.1063/1.1150643 [DOI] [Google Scholar]
- Chitnis P. V. and Cleveland R. O., “ Acoustic and cavitation fields of shock wave therapy devices,” AIP Conference Proceedings (American Institute of Physics, New York, 2006), pp. 440–444.
- Cleveland R. O., Chitnis P. V., and McClure S. R., “ Acoustic field of a ballistic shock wave therapy device,” Ultrasound Med. Biol. 33, 1327–1335 (2007). 10.1016/j.ultrasmedbio.2007.02.014 [DOI] [PubMed] [Google Scholar]
- Cleveland R. O. and McAteer J. A., Physics of Shock wave Lithotripsy in Smith's Textbook of Endourology (Wiley-Blackwell, 2012), pp. 317–332. [Google Scholar]
- Gollwitzer H., Diehl P., von Korff A., Rahlfs V. W., and Gerdesmeyer L., “ Extracorporeal shock wave therapy for chronic painful heel syndrome: a prospective, double blind, randomized trial assessing the efficacy of a new electromagnetic shock wave device,” J. Foot. Ankle. Surg. 46, 348–357 (2000). [DOI] [PubMed] [Google Scholar]
- Müller P., Guggenheim B., Attin T., Marlinghaus E., and Schmidlin P. R., “ Potential of shock waves to remove calculus and biofilm,” Clin. Oral. Investig. 15, 959–965 (2011). 10.1007/s00784-010-0462-2 [DOI] [PubMed] [Google Scholar]
- Tinazzi E., Amelio E., Marangoni E., Guerra C., Puccetti A., Codella O. M., Simeoni S., Cavalieri E., Montagnana M., Adani R., Corrocher R., and Lunardi C., “ Effects of shock wave therapy in the skin of patients with progressive systemic sclerosis: a pilot study,” Rheumatol. Int. 31, 651–656 (2011). 10.1007/s00296-009-1339-z [DOI] [PubMed] [Google Scholar]
- Zimmermann R., Cumpanas A., Hoeltl L., Janetschek G., Stenzl A., and Miclea F., “ Extracorporeal shock-wave therapy for treating chronic pelvic pain syndrome: a feasibility study and the first clinical results,” BJU Int. 102, 976–980 (2008). 10.1111/j.1464-410X.2008.07742.x [DOI] [PubMed] [Google Scholar]
- van der Worp H., Zwerver J., van den Akker-Scheek I., and Diercks R. L., “ The TOPSHOCK study: Effectiveness of radial shock wave therapy compared to focused shock wave therapy for treating patellar tendinopathy – design of a randomised controlled trial,” BMC Musculoskelet. Disord. 12, 229–234 (2011). 10.1186/1471-2474-12-229 [DOI] [PMC free article] [PubMed] [Google Scholar]
- Lauer U., Bürgelt E., Squire Z., Messmer K., Hofschneider P. H., Gregor M., and Delius M., “ Shock wave permeabilization as a new gene transfer method,” Gene. Ther. 4, 710–715 (1997). 10.1038/sj.gt.3300462 [DOI] [PubMed] [Google Scholar]
- Bao S., Thrall B. D., Gies R. A., and Miller D. L., “ In vivo transfection of melanoma cells by lithotripter shock waves,” Cancer. Res. 58, 219–221 (1998). [PubMed] [Google Scholar]
- Rompe J. D., Rosendahl T., Schöllner C., and Theis C., “ High-energy extracorporeal shock wave treatment of nonunions,” Clin. Orthop. Relat. Res. 387, 102–111 (2001). 10.1097/00003086-200106000-00014 [DOI] [PubMed] [Google Scholar]
- Schoellner C., Rompe J. D., Decking J., and Heine J., “ High energy extracorporeal shock wave therapy (ESWT) in pseudarthrosis,” Der Orthopäde 31, 658–662 (2002). 10.1007/s00132-002-0326-9 [DOI] [PubMed] [Google Scholar]
- Ludwig J., Lauber S., Lauber H. J., Dreisilker U., Raedel R., and Hotzinger H., “ High-energy shock wave treatment of femoral head necrosis in adults,” Clin. Orthop. Relat. Res. 387, 119–126 (2001). 10.1097/00003086-200106000-00016 [DOI] [PubMed] [Google Scholar]
- Vogel J., Rompe J. D., Hopf C., Heine J., and Bürger R., “ High-energy extracorporeal shock-wave therapy (ESWT) in the treatment of pseudarthrosis,” Z Orthop Ihre Grenzgeb 135, 145–149 (1997). 10.1055/s-2008-1039571 [DOI] [PubMed] [Google Scholar]
- Endres S., Weiskirch M., Hinz C., Hütter F., and Wilke A., “ Extracorporeal shock-wave therapy in the treatment of pseudoarthrosis: a case report,” Cases. J. 1, 276 (2008). 10.1186/1757-1626-1-276 [DOI] [PMC free article] [PubMed] [Google Scholar]
- Zimmermann R., Cumpanas A., Miclea F., and Janetschek G., “ Extracorporeal shock wave therapy for the treatment of chronic pelvic pain syndrome in males: a randomised, double-blind, placebo-controlled study,” Eur. Urol. 56, 418–424 (2009). 10.1016/j.eururo.2009.03.043 [DOI] [PubMed] [Google Scholar]
- Palmieri A., Imbimbo C., Longo N., Fusco F., Verze P., Mangiapia F., Creta M., and Mirone V., “ A first prospective, randomized, double-blind, placebo-controlled clinical trial evaluating extracorporeal shock wave therapy for the treatment of Peyronie's disease,” Eur. Urol. 56, 363–369 (2009). 10.1016/j.eururo.2009.05.012 [DOI] [PubMed] [Google Scholar]
- Moen M. H., Rayer S., Schipper M., Schmikli S., Weir A., Tol J. L., and Backx F. J. G., “ Shock wave treatment for medial tibial stress syndrome in athletes; a prospective controlled study,” Br. J. Sports. Med. 46, 253–257 (2012). 10.1136/bjsm.2010.081992 [DOI] [PubMed] [Google Scholar]
- Kreider W., Sapozhnikov O., Khokhlova V., Farr N., Bailey M., Kaczkowski P., Partanen A., and Brazzle D., “ Acoustic measurements and holographic reconstruction of the Philips MR-guided HIFU source,” in Program and Abstract Book “Current and Future Applications of MR-guided Focused Ultrasound 2010,” 2nd International Symposium, 17–20 October 2010, Washington, D.C. (2010), p. 79.
- Khokhlova V. A., Ponomarev A. E., Averkiou M. A., and Crum L. A., “ Nonlinear pulsed ultrasound beams radiated by rectangular focused diagnostic transducers,” Acoust. Phys. 52, 481–489 (2006). 10.1134/S1063771006040178 [DOI] [Google Scholar]
- Khokhlova V. A., Souchon R., Tavakkoli J., Sapozhnikov O. A., and Cathignol D., “ Numerical modeling of finite-amplitude sound beams: Shock formation in the near field of a cw plane piston source,” J. Acoust. Soc. Am. 110, 95–108 (2001). 10.1121/1.1369097 [DOI] [Google Scholar]
- Averkiou M. A. and Cleveland R. O., “ Modeling of an electrohydraulic lithotripter with the KZK equation,” J. Acoust. Soc. Am. 106, 102–112 (1999). 10.1121/1.427039 [DOI] [PubMed] [Google Scholar]
- Canney M. S., Bailey M. R., Crum L. A., Khokhlova V. A., and Sapozhnikov O. A., “ Acoustic characterization of high intensity focused ultrasound fields: a combined measurement and modeling approach,” J. Acoust. Soc. Am. 124, 2406–2420 (2008). 10.1121/1.2967836 [DOI] [PMC free article] [PubMed] [Google Scholar]
- Eisenmenger W. and Staudenraus J., “ Fibre-optic probe hydrophone for ultrasonic and shock-wave measurements in water,” Ultrasonics 31, 267–273 (1993). [Google Scholar]
- IEC61846, IEC 61846 Ultrasonics-Pressure pulse lithotriptors-Characteristics of fields, International Electrotechnical Commission, Geneva, Switzerland (1998).
- Averiyanov M., Ollivier S., Khokhlova V., and Blanc-Benon P., “ Random focusing of nonlinear acoustic N-waves in fully developed turbulence: laboratory scale experiment,” J. Acoust. Soc. Am. 130, 3595–3607 (2011). 10.1121/1.3652869 [DOI] [PubMed] [Google Scholar]
- Yuldashev P., Ollivier S., Averiyanov M., Sapozhnikov O., Khokhlova V., and Blanc-Benon P., “ Nonlinear propagation of spark-generated N-waves in air: modeling and measurements using acoustical and optical methods,” J. Acoust. Soc. Am. 128, 3321–3333 (2010). 10.1121/1.3505106 [DOI] [PubMed] [Google Scholar]
- Hamilton M. F. and Blackstock D. T., Nonlinear Acoustics (Academic, San Diego, 1998), pp. 117–131. [Google Scholar]
- Kurganov A. and Tadmor E., “ New high-resolution central schemes for nonlinear conservation laws and convection–diffusion equations,” J. Comput. Phys. 160, 241–282 (2000). 10.1006/jcph.2000.6459 [DOI] [Google Scholar]
- Karzova M. M., Averiyanov M. V., Sapozhnikov O. A., and Khokhlova V. A., “ Mechanisms for saturation of nonlinear pulsed and periodic signals in focused acoustic beams,” Acoust. Phys. 58, 81–89 (2012). 10.1134/S1063771011060078 [DOI] [Google Scholar]
- Averiyanov M., Blanc-Benon P., Cleveland R. O., and Khokhlova V., “ Nonlinear and diffraction effects in propagation of N-waves in randomly inhomogeneous moving media,” J. Acoust. Soc. Am. 129, 1760–1772 (2011). 10.1121/1.3557034 [DOI] [PubMed] [Google Scholar]
- Bessonova O. V., Khokhlova V. A., Bailey M. R., Canney M. S., and Crum L. A., “ Focusing of high power ultrasound beams and limiting values of shock wave parameters,” Acoust. Phys. 55, 463–476 (2009). 10.1134/S1063771009040034 [DOI] [PMC free article] [PubMed] [Google Scholar]
- Lokhandwalla M., McAteer J. A., Williams J. C., and Sturtevant B., “ Mechanical haemolysis in shock wave lithotripsy (SWL): II. In vitro cell lysis due to shear.,” Phys. Med. Bio. 46, 1245–1264 (2001). 10.1088/0031-9155/46/4/323 [DOI] [PubMed] [Google Scholar]
- Lokhandwalla M. and Sturtevant B., “ Mechanical haemolysis in shock wave lithotripsy (SWL): I. Analysis of cell deformation due to SWL flow-fields.,” Phys. Med. Bio. 46, 413–437 (2001). 10.1088/0031-9155/46/2/310 [DOI] [PubMed] [Google Scholar]
- Wang N., Tytell J. D., and Ingber D. E., “ Mechanotransduction at a distance: mechanically coupling the extracellular matrix with the nucleus.,” Nat. Rev. Mol. Cell. Biol. 10, 75–82 (2009). 10.1038/nrm2594 [DOI] [PubMed] [Google Scholar]
- Fagnan K. M., Leveque R. J., Matula T. J., and MacConaghy B., “ High-resolution finite volume methods for extracorporeal shock wave therapy,” in Hyperbolic Problems: Theory, Numerics, Applications, edited by Benzoni-Gavage S., and Serre D. (Springer, Berlin, 2008), pp. 503–510. [Google Scholar]
- Matula T. J., MacConaghy B., Ching R., Fagnan K., and LeVeque R. J., “ Measurements of acoustic energy deflection in the presence of replica bone,” ISMST Newsletter 6, 20–22 (2010). [Google Scholar]


