Abstract
This paper presents a computational approach to derive interpretable movement primitives from speech articulation data. It puts forth a convolutive Nonnegative Matrix Factorization algorithm with sparseness constraints (cNMFsc) to decompose a given data matrix into a set of spatiotemporal basis sequences and an activation matrix. The algorithm optimizes a cost function that trades off the mismatch between the proposed model and the input data against the number of primitives that are active at any given instant. The method is applied to both measured articulatory data obtained through electromagnetic articulography as well as synthetic data generated using an articulatory synthesizer. The paper then describes how to evaluate the algorithm performance quantitatively and further performs a qualitative assessment of the algorithm's ability to recover compositional structure from data. This is done using pseudo ground-truth primitives generated by the articulatory synthesizer based on an Articulatory Phonology frame-work [Browman and Goldstein (1995). “Dynamics and articulatory phonology,” in Mind as motion: Explorations in the dynamics of cognition, edited by R. F. Port and T.van Gelder (MIT Press, Cambridge, MA), pp. 175–194]. The results suggest that the proposed algorithm extracts movement primitives from human speech production data that are linguistically interpretable. Such a framework might aid the understanding of longstanding issues in speech production such as motor control and coarticulation.
MOVEMENT PRIMITIVES AND MOTOR CONTROL
Articulatory movement primitives may be defined as a dictionary or template set of articulatory movement patterns in space and time, weighted combinations of the elements of which can be used to represent the complete set of coordinated spatio-temporal movements of vocal tract articulators required for speech production. Extracting interpretable movement primitives from raw articulatory data is important for better understanding, modeling and synthetic reproduction of the human speech production process. Support for this view is well-grounded in the literature on neurophysiology and motor control. For instance, Mussa-Ivaldi and Solla (2004) argue that in order to generate and control complex behaviors, the brain does not need to explicitly solve systems of coupled equations. Instead a more plausible mechanism is the construction of a vocabulary of fundamental patterns, or primitives, that are combined sequentially and in parallel for producing a broad repertoire of coordinated actions. An example of how these could be neurophysiologically implemented in the human body could be as functional units in the spinal cord that each generate a specific motor output by imposing a specific pattern of muscle activation (Bizzi et al., 2008). The authors argue that this representation might simplify the production of movements by reducing the degrees of freedom that need to be specified by the motor control system. In this paper, we (1) present a data-driven approach to extract a spatio-temporal dictionary of articulatory primitives from real and synthesized articulatory data using machine learning techniques; (2) propose methods to validate1 the proposed approach both quantitatively (using various performance metrics) as well as qualitatively [by examining how well it can recover evidence of compositional structure from (pseudo) articulatory data]; (3) show that such an approach can yield primitives that are linguistically interpretable on visual inspection.
Kelso (2009) defines a synergy to be a functional grouping of structural elements (like muscles or neurons) which, together with their supporting metabolic networks, are temporarily constrained to act as a single functional unit. The idea that there exist structural functional organizations (or synergies) that facilitate motor control, coordination and exploitation of the enormous degrees of freedom in complex systems is not a new one. Right from the time of Bernstein (1967), researchers have been trying to understand the problem of coordination—compressing a high-dimensional movement state space into a much lower-dimensional control space (for a review, see Turvey, 1990). Researchers have discovered that a small number of synergies can be used to perform simple tasks such as reaching (e.g., Ma and Feldman, 1995; d'Avella et al., 2006) or periodic tasks such as finger tapping (e.g., Haken et al., 1985). However, the question of how more complex tasks are orchestrated remains an open one (complex tasks could be, for example, combinations of reaching and periodic movements, such as those performed by a skilled guitarist/percussionist). In other words, can we discover a set of synergies that can be used to perform a given complex task? In the following sections, we consider this question for the case of human speech production.
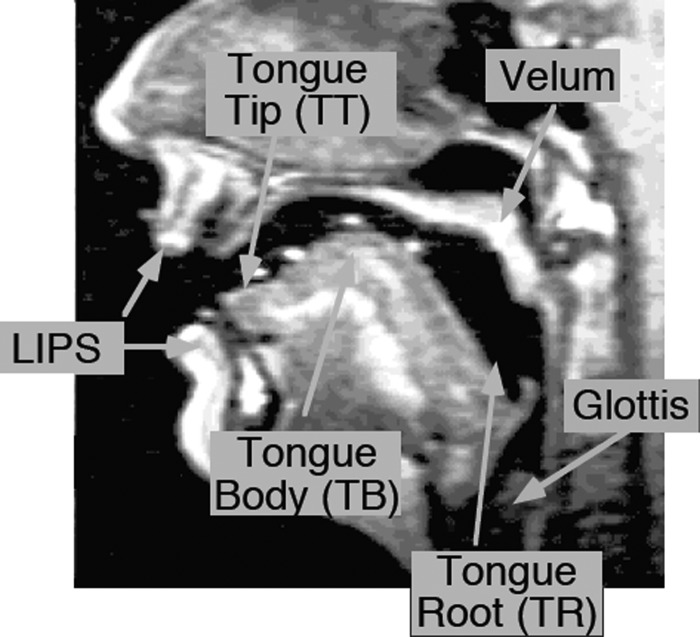
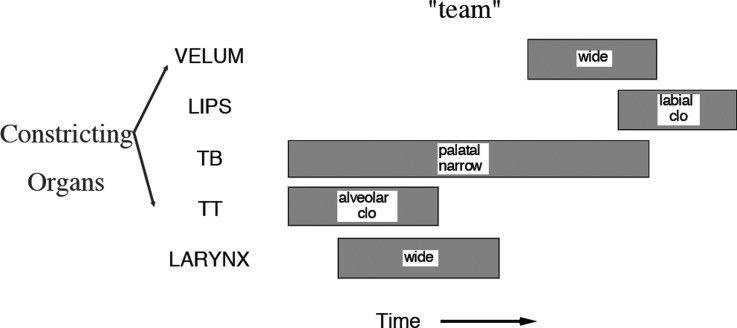
One can approach the problem of formulating a set of primitive representations of the human speech production process in either a knowledge-driven or a data-driven manner. An example of the former from the linguistics (and more specifically, phonology) literature is the framework of Articulatory Phonology (Browman and Goldstein, 1995) which theorizes that the act of speaking is decomposable into units of vocal tract actions termed “gestures.” Under this gestural hypothesis, the primitive units out of which lexical items are assembled are constriction actions of the vocal organs (see Fig. 1 for an illustration of vocal tract constriction organs). When the gestures of an utterance are coordinated with each other and produced, the resulting pattern of gestural timing can be captured in a display called a gestural score. The gestural score of a given utterance specifies the particular gestures that compose the utterance and the times at which they occur. For example, Fig. 2 depicts the hypothesized gestural score for the word “team.” It is important to note that the gestural score does not directly specify a set of lower-level raw articulatory movement trajectories, but how different vocal tract articulators are “activated” in a spatio-temporally coordinated manner with respect to each other at a higher level. Hence these are more akin to the Bizzi et al. (2008) idea of specific patterns of muscle activation, which in turn are realized as specific articulatory movement trajectory patterns (or articulatory primitives). Having said this, it is important to experimentally examine the applicability of such knowledge-driven theories vis-à-vis real speech production data. In this paper, we adopt the less-explored data-driven approach to extract sparse primitive representations from measured and synthesized articulatory data and examine their relation to the gestural activations for the same data predicted by the knowledge-based model described above. We further explore other related questions of interest, such as (1) how many articulatory primitives might be used in speech production, and (2) what might they look like? We view these as first steps toward our ultimate goal of bridging and validating knowledge-driven and data-driven approaches to understanding the role of primitives in speech motor planning and execution.
Figure 1.
(Color online) Vocal tract articulators (marked on a midsagittal image of the vocal tract).
Figure 2.
Gestural score for the word “team.” Each gray block corresponds to a vocal tract action or gesture. See Fig. 1 for an illustration of the constricting organs. Also notice that at any given instant in time, only a few gestures are “on” or “active,” i.e., the activation of the gestural score is sparse in time.
Electromagnetic articulography (EMA) data of vocal tract movements (see, e.g., Wrench, 2000) offer a rich source of information for deriving articulatory primitives that underlie speech production. However, one problem in extracting articulatory movement primitives from this kind of measured data is the lack of ground truth for validation, i.e., we do not know what the actual primitives were that generated the data in question. Hence although experiments on measured articulatory data are necessary in order to further our understanding of motor control of articulators during speech production, they are not sufficient.
We therefore also analyze synthetic data generated by a configurable articulatory speech synthesizer (Rubin et al., 1996; Iskarous et al., 2003) that interfaces with the Task Dynamics model of articulatory control and coordination in speech (Saltzman and Munhall, 1989) within the framework of Articulatory Phonology (Browman and Goldstein, 1995). This functional coordination is accomplished with reference to speech “tasks,” which are defined in the model as constricting primitives or “gestures” accomplished by the various vocal tract constricting devices. Constriction formation is modeled using task-level point attractor dynamical systems that guide the dynamic behavior of individual articulators and their coupling. The entire ensemble is implemented in a software package called Task Dynamics Application (or TaDA) (Nam et al., 2006; Saltzman et al., 2008). The advantage of using such a model is that it allows us to evaluate the similarity of the “information content” encoded by (1) the hypothesized gestures, and (2) the algorithm-extracted primitives (since the model hypothesizes what gestural primitives generate a given set of articulator movements in the vocal tract). This in turn affords us a better understanding of the strengths and drawbacks of both the model as well as the algorithm.
Note that real-time magnetic resonance imaging (or rt-MRI, see for example, Narayanan et al., 2004) is another technique which offers a very high spatial coverage of the vocal tract at the cost of low temporal resolution. In fact, in earlier work, we presented a technique to extract articulatory movement primitives from rt-MRI data (Ramanarayanan et al., 2011). However, validating primitives obtained from rt-MRI using the TaDA synthetic model is not as straightforward as in the case of EMA, where we can directly compare flesh-point trajectories measured to those generated by the synthetic model. Moreover, the temporal resolution in EMA and TaDA is much higher (100–500 Hz) as opposed to rt-MRI (20–30 Hz). Hence we restrict ourselves to the use of EMA data for our analyses in this paper.
Notation
We use the following mathematical notation to present the analysis described in this paper. Matrices are represented by bold uppercase letters (e.g., X), while vectors are represented using bold lowercase letters (e.g., x), while scalars are represented without any bold case (either upper or lower case). We use the notation to denote the matrix transpose of X. Further, if x is an N-dimensional vector, we use the notation to denote that x takes values from the N-dimensional real-valued set. Similarly, denotes that X is a real-valued matrix of dimension M × N. We use the symbols ⊗ and ⊘ to denote element-wise matrix multiplication and division, respectively. Finally, we use the notation to denote that matrix X is formed by collecting the vectors x1, x2,…,xK together as its columns.
REVIEW OF DATA-DRIVEN METHODS TO EXTRACT MOVEMENT PRIMITIVES
Recently there have been studies that have attempted to further our understanding of primitive representations in biological systems using ideas from machine learning and sparsity theory. Sparsity in particular has been shown to be an important principle in the design of biological systems. For example, studies have suggested that neurons encode sensory information using only a few active neurons at any point of time, allowing an efficient way of representing data, forming associations and storing memories (Olshausen and Field, 1997, 2004). Hromádka et al. (2008) have put forth quantitive evidence for sparse representations of sounds in the auditory cortex. Their results are compatible with a model in which most auditory neurons are silent (i.e., not active or spiking) for much of the time, and in which neural representations of acoustic stimuli are composed of small dynamic subsets of highly active neurons. As far as speech production is concerned, phonological theories such as Articulatory Phonology (Browman and Goldstein, 1995) support the idea that speech primitives (or “gestures”) are sparsely activated in time, i.e., at any given time instant during the production of a sequence of sounds, only a few gestures are “active” or “on” (for example, see Fig. 2). However, to our knowledge, no practical computational studies have been conducted into uncovering the primitives of speech production thus far.
Modeling data vectors as sparse linear combinations of basis vectors3 is a general computational approach (termed variously as dictionary learning or sparse coding or sparse matrix factorization depending on the exact problem formulation) which we will use to solve our problem. To recapitulate, the problem is that of extracting articulatory movement primitives, weighted and time-shifted combinations of which can be used to synthesize any spatio-temporal sequence of articulatory movements. Note that we use the terms “basis” and “primitive” to mean the same thing in the mathematical and scientific sense, respectively, for the purposes of this paper. Such methods have been successfully applied to a number of problems in signal processing, machine learning, and neuroscience. For instance, d'Avella and Bizzi (2005) used nonnegative matrix factorization (or NMF, see Lee and Seung, 2001) and matching pursuit (Mallat and Zhang, 1993) techniques to extract synchronous and time-varying muscle synergy patterns from electromyography (EMG) data recorded from the hind-limbs of freely moving frogs. Tresch et al. (2006) further compared the performance of various matrix factorization algorithms on such synergy extraction tasks for both real and synthetic datasets. Kim et al. (2010) formulated the problem of extracting spatio-temporal primitives from a database of human movements as a tensor factorization problem with tensor group norm constraints on the primitives themselves and smoothness constraints on the activations. Zhou et al. (2008) also proposed an algorithm to temporally segment human motion-capture data into motion primitives using a generalization of spectral clustering and kernel K-means clustering methods for time-series clustering and embedding. For speech modeling, Atal (1983) presented an algorithm to perform temporal decomposition of log area parameters obtained from linear prediction analysis of speech. This technique represents the continuous variation of these parameters as a linearly weighted sum of a number of discrete elementary components. More recently, Smaragdis (2007) presented a convolutive NMF algorithm to extract “phone”-like vectors from speech spectrograms which could be used to characterize different speakers (or audio sources) for speech (or music) separation problems. O'Grady and Pearlmutter (2008) included the notion of sparsity in this formulation and showed that this gave more intuitive results. Note that we can view all these formulations as optimization problems with a cost function that involves (1) a data-fit term (which penalizes how accurately4 appropriately weighted and time-shifted primitives can represent input data) and (2) a regularization term (which enforces sparsity and/or smoothness constraints).
Mathematically, we say that a signal x in admits a sparse approximation over a basis set of vectors or “dictionary” D in with k columns referred to as “atoms” when one can find a linear combination of a small number of atoms from D that is as “close” to x as possible (as defined by a suitable error metric) (Mairal et al., 2010). Note that sparsity constraints can be imposed over either the basis/dictionary or the coefficients of the linear combination (also called “activations”) or both. In this paper, since one of our main goals is to extract interpretable5 basis or dictionary elements (or primitives) from observed articulatory data, we focus on matrix factorization techniques such as Nonnegative Matrix Factorization (NMF) and its variants (Lee and Seung, 2001; Hoyer, 2004; Smaragdis, 2007; O'Grady and Pearlmutter, 2008). We use NMF-based techniques since these have been shown to yield basis vectors that can be assigned meaningful interpretation6 depending on the problem domain (Mel, 1999; Smaragdis, 2007; O'Grady and Pearlmutter, 2008). In addition, we would like to find a factorization such that only a few basis vectors (or primitives) are “active” at any given point of time (as observed in Fig. 2), i.e., a sparse activation matrix. In other words, we would like to represent data at each sampling point in time using a minimum number of basis vectors. Hence we formulate our problem such that sparsity constraints are imposed on the activation matrix.
VALIDATION STRATEGY
Direct validation of experimentally derived articulatory primitives, especially in the absence of absolute ground truth, is a difficult problem. That being said, we can assess the extent to which these primitives provide a valid compositional model of the observed data. There are two important conceptual questions that arise during such a validation of experimentally derived articulatory primitives. First, does speech have a compositional structure that is reflected in its articulation? Second, if we are presented with a set of waveforms or movement trajectories that have been generated by a compositional structure, then can we design and validate algorithms that can recover this compositional structure? The first question is one that we are not in a position to address fully yet, at least with the datasets at our current disposal.7 However, we can answer the second question, and we address it in this paper.
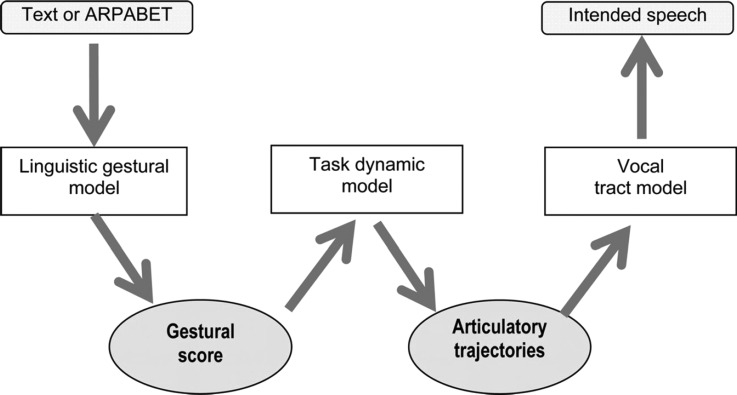
The synthetic TaDA model is generated by a known composition task model. Figure 3 illustrates the flow of information through the TaDA model. Articulatory control and functional coordination is accomplished with reference to speech “tasks” which are composed and sequenced together in space and time. The temporal activations of each constricting primitive or “gesture” required to perform a speech task can be obtained from the model (i.e., we can recover a representation similar to that shown in Fig. 2). Hence the TaDA model provides a testbed to investigate how well a primitive-extraction algorithm can recover the compositional structure that underlies (pseudo) behavioral movement data. Note that we do not claim here that the TaDA model mimics the human speech production mechanism or is some kind of ground truth. Nevertheless, it has been shown that it is possible to use the model to learn a mapping from acoustics (MFCCs) to gestural activations (Mitra et al., 2011, 2012). When this mapping is applied to natural speech, the resulting gestural activations can be added as inputs to speech recognition systems with a sharp decrease in error rate. Furthermore, the TaDA model is a compositional model of speech production, which we can use to test how well algorithms can recover evidence of compositional structure from (pseudo) articulatory data. Following this, we can pose another question: To what extent does the algorithm extract a compositional structure in measured articulatory data that is similar to that extracted in the synthetic TaDA case?
Figure 3.
(Color online) Flow diagram of TaDA, as depicted in Nam et al. (2012).
DATA
We analyze ElectroMagnetic Articulography (EMA) data from the Multichannel Articulatory (MOCHA) database (Wrench, 2000), which consists of data from two speakers—one male and one female. Acoustic and articulatory data were collected while each (British English) speaker read a set of 460 phonetically diverse TIMIT sentences. The articulatory channels include EMA sensors directly attached to the upper and lower lips, lower incisor (jaw), tongue tip (5–10 mm from the tip), tongue blade (approximately 2–3 cm posterior to the tongue tip sensor), tongue dorsum (approximately 2–3 cm posterior to the tongue blade sensor), and soft palate. Each articulatory channel was sampled at 500 Hz with 16-bit precision. The data in its native form is unsuitable for processing, since the position data have high frequency noise resulting from measurement error. However, the articulatory movements are predominantly low pass in nature—99% of the energy is contained below ∼21 Hz for all the articulators—therefore, each channel was zero-phase low-pass filtered with a cut-off frequency of 35 Hz (Ghosh and Narayanan, 2010). Next, for every utterance, we subtracted the mean value from each articulatory channel (Richmond, 2002; Ghosh and Narayanan, 2010). Then we added the mean value of each channel averaged over all utterances to that corresponding channel. Finally, we downsampled each channel by a factor of five to 100 Hz and further normalized data in each channel (by its range) such that all data values lie between 0 and 1. These pre-processed articulator trajectories were used for further analysis and experiments (see Table TABLE I.).
TABLE I.
Articulator flesh point variables that comprise the post-processed synthetic (TaDA) and real (EMA) datasets that we use for our experiments. Note that the EMA dataset does not have a Tongue Root sensor, but has an extra maxillary (upper incisor) sensor in addition to the mandibular (jaw) sensor. Also, TaDA does not output explicit spatial coordinates of the velum. Instead it has a single velic opening parameter that controls the degree to which the velopharyngeal port is open. Since this parameter is not a spatial (x, y) coordinate like the other variables considered, we chose to omit this parameter from the analysis described in this paper.
| Symbol | Articulatory parameter | TaDA | MOCHA-TIMIT |
|---|---|---|---|
| UL(x,y) | Upper lip | ✓ | ✓ |
| LL(x,y) | Lower lip | ✓ | ✓ |
| JAW(x,y) | Jaw | ✓ | ✓ |
| TT(x,y) | Tongue tip | ✓ | ✓ |
| TF(x,y) / TB(x,y) | Tongue front/body | ✓ | ✓ |
| TD(x,y) | Tongue dorsum | ✓ | ✓ |
| TR(x,y) | Tongue root | ✓ | |
| VEL(x,y) | Velum | ✓ | |
| UI(x,y) | Upper Incisor | ✓ |
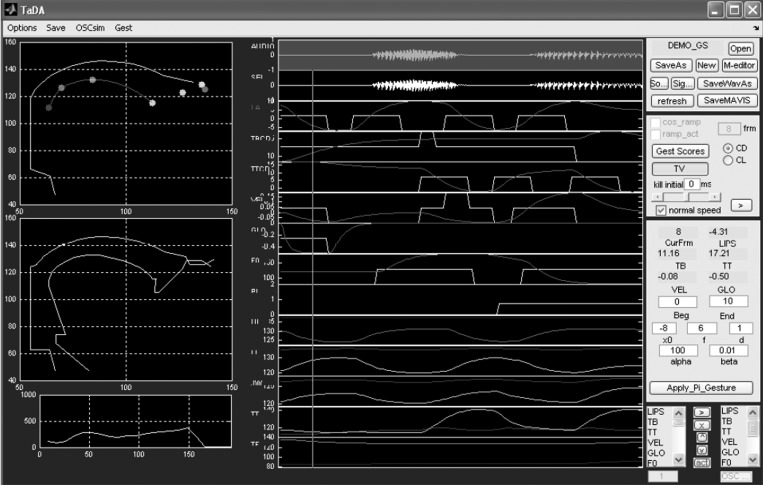
We also analyze synthetic data generated by the Task Dynamics Application (or TaDA) software (Nam et al., 2006; Saltzman et al., 2008; Nam et al., 2012), which implements the Task Dynamic model of inter-articulator speech coordination with the framework of Articulatory Phonology (Browman and Goldstein, 1995) described earlier in this paper. It also incorporates a coupled-oscillator model of inter-gestural planning, a gestural-coupling model, and a configurable articulatory speech synthesizer (Rubin et al., 1996; Iskarous et al., 2003). TaDA generates articulatory and acoustic outputs from orthographical input. Figure 4 shows a screenshot of the TaDA graphical user interface. The orthographic input is converted to a phonetic string using a version of the Carnegie Mellon pronouncing dictionary that also provides syllabification. The syllabified string is then parsed into gestural regimes and inter-gestural coupling relations using hand-tuned dictionaries and then converted into a gestural score. The obtained gestural score is an ensemble of gestures for the utterance, specifying the intervals of time during which particular constriction gestures are active. This is finally used by the Task Dynamic model implementation in TaDA to generate the tract variable and articulator time functions, which are further mapped to the vocal tract area function (sampled at 200 Hz). See Fig. 3. The articulatory trajectories are downsampled to 100 Hz in a manner similar to the case of the MOCHA data described earlier. We further normalize data in each channel (by its range) such that all data values lie between 0 and 1. Gestural scores, articulatory trajectories, and corresponding acoustics were each synthesized (and normalized, in a manner similar to the EMA data) for 460 sentences corresponding to those used in the MOCHA-TIMIT (Wrench, 2000) database. The list of pre-processed articulator trajectory variables we use for analysis is listed in Table TABLE I..
Figure 4.
(Color online) A screenshot of the Task Dynamics Application (or TaDA) software GUI (after Nam et al., 2006). Displayed to the left is the instantaneous vocal tract shape and area function at the time marked by the cursor in the temporal display. Note especially the pellets corresponding to different pseudo vocal-tract flesh-points in the top left display, movements of which (displayed in color in the bottom center panels) are used for our experiments. The center panels just above these consist of two overlaid waveforms. There is one panel for each constriction task/goal variable of interest. The square waveforms depict activations of theoretical gestures associated with that task (input to the model), while the continuous waveforms depict the actual waveforms of those task variables obtained as output from the TaDA model.
PROBLEM FORMULATION
The primary aim of this research is to extract dynamic articulatory primitives, weighted combinations of which can be used to resynthesize the various dynamic articulatory movements in the vocal tract. Techniques from machine learning such as non-negative matrix factorization (NMF) which factor a given non-negative matrix into a linear combination of (non-negative) basis vectors offer an excellent starting point to solve our problem.
Nonnegative Matrix Factorization and its extensions
The aim of NMF (as presented in Lee and Seung, 2001) is to approximate a non-negative input data matrix as the product of two non-negative matrices, a basis matrix and an activation matrix (where K ≤ M) by minimizing the reconstruction error as measured by either a Euclidean distance metric or a Kullback–Liebler (KL) divergence metric. Although NMF provides a useful tool for analyzing data, it suffers from two drawbacks of particular relevance in our case. First, it fails to account for potential dependencies across successive columns of V (in other words, to capture the (temporal) dynamics of the data); thus a regularly repeating dynamic pattern would be represented by NMF using multiple bases, instead of a single basis function that spans the pattern length. Second, it does not explicitly impose sparsity constraints on the factored matrices, which is important for our application since we want only few bases “active” at any given sampling instant. These drawbacks motivated the development of convolutive NMF (Smaragdis, 2007), where we instead model V as
| (1) |
where W is a basis tensor,8 i.e., each column of is a time-varying basis vector sampled at time t, each row of is its corresponding activation vector, T is the temporal length of each basis (number of image frames) and the operator is a shift operator that moves the columns of its argument by i spots to the right, as detailed in Smaragdis (2007):
In this case the author uses a KL divergence-based error criterion and derives iterative update rules for W(t) and H based on this criterion. This formulation was extended by O'Grady and Pearlmutter (2008) to impose sparsity conditions on the activation matrix (i.e., requiring that a certain number of entries in the activation matrix are zeros). However, the parameter which trades-off sparsity of the activation matrix against the error criterion (in their case, λ) is not readily interpretable, i.e., it is not immediately clear what value λ should be set to yield optimal interpretable bases. We instead choose to use a sparseness metric based on a relationship between the l1 and l2 norms (as proposed by Hoyer, 2004) as follows:
| (2) |
where n is the dimensionality of x. This function equals unity if x contains only one non-zero component and 0 if all components are equal up to signs and smoothly interpolates between the extremes. More recently Wang et al. (2009) showed that using a Euclidean distance-based error metric was more advantageous (in terms of computational load and accuracy on an audio object separation task) than the KL divergence-based metric and further derived the corresponding multiplicative update rules for the former case. It is this formulation along with the sparseness constraints on H [as defined by Eq. 2] that we use to solve our problem. Note that incorporation of the sparseness constraint also means that we can no longer directly use multiplicative update rules for H—so we use gradient descent followed by a projection step to update H iteratively (as proposed by Hoyer, 2004). The added advantage of using this technique is that it has been shown to find a unique solution of the NMF problem with sparseness constraints (Theis et al., 2005). The final formulation of our optimization problem, which we term “convolutive NMF with sparseness constraints” or cNMFsc, is as follows:
| (3) |
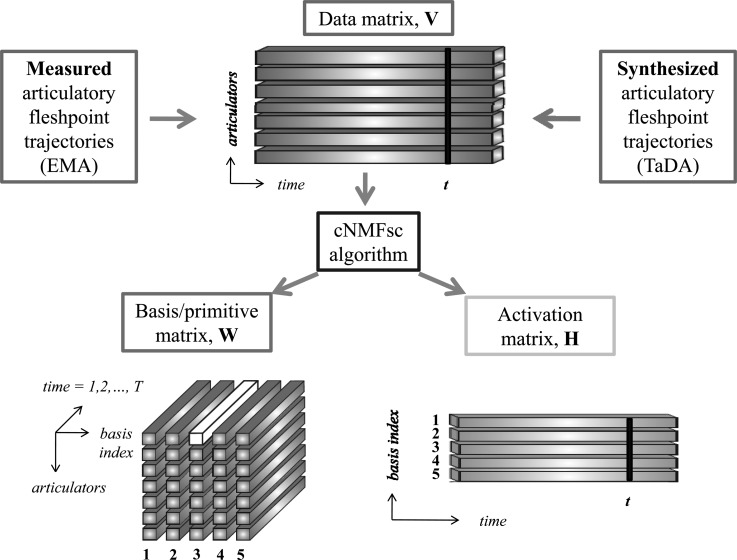
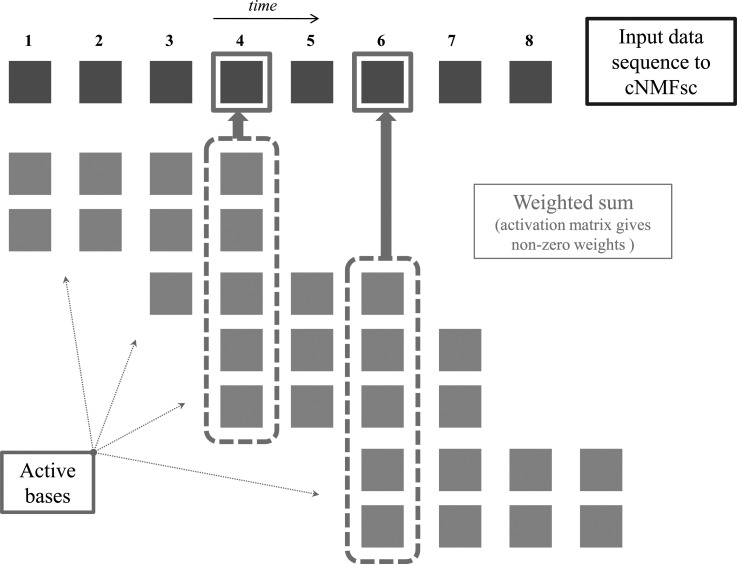
where hi is the ith row of H and 0 ≤ Sh ≤ 1 is user-defined (for example, setting Sh = 0.65 roughly corresponds to requiring 65% of the entries in each row of H to be 0). Figure 5 provides a graphic illustration of the input and outputs of the model, while Fig. 6 pictorially depicts how weighted and shifted additive combinations of the basis reconstruct the original input data sequence.
Figure 5.
(Color online) Schematic illustrating the proposed cNMFsc algorithm. The input matrix V can be constructed either from real (EMA) or synthesized (TaDA) articulatory data. In this example, we assume that there are M = 7 articulator fleshpoint trajectories. We would like to find K = 5 basis functions or articulatory primitives, collectively depicted as the big red cuboid (representing a three-dimensional matrix W). Each vertical slab of the cuboid is one primitive (numbered 1 to 5). For instance, the white tube represents a single component of the third primitive that corresponds to the first articulator (T samples long). The activation of each of these five time-varying primitives/basis functions is given by the rows of the activation matrix H in the bottom right hand corner. For instance, the five values in the tth column of H are the weights which multiply each of the five primitives at the tth time sample.
Figure 6.
(Color online) Schematic illustrating how shifted and scaled primitives can additively reconstruct the original input data sequence. Each gold square in the topmost row represents one column vector of the input data matrix, V, corresponding to a single sampling instant in time. Recall that our basis functions/primitives are time-varying. Hence, at any given time instant t, we plot only the basis functions/primitives that have non-zero activation (i.e., the corresponding rows of the activation matrix at time t has non-zero entries). Notice that any given basis function extends T = 4 samples long in time, represented by a sequence of four silver/gray squares each. Thus, in order to reconstruct say the fourth column of V, we need to consider the contributions of all basis functions that are “active” starting anywhere between time instant 1 to 4, as shown.
Extraction of primitive representations from data
If x1, x2, …, xM are the M time-traces (consisting of N samples each; represented as column vectors of dimension N × 1) corresponding to the M articulator (fleshpoint) trajectory variables (could be obtained from either TaDA or MOCHA-TIMIT), then we can design our data matrix V to be
| (4) |
where † is the matrix transpose operator. We now aim to find an approximation of this matrix V using a basis tensor W and an activation matrix H. A practical issue which arises here is that in our dataset, there are 460 files corresponding to different sentences, each of which results in a M × N data matrix V (where N is equal to the number of frames in that particular sequence). However we would like to obtain a single basis tensor W for all files so that we obtain a primitive articulatory representation for any sequence of articulatory movements made by that speaker. One possible way to do this is to concatenate all 460 sequences into one huge matrix, but the dimensionality of this matrix makes computation intractably slow. In order to avert this problem we propose a second method that optimizes W jointly for all files and H individually per file. The algorithm is as follows:
-
(1)
InitializeW to a random tensor of appropriate dimension
-
(2)W Optimization for Q of N files in the database do
-
(a)InitializeH to a random matrix of requisite dimensions
-
(b)PROJECT. Project each row of H to be non-negative, have unit l2 norm and l1 norm set to achieve the desired sparseness (Hoyer, 2004).
-
(c)ITERATE
-
(i)H Update for t = 1 to T do
-
(ii)WUpdatefor t = 1 to T do
-
(i)
-
(a)
-
(3)for the rest of the files in the database do
Steps 2 and 3 are repeated for an empirically specified number of iterations. The stepsize parameter μH of the gradient descent procedure (described in Step 2) and the number of files Q used for the W optimization are also set manually based on empirical observations.
Selection of optimization free parameters
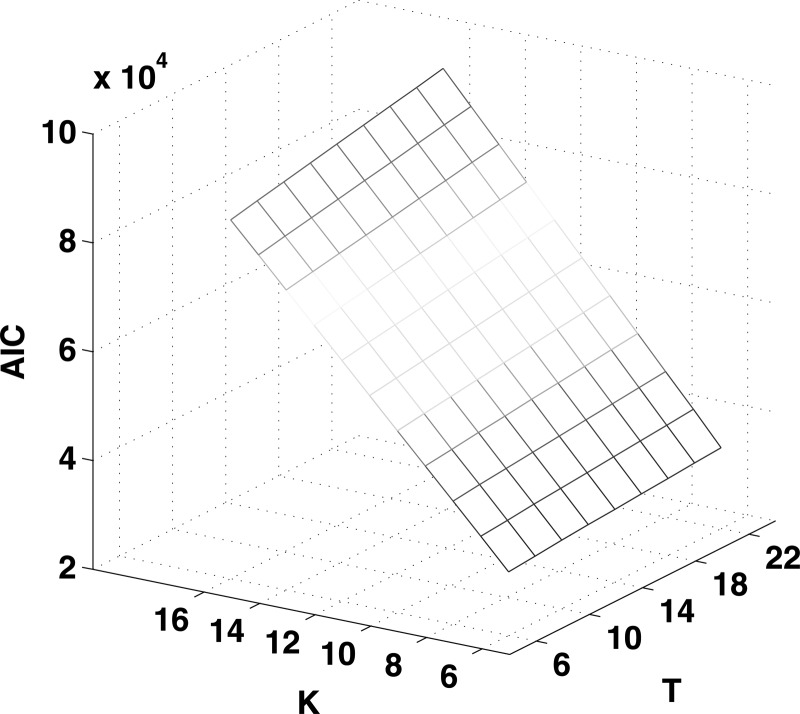
In this section we briefly describe how we performed model selection, i.e., choosing the values of the various free parameters of the algorithm. The Akaike Information Criterion (or AIC, Akaike, 1981) and Bayesian Information Criterion (or BIC, Schwarz, 1978) are two popular model selection criteria that trade off the likelihood of the model (which is proportional to the objective function value) against the model complexity (which is proportional to the number of parameters in the model). For a more detailed explanation, see the Appendix. Since performing AIC and BIC computations for the whole corpus is time- and resource-consuming, we computed these criteria for a subset of the data. Figure 7 shows the AIC computed for different values of K (number of bases/primitives) and T (the temporal extent of each basis) over a 5% subset of subject fsew0's data (the BIC and AIC trends are similar for both speakers, hence we only present the AIC computed for subject fsew0 in the interest of brevity). We see that the AIC tends to overwhelmingly prefer models that are less complex, since the model complexity term far outweighs the log likelihood term in the model as the values of K and T increase.
Figure 7.
(Color online) Akaike Information Criterion (AIC) values for different values of K (the number of bases) and T (the temporal extent of each basis) computed for speaker fsew0. We observe that an optimal model selection prefers the parameter values to be as low as possible since the number of parameters in the model far exceeds the contribution of the log likelihood term in computing the AIC.
In light of the AIC analysis, we would like to choose K and T as small as possible, but in a meaningful manner. Therefore, we decided to set the temporal extent of each basis sequence (T) to ten samples (since this corresponds to a time period of approximately 100 ms, factoring in a sampling rate of 100 samples per second) to capture effects on the order of the length of a phone on average. We chose the number of bases, K, to be equal to the number of time-varying constriction task variables generated (by TaDA) for each file, i.e., eight.
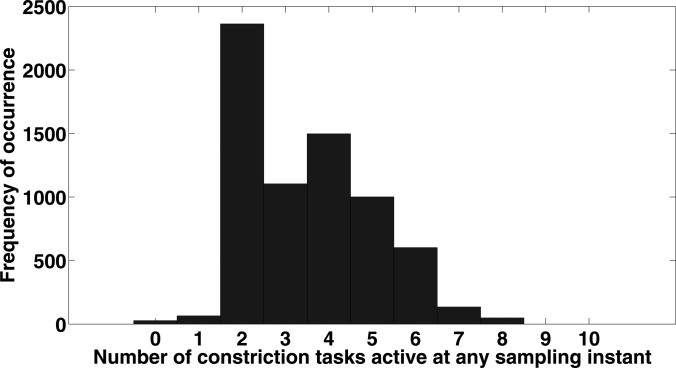
The value of the sparseness parameter Sh was set based on the percentage of constriction tasks (generated by TaDA) that were active at any given time instant. Figure 8 shows a histogram of the number of constriction tasks active at any sampling time instant (computed over all TaDA-generated constriction task variables). We observe that most of the time only 2 or 3 task variables have non-zero activations, suggesting that choosing Sh in the range of 0.65–0.75 would be optimal for our experiment.
Figure 8.
(Color online) Histogram of the number of non-zero constriction task variables at any sampling instant.
RESULTS AND VALIDATION
A significant hurdle to validating any proposed model of articulatory primitives is the lack of ground truth data or observations, since these entities are difficult to observe and/or measure directly given that they exist. However, we can evaluate quantitative metrics of algorithm performance such as the fraction of variance explained by the model and root mean squared error (RMSE) performance of the algorithm for different articulator trajectories and phonemes. In addition, we can evaluate how well the model performs for measured articulatory data vis-à-vis synthetic data generated by an articulatory synthesizer (TaDA). Therefore, in the following section we first present quantitative evaluations of our proposed model, and then follow it up with qualitative comparisons with the Articulatory Phonology-based TaDA model.
Quantitative performance metrics
We first present a quantitative analysis of the convolutive NMF with sparseness constraints (cNMFsc) algorithm described earlier. In order to see how the algorithm performs for different phone classes, we need to first perform a phonetic alignment of the audio data corresponding to each set of articulator trajectories. We did this using the Hidden Markov Model toolkit (HTK, Young et al., 2006).
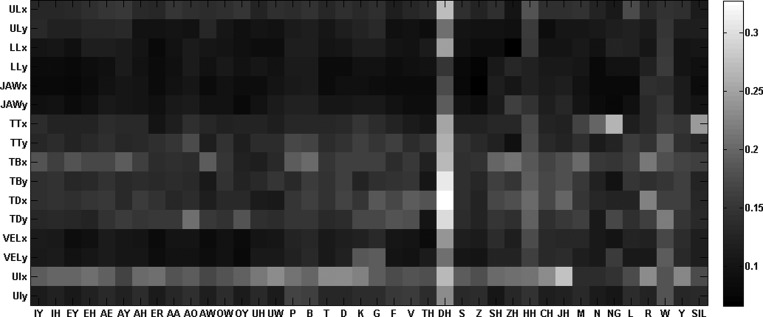
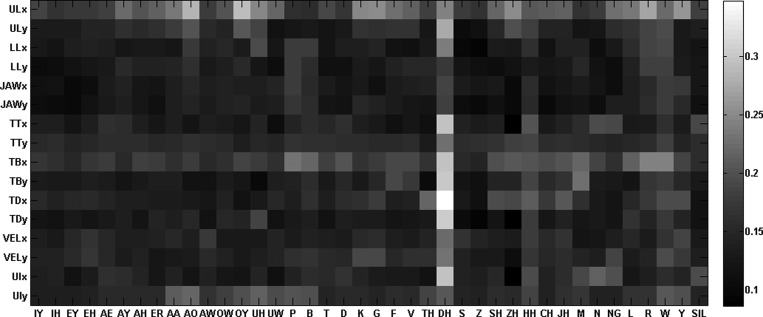
Figures 910 show the RMSE for each articulator and phone class (categorized by ARPABET symbol) for MOCHA-TIMIT speakers msak0 and fsew0, respectively. Recall that since we are normalizing each row of the original data matrix to the range [0,1] (and hence each articulator trajectory), the error values in Figs. 910 can be read on a similar scale. We see that in general, error values are very high. Among the articulator trajectories, the errors were highest (0.15–0.2) for tongue-related articulator trajectories. On the other hand, trajectories of the lip (LLx and LLy) and jaw (JAWx and JAWy) sensors were reconstructed with lower error (≤0.1). As far as the phones were concerned, errors were comparatively higher for the voiced alveolo-dental stop DH. One reason for this can be attributed to the way we form the data matrix V. Recall that we construct V by concatenating articulatory data corresponding to several (say, Q = 20) sentences into a single matrix. In other words, there will be Q - 1 discontinuities in the articulatory trajectories contained in V, one corresponding to each sentence boundary. Moreover, we found that roughly a third of all instances of DH occurred in the beginning of the sentences (as the first phone). The RMSE errors for these sentence-initial instances of DH were significantly higher than the RMSE errors of DH instances that occurred in other positions in the sentence. This suggests that the higher reconstruction error observed in DH instances that occur sentence-initially is likely not an artifact of the cNMFsc algorithm itself, but rather due to the presence of discontinuities in the original data matrix.
Figure 9.
(Color online) RMSE for each articulator and phone class (categorized by ARPABET symbol) obtained as a result of running the algorithm on all 460 sentences spoken by male speaker msak0.
Figure 10.
(Color online) RMSE for each articulator and phone class (categorized by ARPABET symbol) obtained as a result of running the algorithm on all 460 sentences spoken by female speaker fsew0.
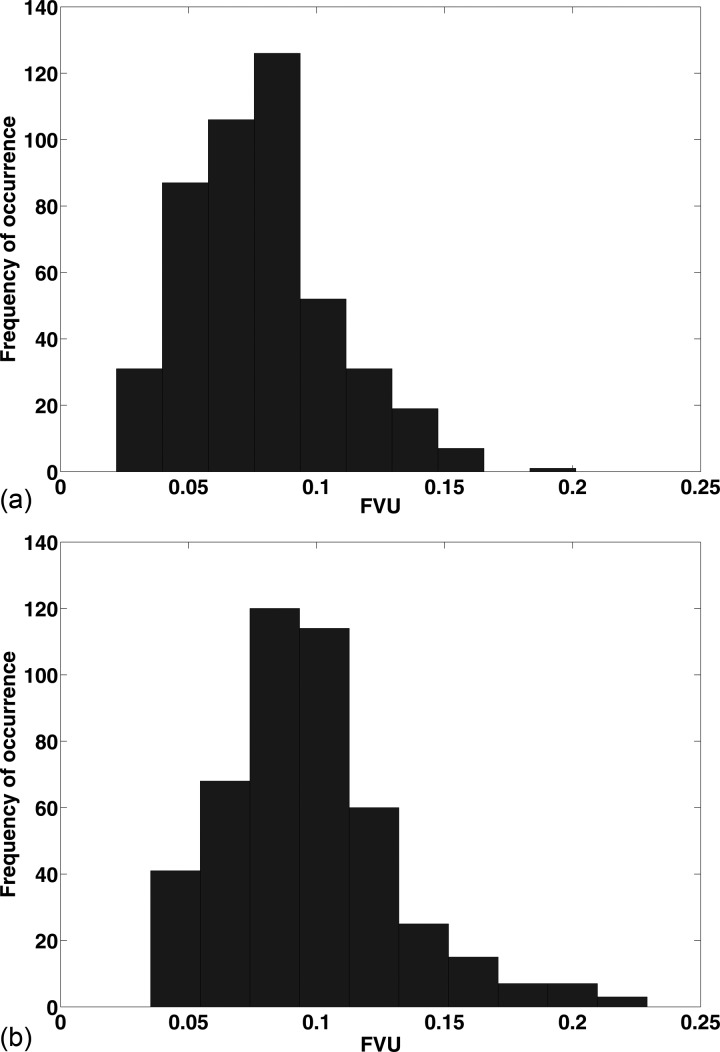
We further computed for each speaker the fraction of variance that was not explained (FVU) by the model for each sentence in the database. The histograms of these distribution are plotted in Fig. 11. The mean and standard deviation of this distribution was 0.079 ± 0.028 for speaker msak0 (i.e., approx. 7.9% of the original data variance was not accounted for on average) and 0.097 ± 0.034 for speaker fsew0, respectively. These statistics suggest that the cNMFsc model accounts for more than 90% of the original data variance.
Figure 11.
(Color online) Histograms of the fraction of variance unexplained (FVU) by the proposed cNMFsc model for MOCHA-TIMIT speakers (a) msak0 and (b) fsew0. The samples of the distribution were obtained for each speaker by computing the FVU for each of the 460 sentences. (The algorithm parameters used in the model were Sh = 0.65, K = 8, and T = 10).
Qualitative comparisons of TaDA model predictions with the proposed algorithm
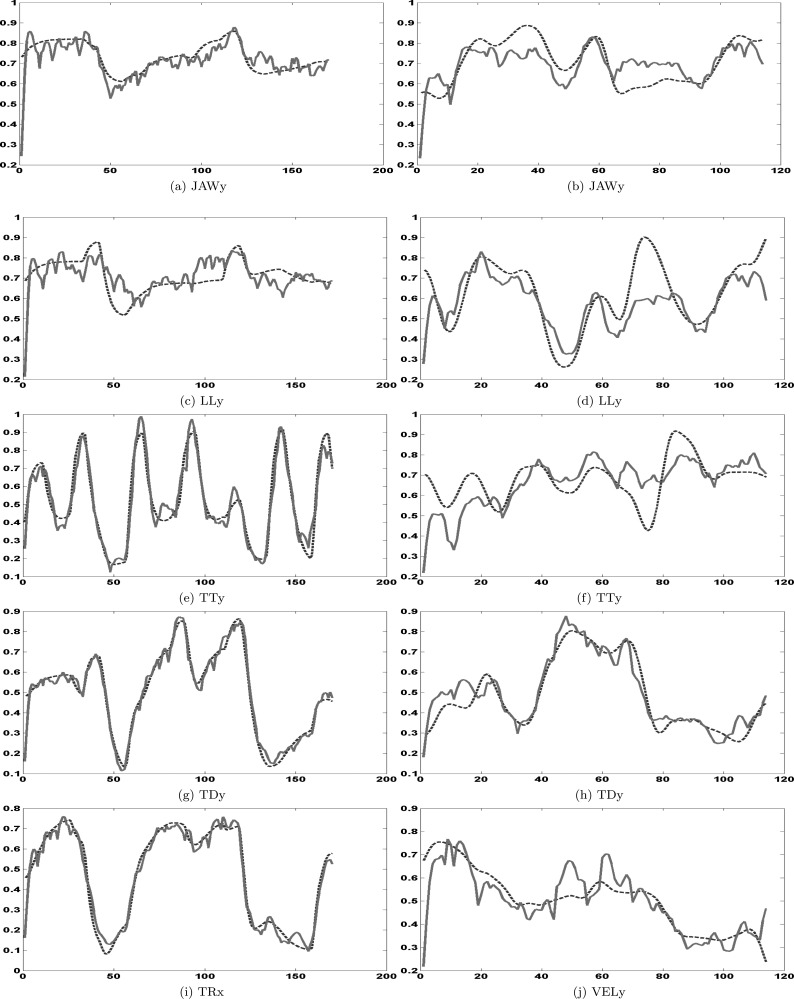
Figure 12 shows selected measured articulator trajectories superimposed on those obtained by reconstruction based on the estimated cNMFsc model for the TaDA and EMA data, respectively. Notice that while the reconstructed curves approximate the shape of the original curves, they are not as smooth. This is likely due to the imposition of sparseness constraints in our problem formulation in Eq. 3, where the optimization procedure trades off reconstruction accuracy for sparseness of rows in the activation matrix. This could explain the higher phone error rates that we observed in Figs. 910 as well. Note that although we are plotting only a subset of the articulatory trajectories, we generally observe that synthetic (TaDA) data is reconstructed with a smaller error as compared to the measured (EMA) data, which makes sense, considering that a greater amount of within-speaker variability is observed in actual speech articulation. This extra variability may not be captured very well by the model. Also notice that panels on the right (corresponding to EMA measurements) have a smaller total utterance duration (∼1.2 s) as compared to the TaDA panels on the left (∼1.7 s), which further reinforces the earlier argument that synthetic speech does not account for phenomena such as phoneme reduction, deletion, etc., which contribute to signal variability.
Figure 12.
(Color online) Original (dashed) and cNMFsc-estimated (solid) articulator trajectories of selected (left) TaDA articulator variables and (right) EMA (MOCHA-TIMIT) articulator variables (obtained from speaker msak0) for the sentence “this was easy for us.” The vertical axis in each subplot depicts the value of the articulator variable scaled by its range (to the interval [0,1]), while the horizontal axis shows the sample index in time (sampling rate = 100 Hz). The algorithm parameters used were Sh = 0.65, K = 8, and T = 10. See Table TABLE I. for an explanation of articulator symbols.
Comparison with gestural scores
Now that we have generated spatio-temporal basis functions or synergies of articulator trajectories, linear combinations of which can be used to represent the input, the next step is to compare the activations/weights of these spatiotemporal bases generated for each sentence to the gestural activations hypothesized by TaDA for that sentence. However, comparison of time-series data is not trivial in general, and in our case in particular, since the basis functions extracted by the algorithm need not represent the gestures themselves in form, but might do so in information content.2 In other words, the two sets of time-series represented by the gestural score matrix G and the estimated activation matrix Hcannot be directly compared to each other. Notice that this is a particularly difficult problem in signal processing and time-series analysis in general, especially because of its abstract nature. To our knowledge, there is no easy or direct method of solving this problem to date.
That being said, we present here a sub-optimal, indirect approach to attacking this complex problem using well-established signal modeling techniques. Specifically, we propose a two-step procedure in order to perform this comparison. First, we model each set of time-series (hypothesized gestural activations and extracted activation traces) by an auto-regressive (AR) model using linear prediction (for example, see Makhoul, 1975). Once this is done, we find the canonical correlation between the set of AR coefficient matrices to examine the similarity between the two sets of time-series. Canonical correlation linearly projects both sets of signals (contained in the matrices) into a common signal space where they are maximally correlated to each other. Hence, by examining the magnitude of (canonical) correlation values, we can get an estimate of how maximally correlated the two sets of multidimensional timeseries are to each other.9 In the following paragraphs, we describe the procedure in more detail.
The technique of linear prediction (Makhoul, 1975) models a given discrete time-varying signal as a linear combination of its past values (this is also known as auto-regressive or AR system modeling). Mathematically, if the given signal (for example, an articulator trajectory in our case) is x, then
| (5) |
where P is the order of the model and ai, ∀i are the linear prediction or AR model coefficients.
Recall from Eq. 4 that each row of our K × N activation matrix H represents activation of a different time-varying basis. Using linear prediction, we can model each row of this matrix by a LP model, thus giving us a K × P matrix HLP. If G is the Kg × Ng matrix of gestural activations (where again, rows represent gestural activations associated with different constriction task variables and columns represent time), these can also be modeled as a Kg × P matrix GLP in a similar fashion.
If we have two sets of variables, x1, …, xn and y1, …, ym, and there are correlations among the variables, then canonical correlation analysis will enable us to find linear combinations of the x's and the y's which have maximum correlation with each other. We thus examine the canonical correlation values between the rows of matrices GLP and HLP, respectively. This allows to observe how much linear correlation there is between the 2 spaces and thus obtain an estimate of the “information content” of the two spaces are, and, in addition, allow us to estimate a linear mapping between the two variable spaces, which will allow us to convert the estimated activation matrices into gestural activations. Table TABLE II. shows the top five canonical correlation values obtained in the cases of both TaDA and EMA data. In general we observe high values of canonical correlations which supports the hypothesis that the estimated activation matrices capture the important information structure contained in the gestural activations.
TABLE II.
Top five canonical correlation values between the gestural activation matrix G (generated by TaDA) and the estimated activation matrix H for both TaDA and EMA cases.
| nth highest canonical correlation value | TaDA | MOCHA-TIMIT |
|---|---|---|
| n = 1 | 0.9089 | 0.9407 |
| n = 2 | 0.7717 | 0.8548 |
| n = 3 | 0.7158 | 0.7817 |
| n = 4 | 0.6350 | 0.6017 |
| n = 5 | 0.4947 | 0.4409 |
However, as we have mentioned earlier, this technique of comparison is at best sub-optimal, for many reasons. First, recall that the activation matrices are sparse. Modeling sparse time-series in general, and specifically using AR modeling is prone to errors since the time-series being modeled are not generally smooth. Second, the optimal choice of model parameters, such as the number of coefficients in the LPC/AR analysis [P in Eq. 5] is not clear. In our case, we chose a value that captured temporal effects on the order of approximately 200–250 ms.
Significance of extracted synergies
To check that our algorithm indeed captures some structure in the data, we compared the reconstruction error of extracted activation matrix (synergies) H to those obtained by substituting it for a random matrix of the same sparsity structure in Eq. 1. This procedure was repeated 50 times. A right-sided Student's t-test found that the mean square error objective function value for the random matrices was significantly higher than for the case of the estimated H matrix (p = 0).
Visualization of extracted basis functions
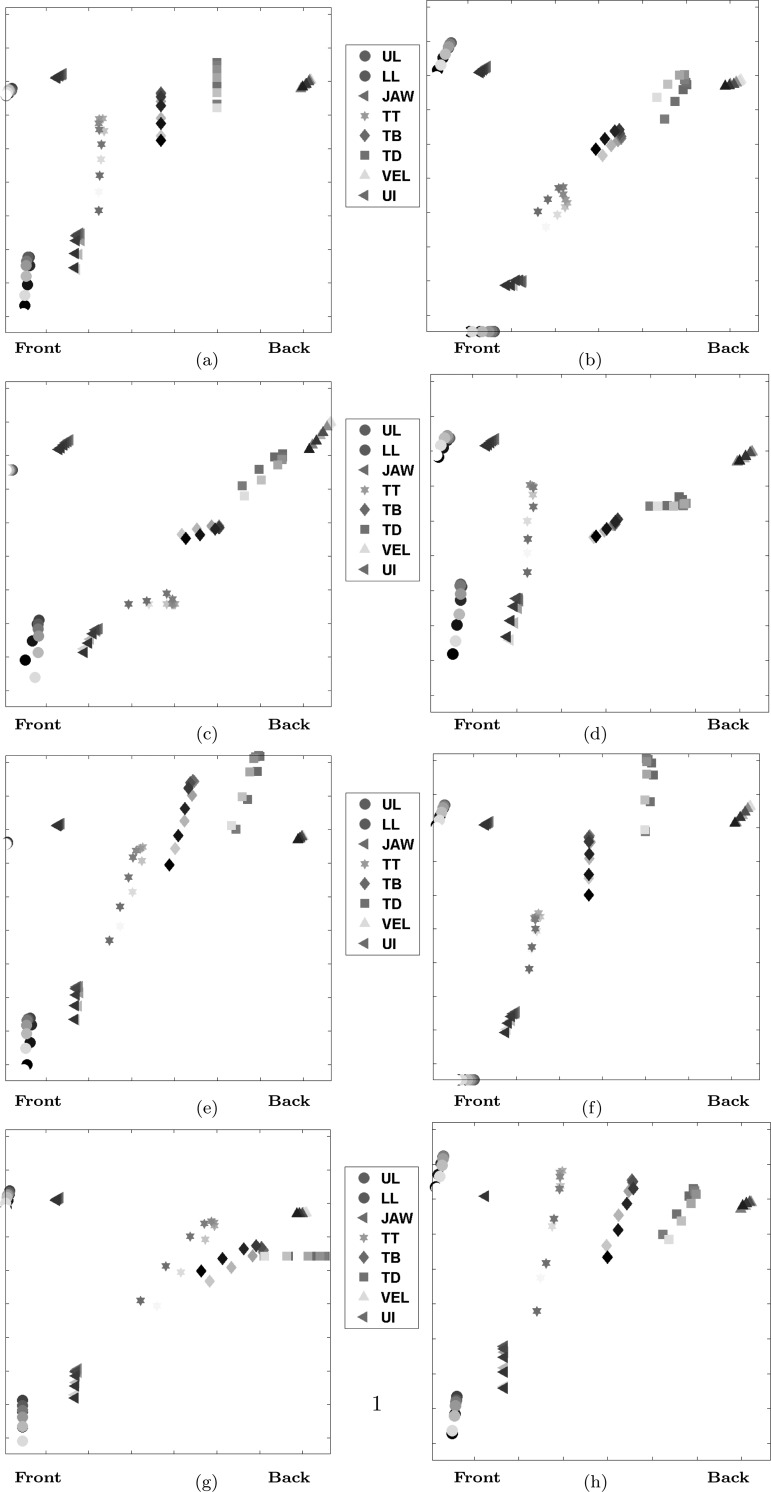
Figure 13 show exemplar basis functions extracted from MOCHA-TIMIT data from speaker msak0. We observe that the bases are interpretable and capture important and diverse articulatory movements from a phonetics perspective. The bases are interpretable and 7 of the 8 correspond to articulatory patterns associated with the formation of constrictions of the vocal organs. Basis 1 exhibits the articulatory pattern expected when a labial constriction (note vertical movement of lower lip) is formed in the context of a (co-produced) front vowel (note vertical movements of front tongue markers), while basis 3 exhibits the pattern expected for a labial constriction co-produced with a back vowel (note the backward and raising motions of the tongue markers). Comparably, bases 4 and 8 show patterns expected of a coronal (tongue tip) constriction co-produced with back and front vowels, respectively. Basis 5 shows the expected pattern for a tongue dorsum constriction with a velar or uvular location, while 6 shows the pattern of a dorsum constriction with a palatal location. Basis 7 shows the expected pattern for tongue root constriction in the pharynx. Basis 2 is the only one that does not appear to represent a constriction, per se, but rather appears to capture horizontal movement of all the receivers.
Figure 13.
(Color online) Spatio-temporal basis functions or primitives extracted from MOCHA-TIMIT data from speaker msak0. The algorithm parameters used were Sh = 0.65, K = 8 and T = 10. The front of the mouth is located toward the left hand side of each image (and the back of the mouth on the right). Each articulator trajectory is represented as a curve traced out by ten colored markers (one for each time step) starting from a lighter color and ending in a darker color. The marker used for each trajectory is shown in the legend.
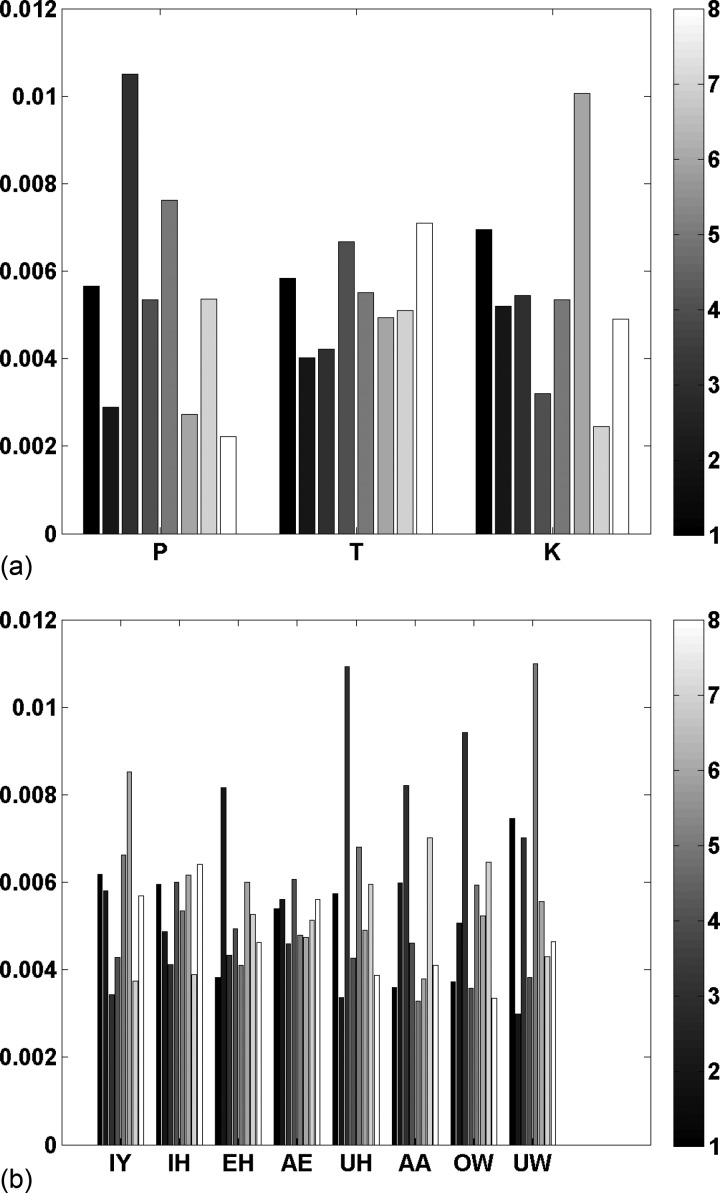
Since different phonetic segments are formed with distinct constrictions, we would expect that they should activate distinct bases. To test this, we plot the average activation patterns of selected segments in Fig. 14. We did this by collecting all columns of the activation matrix corresponding to each phone interval [as well as (T – 1) = 9 columns before and after, since the primitives are spatiotemporal in nature with temporal length T = 10] and taking the average across each of the K = 8 rows. Let us first consider the activation patterns of the three voiceless stops in Fig. 14a. Each of the consonants have a different average gestural activation pattern. For /p/, the basis with the highest activation is the one identified above as a labial constriction co-produced with a back vowel [3 or (c)], the labial-front vowel pattern [1 or (a)] is also highly active (third highest). For /t/, the two patterns identified as coronal constriction patterns [4 (d) and 8 (h)] have the highest activation, while for /k/, the dorso-palatal pattern is most active [6 or (f)]. We might have expected more activation of the dorso-velar constrictions pattern, but in English the dorsal stops are quite front, particularly in front vowel contexts. Similarly, in Fig. 14b, we qualitatively observe that the average activation patterns of different vowels are different. For the vowels that are produced with narrow constrictions (IY, AA, OW, and UW), the highest activated bases are those that produce the appropriate constriction. The bases most highly activated for IY are the dorsal constriction bases (5 and 6). For AA and OW, it is the pharyngeal constriction basis (7) and the labial constriction in back vowel context (3) (here capturing lip-rounding) that are most active. For UW, the dorso-velar (5) and labial constriction (1 and 3) bases are most active. For the less constricted vowels (IY, EH, AE, UH), there is, perhaps unsurprisingly, a lack of clearly dominant bases, except for the back-vowel rounding basis (3) for (UH), and perhaps the horizontal movement basis for EH. This suggests that although the cNMFsc algorithm does extract some discriminatory phonetic structure from articulatory data, there is still plenty of room for improvement.
Figure 14.
(Color online) Average activation pattern of the K = 8 basis functions or primitives for (a) voiceless stop consonants, and (b) British English vowels obtained from speaker msak0's data. For each phone category, 8 colorbars are plotted, one corresponding to the average activation of each of the 8 primitives. This was obtained by collecting all columns of the activation matrix corresponding to each phone interval (as well as T – 1 columns before and after) and taking the average across each of the K = 8 rows.
We notice that in general there are some similarities in movement between different bases but also differences, i.e., each basis captures some distinct aspect of speech articulation, mostly the formation of distinct constrictions. The bases extracted by the algorithm depend on the choice of parameters, and will change accordingly. Thus we do not claim to have solved the problem of finding the “correct” set of articulatory primitives (under the assumption that they do exist). However we have proposed an algorithm that can extract interpretable spatiotemporal primitives from measured articulatory data that are similar in information content to those derived from a well-understood model of the speech production system. The extracted bases are similar to the bases of Articulatory Phonology, which also represent constrictions of the vocal organs. One difference is that there are distinct bases extracted for distinct constriction locations of the tongue body (palatal, velar/uvular, and pharyngeal), while in the standard version of Articulatory Phonology (e.g., Browman and Goldstein, 1992), these are distinguished by parameter values of a single basis (Tongue Body Constriction Location). However, this parametric view has been independently called into question by recent data (e.g., Iskarous, 2005; Iskarous et al., 2011) that argues that distinct constriction locations are qualitatively distinct actions. A second difference is that the distinct bases appear to be extracted for labial and coronal constrictions in different vowel contexts (front vs back), while in AP, these contextual differences result from the temporal overlap of activation of consonant and vowel bases. Why the consonant and vowel constrictions are conflated in the extracted bases is not clear. Perhaps with fewer bases, this would not be the case. A thorough validation of these primitives is a subject for future research.
DISCUSSION AND FUTURE WORK
In order to fully understand any cognitive control system which is not directly observable, it is important to experimentally examine the applicability of any knowledge-driven theory or data-driven model of the system vis-à-vis some actual system measurements/observables. However, comparatively little work has been done with respect to data-driven models, especially in the case of the speech production system. In this paper, we have presented some initial efforts toward that end, by proposing a data-driven approach to extract sparse primitive representations from real and synthesized articulatory data. We further examined their relation to the gestural activations for the same data predicted by the knowledge-based Task Dynamics model. We view this as a first step toward our ultimate goal of bridging and validating knowledge-driven and data-driven approaches.
There remain several open research directions. From an algorithmic perspective, for example, we need to consider nonparametric approaches that do not require a priori choice of parameters such as the temporal dimension of each basis or the number of bases. We also need to design better techniques to validate and understand the properties of articulatory movement primitives. Such methods should obey the rules and constraints imposed by the phonetics and phonology of a language while being able to reconstruct the repertoire of articulatory movements with high fidelity.
There are many applications to these threads of research. Consider the case of coarticulation in speech, where the position of an articulator/element may be affected by the previous and following target (Ostry et al., 1996). Using the idea of motor primitives, we can explore how the choice, ordering and timing of a given movement element within a well-rehearsed sequence can be modified through interaction with its neighboring elements (co-articulation). For instance, through a handwriting-trajectory learning task, Sosnik et al. (2004) demonstrate that extensive training on a sequence of planar hand trajectories passing through several targets results in the co-articulation of movement components, and in the formation of new movement primitives.
Let us further consider the case of speech motor control. One popular theory of motor control is the inverse dynamics model, i.e., in order to generate and control complex behaviors, the brain needs to explicitly or implicitly solve systems of coupled equations. Mussa-Ivaldi et al. (1999) and Hart and Giszter (2010) instead argue for a less computationally complex viewpoint wherein the central nervous system uses a set of primitives (in the form of force fields acting upon controlled articulators to generate stable postures) to “solve” the inverse dynamics problem. Constructing internal neural representations from a linear combination of a reduced set of modifiable basis functions tremendously simplifies the task of learning new skills, generalizing to novel tasks or adapting to new environments (Flash and Hochner, 2005). Further, particular choices of basis functions might further reduce the number of functions required to represent learned information successfully. Thus, by understanding and deriving a meaningful set of articulatory primitives, we can develop better models of speech motor control, and possibly, at an even higher level, move toward an understanding of the language of speech actions (see for example work by Guerra-Filho and Aloimonos, 2007).
CONCLUSIONS
We have presented a convolutive Nonnegative Matrix Factorization algorithm with sparseness constraints (cNMFsc) to automatically extract interpretable articulatory movement primitives from human speech production data. We found that the extracted activation functions or synergies corresponding to different basis functions (from both synthetic as well as measured articulatory data) captured the important information structure contained in the gestural scores in general, and further estimated linear transformation matrices to convert the estimated activation functions to gestural scores. Since gestures may be viewed as a linguistically motivated theoretical set of primitives employed for speech production, the results presented in this paper suggest that (1) the cNMFsc algorithm successfully extracts movement primitives from human speech production data, and (2) the extracted primitives are linguistically interpretable in an Articulatory Phonology (Browman and Goldstein, 1995) framework.
ACKNOWLEDGMENTS
This work was supported by NIH Grant R01 DC007124-01. The authors thank Prasanta Ghosh for help with the EMA data processing.
APPENDIX: AIC COMPUTATION
The Akaike information criterion or AIC (Akaike, 1981) is a measure of the relative goodness of fit of a statistical model. It is used as a criterion for model selection among a finite set of models. The formula for AIC is
| (A1) |
where L is the maximized value of the likelihood function for the estimated model, and k is the total number of free parameters in the model. Under the assumption that the likelihood L of the data is Gaussian-distributed, one can show that the log-likelihood, ln(L), in Eq. A1 is proportional to the objective function of the convolutive NMF (or cNMF) formulation, presented earlier in Eqs. 1, 3
| (A2) |
For further details, see Kong et al. (2011); Févotte and Cemgil (2009). Hence, Eq. A1 reduces to
| (A3) |
The value of k equals the number of parameters of in the model, i.e., the number of entries in the M × K × T-dimensional basis matrix (W) and the K × N-dimensional activation matrix (H), respectively. Also noting the imposition of sparseness constraints on the activation matrix, we find the final expression for AIC as follows:
| (A4) |
where Sh is the sparseness parameter, which requires that each row of H needs to have a sparseness of Sh, as defined in Eq. 2.
Footnotes
Note that validation of experimentally derived articulatory primitives, especially in the absence of absolute ground truth, is a difficult problem.
Although the term “information content” is a loaded term with neurocognitive under-pinnings, we operationally use this term to abstractly refer to the structure encoded in the multivariate signal of interest.
In linear algebra, a basis is a set of linearly independent vectors that, in a linear combination, can represent every vector in a given vector space. Such a set of vectors can be collected together as columns of a matrix—a matrix so formed is called a basis matrix. More generally, this concept can be extended from vectors to functions, i.e., a basis in a given function space would consist of a set of linearly independent basis functions that can represent any function in that function space. For further details, see Strang (2003).
As measured by a suitable metric such as a norm distance.
By interpretable we mean a basis that a trained speech researcher can assign linguistic meaning to on visual inspection; for example, a basis of articulator flesh-point trajectories, or sequences of rt-MRI images of the vocal tract.
It is worth noting that Donoho and Stodden (2004) give specific mathematical conditions required for NMF algorithms to give a “correct” decomposition into parts, which affords us some mathematical insight into the decomposition. Presentation of the exact conditions here requires a level of mathematical sophistication that is beyond the scope of this paper and is hence omitted. Interested readers are directed to Donoho and Stodden (2004) for further details.
Note that some phonological models of speech do support the hypothesis that speech sounds have a compositional structure. For more details, see Jakobson et al. (1951) and Clements and Ridouane (2011).
Note that a multidimensional matrix is also called a tensor. In this case we have a three-dimensional basis tensor, with the third dimension representing time.
Note that instead of this two-step process, one can also consider using functional canonical correlation analysis (fCCA, Leurgans et al., 1993). However, since the time-series under consideration are sparse, this method may not provide useful results in practice. This is because the technique relies on appropriate smoothing of the time-series before finding their optimal linear projections. Another altogether different technique one can think of using is based in information theory, i.e., computing the mutual information (see Cover and Thomas, 2012) between the 2 sets of signals. However, the sparsity of the signals, coupled with the lack of proven methods of computing mutual information of arbitrary multidimensional time-series (not vectors), makes reliable estimation of this quantity difficult.
References
- Akaike, H. (1981). “ Likelihood of a model and information criteria,” J. Econometrics 16, 3–14. 10.1016/0304-4076(81)90071-3 [DOI] [Google Scholar]
- Atal, B. (1983). “ Efficient coding of LPC parameters by temporal decomposition,” in IEEE International Conference on Acoustics, Speech, and Signal Processing, ICASSP'83 (IEEE, New York), Vol. 8, pp. 81–84.
- Bernstein, N. (1967). The Co-ordination and Regulation of Movements (Pergamon Press, Oxford, UK: ), 196 pp. [Google Scholar]
- Bizzi, E., Cheung, V., d'Avella, A., Saltiel, P., and Tresch, M. (2008). “ Combining modules for movement,” Brain Res. Rev. 57, 125–133. 10.1016/j.brainresrev.2007.08.004 [DOI] [PMC free article] [PubMed] [Google Scholar]
- Browman, C., and Goldstein, L. (1995). “ Dynamics and articulatory phonology,” in Mind as Motion: Explorations in the Dynamics of Cognition, edited by Port R. F. and van Gelder T. (MIT Press, Cambridge, MA: ), pp. 175–194. [Google Scholar]
- Browman, C. P., and Goldstein, L. (1992). “ Articulatory phonology: An overview,” Phonetica 49, 155–180. 10.1159/000261913 [DOI] [PubMed] [Google Scholar]
- Clements, G. N., and Ridouane, R. (2011). Where do Phonological Features Come From?: Cognitive, Physical and Developmental Bases of Distinctive Speech Categories (John Benjamins Publishing, Philadelphia, PA: ), 347 pp. [Google Scholar]
- Cover, T. M., and Thomas, J. A. (2012). Elements of Information Theory (John Wiley and Sons, Hoboken, NJ: ), 776 pp. [Google Scholar]
- d'Avella, A., and Bizzi, E. (2005). “ Shared and specific muscle synergies in natural motor behaviors,” Proc. Natl. Acad. Sci. USA 102, 3076–3081. 10.1073/pnas.0500199102 [DOI] [PMC free article] [PubMed] [Google Scholar]
- d'Avella, A., Portone, A., Fernandez, L., and Lacquaniti, F. (2006). “ Control of fast-reaching movements by muscle synergy combinations,” J. Neurosci. 26, 7791–7810. 10.1523/JNEUROSCI.0830-06.2006 [DOI] [PMC free article] [PubMed] [Google Scholar]
- Donoho, D., and Stodden, V. (2004). “ When does non-negative matrix factorization give a correct decomposition into parts,” Adv. Neural Inf. Process. Syst. 16, 1–8. [Google Scholar]
- Févotte, C., and Cemgil, A. T. (2009). “ Nonnegative matrix factorizations as probabilistic inference in composite models,” Proc. EUSIPCO 47, 1913–1917. [Google Scholar]
- Flash, T., and Hochner, B. (2005). “ Motor primitives in vertebrates and invertebrates,” Curr. Opinion Neurobiol. 15, 660–666. 10.1016/j.conb.2005.10.011 [DOI] [PubMed] [Google Scholar]
- Ghosh, P., and Narayanan, S. (2010). “ A generalized smoothness criterion for acoustic-to-articulatory inversion,” J. Acoust. Soc. Am. 128, 2162–2172. 10.1121/1.3455847 [DOI] [PMC free article] [PubMed] [Google Scholar]
- Guerra-Filho, G., and Aloimonos, Y. (2007). “ A language for human action,” Computer 40, 42–51. 10.1109/MC.2007.154 [DOI] [Google Scholar]
- Haken, H., Kelso, J., and Bunz, H. (1985). “ A theoretical model of phase transitions in human hand movements,” Biol. Cybernetics 51, 347–356. 10.1007/BF00336922 [DOI] [PubMed] [Google Scholar]
- Hart, C., and Giszter, S. (2010). “ A neural basis for motor primitives in the spinal cord,” J. Neurosci. 30, 1322–1336. 10.1523/JNEUROSCI.5894-08.2010 [DOI] [PMC free article] [PubMed] [Google Scholar]
- Hoyer, P. (2004). “ Non-negative matrix factorization with sparseness constraints,” J. Mach. Learning Res. 5, 1457–1469. [Google Scholar]
- Hromádka, T., DeWeese, M., and Zador, A. (2008). “ Sparse representation of sounds in the unanesthetized auditory cortex,” PLoS Biol. 6, e16. 10.1371/journal.pbio.0060016 [DOI] [PMC free article] [PubMed] [Google Scholar]
- Iskarous, K. (2005). “ Patterns of tongue movement,” J. Phonetics 33, 363–381. 10.1016/j.wocn.2004.09.001 [DOI] [Google Scholar]
- Iskarous, K., Goldstein, L., Whalen, D., Tiede, M., and Rubin, P. (2003). “ CASY: The Haskins configurable articulatory synthesizer,” in 15th International Congress of Phonetic Sciences, Barcelona, Spain, pp. 185–188.
- Iskarous, K., Shadle, C. H., and Proctor, M. I. (2011). “ Articulatory-acoustic kinematics: The production of American English/s,” J. Acoust. Soc. Am. 129, 944–954. 10.1121/1.3514537 [DOI] [PMC free article] [PubMed] [Google Scholar]
- Jakobson, R., Fant, G., and Halle, M. (1951). Preliminaries to Speech Analysis. The Distinctive Features and Their Correlates (MIT Press, Cambridge, MA: ), 58 pp. [Google Scholar]
- Kelso, J. (2009). “ Synergies: Atoms of brain and behavior,” Prog. Motor Control, Adv. Exper. Med. Bio. 629, 83–91. 10.1007/978-0-387-77064-2_5 [DOI] [PubMed] [Google Scholar]
- Kim, T., Shakhnarovich, G., and Urtasun, R. (2010). “ Sparse coding for learning interpretable spatio-temporal primitives,” Adv. Neural Inf. Process. Syst. 22, 1–9. [Google Scholar]
- Kong, D., Ding, C., and Huang, H. (2011). “ Robust nonnegative matrix factorization using l21-norm,” in Proceedings of the 20th ACM international conference on Information and knowledge management, 673–682 (ACM).
- Lee, D., and Seung, H. (2001). “ Algorithms for non-negative matrix factorization,” Adv. Neural Inf. Process. Syst. 13, 556–562. [Google Scholar]
- Leurgans, S. E., Moyeed, R. A., and Silverman, B. W. (1993). “ Canonical correlation analysis when the data are curves,” J. R. Stat. Soc. Ser. B 55(3 ), 725–740. [Google Scholar]
- Ma, S., and Feldman, A. (1995). “ Two functionally different synergies during arm reaching movements involving the trunk,” J. Neurophysiol. 73, 2120–2122. [DOI] [PubMed] [Google Scholar]
- Mairal, J., Bach, F., Ponce, J., and Sapiro, G. (2010). “ Online learning for matrix factorization and sparse coding,” J. Mach. Learning Res. 11, 19–60. [Google Scholar]
- Makhoul, J. (1975). “ Linear prediction: A tutorial review,” Proc. IEEE 63, 561–580. 10.1109/PROC.1975.9792 [DOI] [Google Scholar]
- Mallat, S., and Zhang, Z. (1993). “ Matching pursuits with time-frequency dictionaries,” IEEE Trans. Signal Processing 41, 3397–3415. 10.1109/78.258082 [DOI] [Google Scholar]
- Mel, B. (1999). “ Computational neuroscience: Think positive to find parts,” Nature 401, 759–760. 10.1038/44507 [DOI] [PubMed] [Google Scholar]
- Mitra, V., Nam, H., Espy-Wilson, C. Y., Saltzman, E., and Goldstein, L. (2011). “ Articulatory information for noise robust speech recognition,” IEEE Trans. Audio Speech Lang. Processing 19, 1913–1924. 10.1109/TASL.2010.2103058 [DOI] [Google Scholar]
- Mitra, V., Nam, H., Espy-Wilson, C., Saltzman, E., and Goldstein, L. (2012). “ Recognizing articulatory gestures from speech for robust speech recognition,” J. Acoust. Soc. Am. 131, 2270–2287. 10.1121/1.3682038 [DOI] [PubMed] [Google Scholar]
- Mussa-Ivaldi, F., Gantchev, N., and Gantchev, G. (1999). “Motor primitives, force-fields and the equilibrium point theory,” in From Basic Motor Control to Functional Recovery (Academic, Sofia, Bulgaria: ), pp. 392–398. [Google Scholar]
- Mussa-Ivaldi, F., and Solla, S. (2004). “ Neural primitives for motion control,” IEEE J. Oceanic Eng. 29, 640–650. 10.1109/JOE.2004.833102 [DOI] [Google Scholar]
- Nam, H., Goldstein, L., Browman, C., Rubin, P., Proctor, M., and Saltzman, E. (2006). TADA (Task Dynamics Application) Manual (Haskins Laboratories Manual, Haskins Laboratories, New Haven, CT: ), 32 pp. [Google Scholar]
- Nam, H., Mitra, V., Tiede, M., Hasegawa-Johnson, M., Espy-Wilson, C., Saltzman, E., and Goldstein, L. (2012). “ A procedure for estimating gestural scores from speech acoustics,” J. Acoust. Soc. Am. 132, 3980–3989. 10.1121/1.4763545 [DOI] [PMC free article] [PubMed] [Google Scholar]
- Narayanan, S., Nayak, K., Lee, S., Sethy, A., and Byrd, D. (2004). “ An approach to realtime magnetic resonance imaging for speech production,” J. Acoust. Soc. Am. 115, 1771–1776. 10.1121/1.1652588 [DOI] [PubMed] [Google Scholar]
- O'Grady, P., and Pearlmutter, B. (2008). “ Discovering speech phones using convolutive non-negative matrix factorisation with a sparseness constraint,” Neurocomputing 72, 88–101. 10.1016/j.neucom.2008.01.033 [DOI] [Google Scholar]
- Olshausen, B., and Field, D. (1997). “ Sparse coding with an overcomplete basis set: A strategy employed by V1?,” Vis. Res. 37, 3311–3325. 10.1016/S0042-6989(97)00169-7 [DOI] [PubMed] [Google Scholar]
- Olshausen, B., and Field, D. (2004). “ Sparse coding of sensory inputs,” Curr. Opinion Neurobiol. 14, 481–487. 10.1016/j.conb.2004.07.007 [DOI] [PubMed] [Google Scholar]
- Ostry, D., Gribble, P., and Gracco, V. (1996). “ Coarticulation of jaw movements in speech production: Is context sensitivity in speech kinematics centrally planned?,” J. Neurosci. 16, 1570–1579. [DOI] [PMC free article] [PubMed] [Google Scholar]
- Ramanarayanan, V., Katsamanis, A., and Narayanan, S. (2011). “ Automatic data-driven learning of articulatory primitives from real-time MRI data using convolutive NMF with sparseness constraints,” in Twelfth Annual Conference of the International Speech Communication Association, Florence, Italy.
- Richmond, K. (2002). “ Estimating articulatory parameters from the acoustic speech signal,” Ph.D. thesis, University of Edinburgh, Edinburgh, U.K. [Google Scholar]
- Rubin, P., Saltzman, E., Goldstein, L., McGowan, R., Tiede, M., and Browman, C. (1996). “ CASY and extensions to the task-dynamic model,” in 1st ETRW on Speech Production Modeling: From Control Strategies to Acoustics; 4th Speech Production Seminar: Models and Data, Autrans, France.
- Saltzman, E., and Munhall, K. (1989). “ A dynamical approach to gestural patterning in speech production,” Ecol. Psychol. 1, 333–382. 10.1207/s15326969eco0104_2 [DOI] [Google Scholar]
- Saltzman, E., Nam, H., Krivokapic, J., and Goldstein, L. (2008). “ A task-dynamic toolkit for modeling the effects of prosodic structure on articulation,” in Proceedings of the 4th International Conference on Speech Prosody (Speech Prosody 2008), Campinas, Brazil.
- Schwarz, G. (1978). “ Estimating the dimension of a model,” Ann. Stat. 6, 461–464. 10.1214/aos/1176344136 [DOI] [Google Scholar]
- Smaragdis, P. (2007). “ Convolutive speech bases and their application to supervised speech separation,” IEEE Trans. Audio Speech Language Processing 15, 1–12. 10.1109/TASL.2006.876726 [DOI] [Google Scholar]
- Sosnik, R., Hauptmann, B., Karni, A., and Flash, T. (2004). “ When practice leads to co-articulation: The evolution of geometrically defined movement primitives,” Exp. Brain Res. 156, 422–438. 10.1007/s00221-003-1799-4 [DOI] [PubMed] [Google Scholar]
- Strang, G. (2003). Introduction to Linear Algebra (Wellesley Cambridge Press, Wellesley, MA: ), 571 pp. [Google Scholar]
- Theis, F., Stadlthanner, K., and Tanaka, T. (2005). “ First results on uniqueness of sparse non-negative matrix factorization,” in Proceedings of the 13th European Signal Processing Conference (EUSIPCO05), Istanbul, Turkey.
- Tresch, M., Cheung, V., and d'Avella, A. (2006). “ Matrix factorization algorithms for the identification of muscle synergies: evaluation on simulated and experimental data sets,” J. Neurophysiol. 95, 2199–2212. [DOI] [PubMed] [Google Scholar]
- Turvey, M. (1990). “ Coordination,” Am. Psychol. 45, 938–953. 10.1037/0003-066X.45.8.938 [DOI] [PubMed] [Google Scholar]
- Wang, W., Cichocki, A., and Chambers, J. (2009). “ A multiplicative algorithm for convolutive non-negative matrix factorization based on squared Euclidean distance,” IEEE Trans. Sig. Processing 57, 2858–2864. 10.1109/TSP.2009.2016881 [DOI] [Google Scholar]
- Wrench, A. (2000). “ A multi-channel/multi-speaker articulatory database for continuous speech recognition research,” in Workshop on Phonetics and Phonology in Automatic Speech Recognition, Saarbrucken, Germany. [Google Scholar]
- Young, S., Evermann, G., Gales, M., Hain, T., Kershaw, D., Liu, X., Moore, G., Odell, J., Ollason, D., and Povey, D. (2006). “The HTK book (for HTK version 3.4),” Technical Report (Cambridge University Engineering Department, Cambridge, UK), 384 pp.
- Zhou, F., Torre, F., and Hodgins, J. (2008). “ Aligned cluster analysis for temporal segmentation of human motion,” in 8th IEEE International Conference on Automatic Face & Gesture Recognition, 2008. FG'08 (IEEE, New York: ), pp. 1–7.


