Abstract
Single-molecule studies of the conformations of the intact β2 adrenergic receptor were performed in solution. Photon bursts from the fluorescently tagged adrenergic receptor in a micelle were recorded. A photon-burst algorithm and a Poisson time filter were implemented to characterize single molecules diffusing across the probe volume of a confocal microscope. The effects of molecular diffusion and photon number fluctuations were deconvoluted by assuming that Poisson distributions characterize the molecular occupation and photon numbers. Photon-burst size histograms were constructed, from which the source intensity distributions were extracted. Different conformations of the β2 adrenergic receptor cause quenching of the bound fluorophore to different extents and hence produce different photon-burst sizes. An analysis of the photon-burst histograms shows that there are at least two distinct substates for the native adrenergic membrane receptor. This behavior is in contrast to one peak observed for the dye molecule, rhodamine 6G. We test the reliability and robustness of the substate number determination by investigating the application of different binning criteria. Conformational changes associated with agonist binding result in a marked change in the distribution of photon-burst sizes. These studies provide insight into the conformational heterogeneity of G protein-coupled receptors in the presence and absence of a bound agonist.
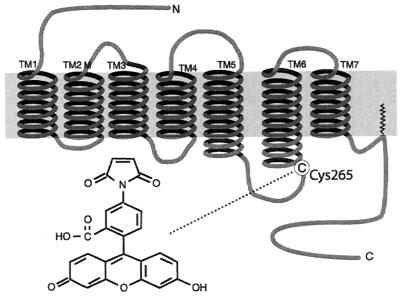
G protein-coupled receptors (GPCRs) represent one of the largest families of integral membrane proteins, and GPCRs are responsible for most transmembrane signal transduction by hormones and neurotransmitters, as well as for the senses of vision, smell, and taste. GPCRs are characterized by seven transmembrane (TM) domains with an extracellular N terminus and a cytoplasmic C terminus (1). For many GPCRs, such as the β2 adrenergic receptor (β2AR), small molecular weight ligands bind to sites within the hydrophobic core formed by the TM α-helices. The β2AR (Fig. 1) belongs to the major subfamily of GPCRs that includes rhodopsin, for which a high-resolution crystal structure is now available (2). The binding of agonist ligands to a receptor induces conformational changes that facilitate interactions between the receptor and its cognate G protein.
Figure 1.
The structure of the β2AR. The binding site of the FM tag at Cys-265 in the third cytosolic loop is shown. The membrane is marked by the dark strip. Homology with the rhodopsin structure suggests that the tag is located at the end of the sixth TM domain.
We have developed a method for site-specifically labeling Cys-265 in the β2AR with fluorescein-5-maleimide (FM; ref. 3) to yield what we call FMβ2AR. Cys-265 is adjacent to a G protein-coupling domain at the end of TM6 (see Fig. 1). In ensemble measurements, we demonstrated previously that FM bound to Cys-265 sensitively reports conformational changes, with agonists inducing a decrease in the fluorescence intensity of FMβ2AR in proportion to the biological efficacy of the agonist. By using exogenous quenchers localized to different environments, we determined that during agonist-induced activation, the domain adjacent to Cys-265 rotates and/or tilts to a more buried environment, which is closer to both the surface of the micellar compartment and to the cytoplasmic extension of TM5 (3).
Although these studies using conventional fluorescence spectroscopy provided insight into the structural changes that occur on agonist activation, they were not able to characterize the complexity of conformational states and their dynamics.
With the use of single-molecule techniques it is possible to overcome the problem of ensemble averaging of traditional functional biochemical methods (4–8). Furthermore, the activities of different molecules do not need to be synchronized to follow fluctuations. Here we describe single-molecule measurements that sharply differ from most other single-molecule studies in that the protein under study is not bound to a surface.
Conformational changes bring about different levels of quenching (9, 10). Briefly, a change in the conformation of the protein, e.g., one that is involved in ligand binding, causes the fluorescence intensity of the label to modulate in concert with the encounters of the tag with its nanoenvironment. In our fluorescence-quenching studies, photon bursts from a single molecule are recorded for milliseconds, and large numbers of such events are collected. A histogram of delay times between bursts is constructed, from which we derive a Poisson time filter. The histogram reveals an exponential decay with delay time. We define residence time in the probe volume as the half decay time of this histogram. We accept photon bursts whose delay times are within the residence time as belonging to an individual molecule that may have left and reentered the probe volume more than once during the residence time. Photon-burst size distributions are recorded for the native receptor before and after it has been exposed to various ligands. The photon shot noise and molecular occupation number fluctuations arising from diffusion inside the probe volume are described by means of Poisson distributions. The intensity distribution emitted by the receptor is calculated by deconvolutions. By comparing intensity distributions, we learn about the effects of ligands on the receptor through the quenching of the fluorescent label. We find that the native receptor exists in at least two distinct conformational substates. We also find that binding to various ligands (agonists and antagonists) changes both the shape of the entire distribution and the populations of the conformational substates.
Materials and Methods
Expression, Purification, and Labeling.
The procedures we use for the preparation of the FMβ2AR have been described fully elsewhere (3). Briefly, the wild-type β2AR is expressed in Sf9 insect cells. The receptor is solubilized in the detergent N-dodecyl-b-d-maltoside (NDM) so that it is incorporated into micelles, then it is purified by a series of three affinity chromatography procedures (11).The purified receptor is labeled at a single cysteine (Cys-265) with FM (Molecular Probes). Fig. 1 shows the location of the FM dye in the receptor. There are 13 cysteines in the β2AR, yet only Cys-265 is labeled with the relatively large, polar fluorophore FM under the conditions used (see ref. 3 and references therein). Five of the 13 cysteines are within transmembrane domains and not accessible to polar FM. Four extracellular cysteines have been shown to be disulfide bonded. One cysteine in the C terminus is palmitoylated. The remaining two C terminal cysteines form a disulfide bond during purification (3). Labeling specificity was confirmed by peptide mapping and mutagenesis of potential reactive cysteines (data not shown).
Single-Molecule Spectroscopy.
The experimental system uses a confocal microscope that has a single-photon counting avalanche photodiode (SPAD) (SPCM-200; EG & G, Vauderuil, Quebec) whose output is recorded with a multichannel scaler (EG & G Ortec, Oak Ridge, TN). The 488-nm line of an argon ion laser (Lexel, Fremont, CA), operated at 600 μW, excites the fluorescent tags. The fluorescence excitation path includes a λ/2 waveplate combined with a polarizer to control the intensity and polarization of the input beam. The objective lens in the Nikon Diaphot (Melville, NY) microscope is an oil immersion Nikon Plan Apo ×100, 1.4 numerical aperture (N.A.). A dichroic beamsplitter, 505DRLP02, and an emission filter, 535AF45, both from Omega Optical (Brattleboro, VT), separate the excitation and emission photons in the microscope. The fluorescence from a subfemtoliter volume passes through a pinhole whose size is set to 50 microns. The small probe volume in combination with the use of concentrations between 1–3 nM enable us to measure individually tagged proteins. The time bin in the measurements is 3 ms for the receptor incorporated in micelle studies and 1 ms for the free rhodamine 6G. For the rhodamine 6G, the laser power is 2 mW and the emission filter is 545RDF35 from Omega Optical. Rhodamine 6G was purchased from Kodak and was dissolved in propylene carbonate from Aldrich.
The Drug Assay.
The buffer solution for the receptor contained 20 mM Tris⋅HCl buffer (pH 7.5) with 0.1% N-dodecyl-b-d-maltoside (NDM; Calbiochem), and 500 mM NaCl. To protect the emission of the fluorescein tag we added 100 mM mercaptoethylamine (MEA; Sigma). MEA is known to deplete the fluorescein triplet state without affecting the first singlet excited state (12). Thus, photobleaching caused by the long-lived triplet excited state is prevented without perturbation to the emission cycle. MEA always was prepared immediately before the measurements in fresh 200 mM Tris, pH 7.5. MEA did not adversely affect the response of the receptor to ligands in ensemble fluorescence studies (data not shown). The t1/2 of the isoproterenol (ISO)-induced fluorescence changes in ensemble studies performed at 25°C was 91 ± 2 s under these conditions. Drug effects were studied at saturating doses [100 μM for the agonist isoproterenol and 20 μM for the antagonist alprenolol (ALP)]. All drugs were purchased from Sigma. To ensure full mixing, equal conditions, and minimal perturbation for the receptor in the native and drug-active cases, we mixed the drugs in a vial before transfer into the 300-μl microscope chamber. The native receptor was compared with the drug-activated receptor for the same dilutions and after the same time in the chamber. All experiments were performed at room temperature. The fluorescence measurements showed that there was no addition of background by fresh ISO or alprenolol (ALP) to what was measured for the buffer solution, with a maximum noise of 2 photon counts per 3-ms channel.
Results and Discussion
Measurement of Photon Bursts from Single Molecules.
To confirm that we are able to set the conditions to view only a single FMβ2AR molecule, we carried out studies of single-molecule fluorescence as a function of concentration. A stock solution of FMβ2AR was diluted from an initial concentration of 1–3 μM to final concentrations of 0.5–30 nM. Care was taken to avoid shaking, bubble formation, and temperature changes. We observed photon bursts from the fluorescein-tagged receptor until the receptor diffused away. We plotted the dependence of the photon-burst number on the receptor concentration, and we observed an exponential decay with concentration when the concentration was less than 6 nM.
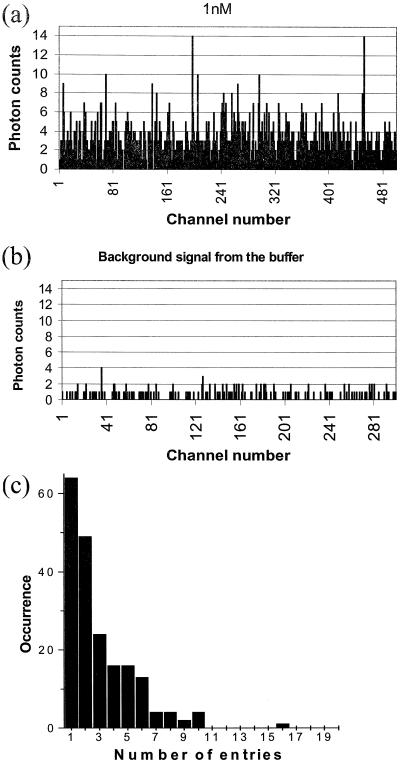
We selected the working receptor concentration to be between 1 and 3 nM to meet single-molecule sensitivity and to enable us to follow as many receptors as possible during recording of the multichannel output (15 s). During this observation time and with this concentration, ≈200 receptors are studied. Fig. 2 shows the typical signal-to-noise ratio achieved in the measurements of the native receptor (Fig. 2a) compared with the background (Fig. 2b).
Figure 2.
The signal relative to the noise in the single-molecule measurements (channel length, 3 ms). (a) A 1 nM receptor tagged with FM, (b) the background resulting from the buffer that includes the salts, the detergent, and the MEA protecting agent, and (c) reentry occurrence frequency of single molecules into the probe volume.
We use a photon-burst algorithm that was modified from that described by Keller et al. (13). A photon burst is defined here as four channels in duration. The channel length is chosen to be the typical time required for the target to diffuse through the focal volume. The channel length is set to 3 ms for the larger dye-tagged receptor and to 1 ms for the smaller dye molecule, rhodamine 6G. Moreover, a photon burst is defined to occur only when the first and last channels are below the background threshold (set at 3 photons) and the middle two channels exceed the background threshold, and at least one of them exceeds the peak threshold (set at 7 photons). The peak threshold value is chosen as a compromise between too large a value, which leads to loss of information, and too small a value, which is not sufficient to obtain acceptable signal-to-noise ratios. These conditions discriminate against possible aggregates because aggregates are expected to diffuse more slowly and therefore their fluorescence signature will not fit the four-channel burst duration criterion. From the multichannel scaler trace 5,000 channels were analyzed for photon bursts. The photon counts in a burst were summed first to obtain the total number of photon counts per burst. A distribution of the photon-burst sizes was prepared by plotting the number of photon bursts having a specific size.
We confronted the problem of whether a photon burst belonged to a receptor that had reentered the probe volume or to a new receptor. To distinguish between these two cases, a “Poisson time filter” was used. For diffusion, the probability of detecting the next burst at a specific delay time after the registration of a burst follows an exponential decay in time (14, 15), P(Δt) = α⋅exp[−βΔt], where α is a proportionality constant, β is a characteristic frequency at which events occur, and Δt is the delay time between successive bursts. In addition to the burst-size distribution, a delay-time histogram of these bursts was constructed, and a fit to an exponential decay was performed. Only delay times shorter than the half decay time τR of this histogram, which has the value of 30 ms for the receptor and 9 ms for rhodamine, were considered as belonging to an individual molecule. The half decay time τR is the average residence time (14) of the molecule in the focal volume. [The probe volume can be recovered (14) from the concentration value, the diffusion time, and the measured residence time, and is calculated to be ≈0.3 fl].
For each individual molecule, the photon bursts from single passes through the probe volume are recorded. We follow a single molecule during its residence time in the probe volume and determine how many times it reenters the probe volume. With this information, we compute the average photon-burst size per pass for each molecule. Fig. 2c shows the distribution of the number of receptor entries to the probe volume. We find for the native receptor that 32% make 1 pass, 56% make 2 passes or fewer, 68% make 3 passes or fewer, and 90% make 6 passes or fewer. By applying the Poisson treatment to the burst-size histograms, we ensure that we are considering each molecule only once, and this individual molecule may leave and reenter the focal volume during the observation period. In other words, we avoid reentries of the same molecule into the probe volume as being considered to be a different molecule. We refer to the histograms as Poisson time-filtered or unprocessed, according to whether or not we used this residency time criterion to ensure individuality.
Photon-Burst Distributions from Native Receptors.
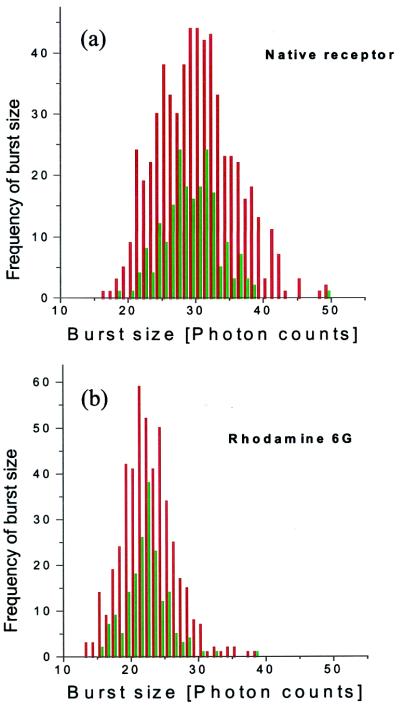
Fig. 3a shows the burst-size histograms for the labeled native FMβ2AR, including the unprocessed burst distribution in red and the Poisson time-filtered distribution in green. The burst size is in units of number of photon counts. Compared with the averaged values of burst sizes (arising from single passes) per individual molecule that are plotted here, the total integrated number of photon counts of all of the bursts of an individual native receptor (during its residence time) is ≈90 on average. The averaging operation is the cause of the relative narrowing of the Poisson time-filtered histograms vs. the unprocessed histograms.
Figure 3.
Photon burst-size histograms, with and without the Poisson time-filter treatment, in green and red, respectively. (a) The native receptor after 2 min in the chamber. (b) Rhodamine 6G; the burst size is in units of number of photon counts.
Clearly, fine structure is apparent in both the processed and unprocessed histograms, although more apparent in the former. The fluorescent tag on the native receptor experiences different extents of quenching, which accounts for the appearance of the fine structure. To confirm that these fine-structure features are inherent to the receptor conformations, we compared these results with those for freely diffusing rhodamine 6G molecules that are expected to show a single feature, reflecting one structure (Fig. 3b). When comparing the Poisson time-filtered histograms (in green) for the two cases, we observe that the rhodamine distribution is narrower and shows only one prominent peak.
Deconvolution of the Photon-Burst Distribution.
To verify that our measurements provide access to the actual intensity distribution p(I) from a single receptor we had to overcome the effects of shot noise (statistical counting fluctuations) in the photodetection process and of the variability of the receptor excitation caused by spatial wandering (diffusion) in the probe volume. The photon burst-size histogram that we measure shows the frequency of occurrence of a specific burst size f(n) in terms of the number of individual molecules (N) that seemed to have produced such a number of photon counts (n). The detection process for these single photon-counting events is limited by shot noise, which is described by a Poisson distribution (16). When diffusion occurs, fluctuations in the number of molecules that emit a certain amount of fluorescent photons also follow a Poisson distribution (17–19). This behavior results from fluctuations caused by different trajectories of the receptor across the Gaussian beam. To recover the original emitted fluorescence intensity distributions p(I) from the measured burst-size distributions f(n) we applied the convolution theorem (20).
The detected emission intensity pd(I) depends on the point spread function (x, y, z) of the imaging system that has a Gaussian intensity profile of the laser beam in the probe volume. The occupation number N of an individual molecule to be found in a subvolume with coordinates (x, y, z) has a Poisson distribution (17), so that:
 |
1 |
where p(I) is the actual intensity distribution emitted by the molecule, Poi(N) is defined as the Poisson distribution for finding a single molecule occupying a specific location in the Gaussian beam inside the probe volume, and dxdydz is the infinitesimal volume element (17).
The measured burst-size distribution f(n) is given by the convolution of the detected emission intensity pd(I) with the Poisson distribution of the number of photon counts Poi(n) (16):
 |
2 |
Here, the Poisson distributions Poi(N) and Poi(n) are given by
 |
3 |
 |
4 |
where 〈n〉 and 〈N〉 denote the averaged values of n and N, respectively. Substituting Eq. 1 into Eq. 2 results in
 |
5 |
where we omitted the explicit spatial dependence of the point spread function. We define Fourier transform pairs for f(n), p(I), Poi(n), and Poi(N) according to
 |
6 |
 |
By applying the convolution theorem to Eq. 5, we find
 |
7 |
 |
where ⊗ denotes the convolution operation. Finally, the actual fluorescence emission intensity p(I) is extracted as
 |
8 |
where FT−1 denotes the inverse of the Fourier transform. Eq. 8 is the key transformation for obtaining the actual intensity distribution p(I) from the recorded burst-size histogram f(n).
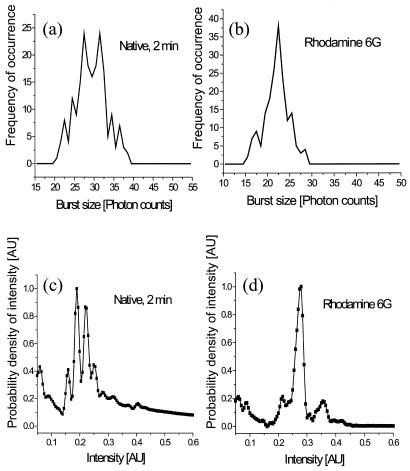
Fig. 4a and b show the Poisson time-filtered burst-size distributions for the native receptor and for rhodamine 6G, respectively, from which we calculate the corresponding fluorescence emission intensity distributions, shown in Fig. 4 c and d. We used fast Fourier transforms (FFT) in computing Eqs. 1–8 for the estimation of the emission intensity distribution. As inputs for the Poisson distributions we used the histograms (Fig. 4 a and b) of the measured burst sizes. It is clear from Fig. 4c that there are at least two well resolved main features in the distribution p(I) of the native receptor. This behavior is in sharp contrast to the rhodamine 6G plot in Fig. 4d that shows only one main feature, as expected for a molecule having a single isoform.
Figure 4.
Comparison of Poisson time-filtered photon burst-size distributions from (a) native receptor, and (b) rhodamine 6G, to the deconvoluted intensity distribution of (c) the native receptor and (d) rhodamine 6G. See text for details of deconvolution procedure.
Thus our measurements provide direct access to the actual intensity distribution p(I) from single receptors. We interpret the fine structure in the burst-size distribution for native FMβ2AR to indicate that the fluorescent reporter experiences different molecular environments owing to different conformations, and that the populations of these conformations can be grouped into two major conformational substates. Hence, our measurements give us direct proof for the existence of conformational heterogeneity. We believe that this heterogeneity is the result of sampling from a rich energy landscape (21, 22) for the receptor in which conformations can be sorted into at least two different classes (conformational substates), one of which experiences more quenching than the other.
It is important to assess whether our analysis procedure is robust and reliable. Fifteen burst-size distributions from five different preparations of the native receptor (after 2 min in the chamber) were analyzed fully with about 200 individual receptors per distribution. Some variability in the weights of the two conformational substates in the native distribution appeared, which is believed to be related to differences between protein preparations. We found that about 75% of the native distributions showed that the peak with the higher count size was more populated than the peak with the lower count size. Only 1 burst-size distribution failed to show 2 peaks at 2 min. Thus, the analysis procedure seems to yield reproducible results.
To verify further the reliability of the estimation of the number of conformational substates, we binned the number of photon counts in plotting the x axis in the photon burst-size distribution. Binning should reduce the possible effect of high frequency noise and avoid its contribution to the intensity distribution. At the same time, binning may cause blurring of possibly real features in the distribution. We used the following rule (23) to restrict the bin number:
 |
9 |
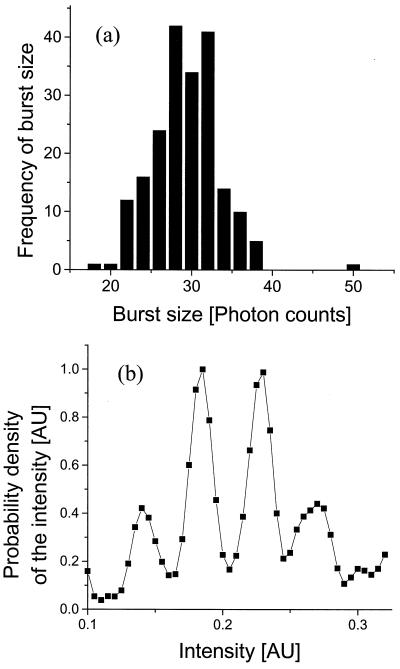
where L represents the number of distinct classifications (different bins) in the photon-burst histogram, and M is the number of data points (number of receptors recorded in the burst-size distribution, which in our case is about 200). Hence, L should be not more than 23, and we chose 20 as the number of intervals for the distribution. We present in Fig. 5a the binned photon-burst distribution calculated by using Eq. 9. In Fig. 5b we present the estimated intensity distribution obtained by deconvolution, using Eq. 8. We observe in both cases that two main peaks are apparent.
Figure 5.
(a) The binned burst-size distribution for the native receptor after 2 min in the chamber. (b) The deconvoluted native emission state distribution calculated from a.
Photon-Burst Distributions from Individual Ligand-Bound Receptors.
To illustrate the power of our analysis procedure, we present here results obtained when a saturated solution of the agonist ISO was added to the native receptor in solution. ISO is classified as a full agonist and has a higher binding affinity (KI ≈10 μM) and higher biological efficacy than the native hormone adrenaline. Ensemble fluorescence spectroscopy shows that ISO induces ≈15% decrease in the intensity of FMβ2AR (3). We examined the burst-size distribution of unliganded single receptors as compared with ISO-bound receptors after 4 min in the chamber.
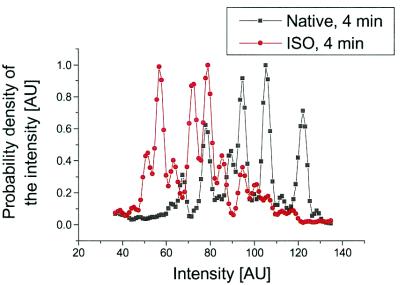
The native receptor as well as the ligand-bound receptor is irradiated for 15 s every 2 minutes. It is necessary to wait several minutes for pharmacological equilibrium to be approached in the case of the ligand-bound receptor. We find that the photon-burst distribution for the native receptor decreases a few percent as a function of time and also changes shape. This decay in the photon-burst distribution also appears in ensemble studies. The decay and shape change is likely caused by some photon-induced change that causes increased quenching. As a result of this behavior, the 4- and 6-min photon-burst distributions of the native receptor are broader than the 2-min one and they show several peaks. Fig. 6 presents the intensity distributions after 4 min for the native receptor (black) and the native receptor bound to ISO (red). For the native receptor we observe a broad distribution of intensities with several peaks, indicating the presence of different conformations. For ISO (red) the overall distribution is narrower and is shifted to lower intensity states.
Figure 6.
The deconvoluted intensity distribution after 4 min for native receptor (black) and native receptor interacting with ISO agonist (red).
The agonist-induced fluorescence change is likely caused by quenching of FM by the side chains of adjacent amino acids. Fluorescein is known to be quenched by charged amino residues (24) (such as arginine), and by bulky residues, particularly those that contain aromatic rings. Among these bulky residues, tyrosine is known to be a most efficient quencher of fluorescein (25), and phenylalanine is a nearest neighbor along the backbone. As was mentioned, during agonist-induced activation, this portion of the receptor's G protein-coupling domain rotates and/or tilts to a more buried environment, which is closer to both the surface of the micellar compartment and to the tip of TM5 (3).
These results suggest that the native receptor is a conformationally flexible molecule that exists in several substates in equilibrium. In contrast, ISO seems to stabilize conformational substates that might be rare in the native receptor. Of particular interest is the observation that at least three states are observed in the presence of saturating concentrations of ISO. We hypothesize that one or more of the states having the smaller intensities represent the active state of the receptor. This suggestion is based on the fact that few of these states are observed in the native FMβ2AR and the observation that the functional activity of a series of agonists and partial agonists correlates well with their ability to decrease the intensity of FMβ2AR by using conventional fluorescence spectroscopy (3). The burst distribution for the ISO-bound receptor could be explained by alternations between ISO-bound and unbound states arising from the relatively low binding affinity and rapid on and off rate of the drug.
Thus, using single-molecule techniques, it is possible to observe directly conformational heterogeneity in a GPCR and to determine the effect of agonist binding on the distribution of receptor substates. Once again, the change in the photon-burst distribution is reproducible and gives us confidence that conformational changes can be observed by using this analysis method. By single-molecule spectroscopy of the native FMβ2AR, we observe two predominant (and perhaps several minor) substates represented by different burst intensities. Fluctuations between the native substates are frequent and can explain the broad burst-size distribution observed for the native FMβ2AR. Binding of ISO leads to transitions to more-quenched substates. We find that binding to various ligands (agonists and antagonists) changes the shape of the entire distribution and also changes the populations of the conformational substates. Thus, it seems that one subset of conformations is selected upon agonist binding, and the receptor structure is stabilized for the interaction with the G protein.
Acknowledgments
We thank Dr. Thorsten Wohland for useful discussions. G.P. is supported by a National Institutes of Health postdoctoral fellowship F32 GM19835-02. P.G. is a member of the Medical Scientist Training Program and is supported in part by National Institutes of Health Training Grant 5T32GM07365. Financial support for this work was provided by National Institute on Drug Abuse Grant DA09873 (to R.N.Z.), and by National Institutes of Health Grant 5R01 NS28471 (to B.K.K.).
Abbreviations
- β2AR
β2 adrenergic receptor
- FM
fluorescein-5-maleimide
- GPCRs
G protein-coupled receptors
- ISO
isoproterenol
- TM
transmembrane
- MEA
mercaptoethylamine
References
- 1.Gether U, Kobilka B K. J Biol Chem. 1998;273:17979–17982. doi: 10.1074/jbc.273.29.17979. [DOI] [PubMed] [Google Scholar]
- 2.Palczewski K, Kumasaka T, Hori T, Behnke C A, Motoshima H, Fox B A, Le Trong I, Teller D C, Okada T, Stenkamp R E, et al. Science. 2000;289:739–745. doi: 10.1126/science.289.5480.739. [DOI] [PubMed] [Google Scholar]
- 3.Ghanouni P, Steenhuis J J, Farrens D L, Kobilka B. Proc Natl Acad Sci USA. 2001;98:5997–6002. doi: 10.1073/pnas.101126198. . (First Published May 15, 2001; 10.1073/pnas.101126198) [DOI] [PMC free article] [PubMed] [Google Scholar]
- 4.Nie S, Chiu D T, Zare R N. Science. 1994;266:1018–1021. doi: 10.1126/science.7973650. [DOI] [PubMed] [Google Scholar]
- 5.Nie S, Zare R N. Annu Rev Biophys Biol Struct. 1997;26:567–596. doi: 10.1146/annurev.biophys.26.1.567. [DOI] [PubMed] [Google Scholar]
- 6.Dickson R M, Cubitt A B, Tsien R Y, Moerner W E. Nature (London) 1997;388:355–358. doi: 10.1038/41048. [DOI] [PubMed] [Google Scholar]
- 7.Xie X S, Trautman J K. Annu Rev Phys Chem. 1998;49:441–480. doi: 10.1146/annurev.physchem.49.1.441. [DOI] [PubMed] [Google Scholar]
- 8.Weiss S. Science. 1999;283:1676–1683. doi: 10.1126/science.283.5408.1676. [DOI] [PubMed] [Google Scholar]
- 9.Eftnik M R. In: Topics in Fluorescence Spectroscopy. Lakowicz J R, editor. New York: Plenum; 1991. pp. 53–127. [Google Scholar]
- 10.Lakowicz J R. Principles of Fluorescence Spectroscopy. 2nd. Ed. New York: Plenum; 1999. pp. 238–289. [Google Scholar]
- 11.Kobilka B. Anal Biochem. 1995;231:269–271. doi: 10.1006/abio.1995.1533. [DOI] [PubMed] [Google Scholar]
- 12.Song S, Verma C, Verhoven J W, Tanke H J. Biophys J. 1996;70:2959–2968. doi: 10.1016/S0006-3495(96)79866-1. [DOI] [PMC free article] [PubMed] [Google Scholar]
- 13.Keller R A, Ambrose W P, Goodwin P M, Jett J H, Martin J C, Wu M. Appl Spectrosc. 1996;50:12A–32A. [Google Scholar]
- 14.Osborne M A, Balasubramanian S, Furey W S, Klenerman D. J Phys Chem. 1998;102:3160–3167. [Google Scholar]
- 15.Feller W. An Introduction to Probability Theory and Its Applications. 3rd. Ed. New York: Wiley; 1968. [Google Scholar]
- 16.Saleh B. Photoelectron Statistics. Berlin: Springer; 1978. [Google Scholar]
- 17.Chandrasekhar S. Rev Mod Phys. 1943;15:1–89. [Google Scholar]
- 18.Qian H, Elson E L. Proc Natl Acad Sci USA. 1990;87:5479–5483. doi: 10.1073/pnas.87.14.5479. [DOI] [PMC free article] [PubMed] [Google Scholar]
- 19.Kask P, Palo K, Ullmann D, Gall K. Proc Natl Acad Sci USA. 1999;96:13756–13761. doi: 10.1073/pnas.96.24.13756. [DOI] [PMC free article] [PubMed] [Google Scholar]
- 20.Jansson J H. Deconvolution of Images and Spectra. 2nd. Ed. San Diego: Academic; 1997. [Google Scholar]
- 21.Frauenfelder H, Silgar S G, Wolynes P G. Science. 1991;254:1598–1603. doi: 10.1126/science.1749933. [DOI] [PubMed] [Google Scholar]
- 22.Frauenfelder H, Wolynes P G, Austin R H. Rev Mod Phys. 1999;71:S419–S430. [Google Scholar]
- 23.Emerson J D, Hoaglin D C. In: Understanding Robust and Exploratory Data Analysis. Hoaglin D C, Mosteller F, Tukey J W, editors. New York: Wiley; 1983. pp. 7–32. [Google Scholar]
- 24.Omelyaneko V G, Jiskoot W, Herron J N. Biochemistry. 1993;32:10423–10429. doi: 10.1021/bi00090a018. [DOI] [PubMed] [Google Scholar]
- 25.Watt R M, Voss E W. Immunochemistry. 1977;14:533–541. doi: 10.1016/0019-2791(77)90308-1. [DOI] [PubMed] [Google Scholar]


