

Abstract
Functional connectivity has been observed to fluctuate across the course of a resting state scan, though the origins and functional relevance of this phenomenon remain to be shown. The present study explores the link between endogenous dynamics of functional connectivity and autonomic state in an eyes-closed resting condition. Using a sliding window analysis on resting state fMRI data from 35 young, healthy male subjects, we examined how heart rate variability (HRV) covaries with temporal changes in whole-brain functional connectivity with seed regions previously described to mediate effects of vigilance and arousal (amygdala and dorsal anterior cingulate cortex; dACC). We identified a set of regions, including brainstem, thalamus, putamen, and dorsolateral prefrontal cortex, that became more strongly coupled with the dACC and amygdala seeds during states of elevated HRV. Effects differed between high and low frequency components of HRV, suggesting specific contributions of parasympathetic and sympathetic tone on individual connections. Furthermore, dynamics of functional connectivity could be separated from those primarily related to BOLD signal fluctuations. The present results contribute novel information about the neural basis of transient changes of autonomic nervous system states, and suggest physiological and psychological components of the recently observed non-stationarity in resting state functional connectivity.
Keywords: Resting state fMRI, Spontaneous activity, Functional connectivity, Heart rate variability, Autonomic nervous system, Vigilance
Introduction
Functional magnetic resonance imaging (fMRI) studies have demonstrated that distributed regions of the brain exhibit temporally correlated blood-oxygen-level-dependent (BOLD) signal fluctuations, even in the absence of tasks or stimuli (“resting state”; (Biswal et al., 1995)). Quantifying functional connectivity in both task and resting states has provided critical advances in the understanding of large-scale neural organization (see (Fox and Raichle, 2007)). While a number of functional networks can be identified quite reliably across individuals and sessions, fluctuations in connectivity on shorter scales within the same individual have been reported, such as in relation to sleep stages (Horovitz et al., 2009), previous history of activation (Grigg and Grady, 2010; Waites et al., 2005), and in resting state, as seen with fMRI (Chang and Glover, 2010; Kiviniemi et al., 2011; Sakoglu et al., 2010) and MEG (de Pasquale et al., 2010). Determining the basis of “spontaneous” connectivity variation is challenging, since there is a limited number of state-related measurements that one can acquire under typical resting-state conditions. Yet certain physiological processes, such as the cardiac and respiratory cycles, are readily monitored during fMRI, offering a potential window into physiological changes that may be associated with fluctuations in brain connectivity.
Heart rate variability (HRV), defined as changes in the beat-to-beat interval or in the instantaneous heart rate, is a widely-used marker of autonomic activity (Task Force, 1996). HRV results from the interaction between parasympathetic (vagal) and sympathetic nervous system influences on the sinoatrial node (reviewed by (Berntson et al., 1997)). The high frequency (HF) component of HRV, spanning approximately the range 0.15–0.4 Hz, is attributed to respiration-induced heart rate modulation and is mediated primarily by parasympathetic outflow. A lower-frequency (LF) component of HRV, typically defined as 0.05–0.15 Hz, is not fully understood but believed to rather reflect a mixture of sympathetic and parasympathetic activities.
The relative balance of parasympathetic and sympathetic influences can be modulated by breathing, physical activity (Bernardi et al., 1990), arousal, drug intake (Elghozi and Julien, 2007; Elghozi et al., 2001; Penttila et al., 2005) and more stable states such as mood or diseases involving the autonomous nervous system (ANS), such as cardiac ischemia (reviewed in Montano et al., 2009). HRV is an important predictor of mortality (Huikuri et al., 2009), and decreased HRV is also one well-described symptom of ANS dysregulation in depression (Kemp et al., 2010; Licht et al., 2008). States of different HRV levels can be readily connected to distinct states of ANS activity; e.g., HRV is modulated by emotionally salient contexts, with subsequent changes in sympathetic tone (Jonsson and Sonnby-Borgstrom, 2003; Wallentin et al., 2011). Whether such state changes during resting state would also be reflected by changes in the low frequency dynamics of brain connectivity is, so far, unknown.
Previous fMRI and PET studies have examined the neural basis of HRV changes by measuring BOLD activity (Critchley et al., 2003; Napadow et al., 2008) and regional cerebral blood flow (rCBF; Gianaros et al., 2004; Lane et al., 2009) in relation to task-induced emotional, physical, and cognitive changes in HRV. Results of a task-based study relating HRV to brain activation might be affected by the specific task, causing a coincidence of brain activation and changes in HRV. As such, a task-free approach of resting state fMRI might offer new insights into brain heart interactions, examining spontaneous variations in brain activity and HRV that are not constrained by the activation and functional network connectivity representative of the functional state imposed by the task manipulation.
The present study investigates the dynamic association between functional connectivity and HRV in the resting state. We apply a sliding-window analysis of functional connectivity seeded from regions implicated in salience and autonomic processing, the dorsal anterior cingulate cortex (dACC) and amygdala (Critchley et al., 2003; Dalton et al., 2005; Seeley et al., 2007), and ask whether there are regions whose temporal variation in connectivity strength with these nodes significantly correlates with variations in HRV across the scan. While there are a number of brain regions involved in autonomic control, the dACC and amygdala are among the most important (Critchley, 2005; Critchley et al., 2003; Lane et al., 2009; Thayer et al., 2012). In addition, the dACC is a key node of the salience network (Seeley et al., 2007), and exhibits robust resting-state functional connectivity with other regions related to HRV – notably, including the insula (Critchley et al., 2003; Medford and Critchley, 2010) – and may therefore be regarded as a representative node for such a network of regions. The amygdala was highlighted as having a significant relationship with HRV across multiple studies in a recent meta-analysis (Thayer et al., 2012). It was also observed that emotional films evoked dynamic, sadness-correlated fluctuations in HRV as well as in the functional connectivity within a network of limbic regions that included the amygdala (Raz et al., 2012). Both the dACC and the amygdala have been used as regions of interest (ROIs) for functional connectivity analysis in previous studies of autonomic control and salience processing (e.g. Gianaros et al., 2008; Pannekoek et al., in press).
The finding of a significant correlation between functional connectivity and HRV may illuminate potential factors underlying dynamic changes in resting-state connectivity. In turn, delineating the brain regions exhibiting such connectivity modulation may bring further insight into neural mechanisms underlying autonomic control mechanisms. With regard to the latter, this work differs from and extends previous neuroimaging literature (reviewed in Thayer et al., 2012) by considering fluctuations of HRV under resting-state conditions rather than external manipulations, and by examining functional connectivity in addition to (and in comparison with) the BOLD signal time series itself.
Methods
Subjects
Participants included 36 healthy volunteers, who were recruited by study advertisements. All volunteers completed the mini-international neuropsychiatric interview (MINI), specifically to ensure the absence of any ICD-10 psychiatric disorders (Sheehan et al., 1998). Exclusion criteria consisted of self-reported psychiatric, neurological or medical illness, as well as common exclusion criteria for MRI. The study was approved by the institutional review board of the University of Magdeburg, Germany, and all subjects provided written informed consent. Data from one subject was omitted due to corruption of cardiac data, so a total of 35 subjects were included in all analyses described below.
fMRI acquisition
Magnetic resonance imaging was performed at 3 T using a Siemens MAGNETOM Trio scanner (Siemens, Erlangen, Germany) with an 8-channel phased-array head coil. Subjects underwent a resting-state scan of duration 610 s, during which they were instructed to lie still with their eyes closed. Functional MRI time series of 488 volumes were acquired with an echo-planar imaging sequence and the following acquisition parameters: TR=1250 ms, TE=25 ms, flip angle=70°, FOV=22 cm, acquisition matrix=44×44 (voxel size=5×5×5 mm3). Each volume comprised 26 contiguous axial slices covering the entire brain. High resolution T1-weighted structural MRI scans of the brain were acquired for anatomic reference using a 3D-MPRAGE sequence (TE=4.77 ms, TR=2500 ms, T1=1100 ms, flip angle=7°, bandwidth=40 Hz/pixel, acquisition matrix=256×256×192, isometric voxel size=1.0 mm3). Cushions were used to minimize head motion during the scan.
Physiological recordings
Cardiac and respiratory data were acquired concurrently with fMRI using the scanner’s built-in equipment. The cardiac cycle was monitored using a photoplethysmograph placed on the right index finger, and respiration was monitored using a bellows strapped around the upper thorax. The sampling rate of the Siemens built-in equipment for both signals was 49.82 Hz, and a time stamp on the output permitted temporal registration to the BOLD functional images.
fMRI pre-processing
The first 5 time frames were discarded to allow the MR signal to achieve T1 equilibrium. RETROICOR was performed in order to reduce artifacts due to cyclic cardiac and respiratory noise (Glover et al., 2000). Our implementation of RETROICOR is an in-house C program that performs slice-wise corrections in native acquisition space and uses a 2nd-order Fourier expansion for both cardiac and respiratory regressors (Glover et al., 2000). Subsequent pre-processing included slice-timing correction with sinc interpolation, motion coregistration with FSL (MCFLIRT; Jenkinson et al., 2002) and nuisance regression of the following time series: linear and quadratic temporal trends, 6 affine motion parameters, and the time series of one region of interest (ROI) in the white matter (3-mm-radius sphere centered at x=26, y=−12, z=35) and one ROI in the cerebrospinal fluid (CSF; 3-mm-radius sphere centered at x=9, y=−33, z=18). The white and CSF ROIs are identical to those used in our previous studies (Chang and Glover, 2009, 2010). Also included in the nuisance regression were two signals designed to model the causal, non-neural influence of low-frequency respiratory volume (RV) and heart rate (HR) changes on the BOLD signal, and were formed by convolving RV and HR with the impulse response functions described in our previous study (Chang and Glover, 2009). No other temporal filtering was performed.
Regions of interest
Two ROIs – one in the dACC and one in the right amygdala – were selected as seed regions for the functional connectivity analysis (Fig. 1). The amygdala ROI was defined from the AAL library provided with the Marsbar software (http://marsbar.sourceforge.net). The dACC ROI was first defined based on anatomical landmarks on a single subject level yielding a cubic ROI (volume=4 ml, F–H: 10 mm, A–P: 20 mm, L–R: 20 mm) which consisted of both left and right dorsal anterior cingulate gray matter, according to sulcal boundaries, to maximize signal-to-noise ratio and gray matter coverage. The anterior part of the cubic ROI, oriented with its A–P axis along the cingulate sulcus, was positioned to intersect a line perpendicular to AC–PC plane that in turn intersected the rear border of the anterior genu of the corpus callosum at the midsagital plane. These single-subject ROIs were then normalized to MNI space, and all voxels present in at least half of the subjects were included in the final ROI. This ROI, representing the mean dACC based on anatomical landmarks of our sample, was then reverse-normalized to each subject’s mean functional image using SPM5 (http://www.fil.ion.ucl.ac.uk/spm), generating native-space ROIs for each subject from which time series were extracted.
Fig. 1.

Locations of dACC (top row; blue) and amygdala (bottom row; red) seed regions, shown in neurological convention.
Heart rate variability analysis
Heart rate variability was calculated as the root mean square deviations (RMSSD) of the heart rate time series, which is an established metric of HRV (Task Force, 1996). The RMSSD metric primarily reflects the HF (parasympathetic) component of HRV, and has been verified to relate closely to frequency-domain measures of high-frequency HRV (Hayano et al., 1991). We compute the RMSSD of HRV across a window of time wt=[t,t+T] of length T as:
where Nt is the number of heart beats in wt, and Δi is the time interval between the ith and (i–1)th R-waves falling in wt, such that 1/Δi approximates the heart rate near the ith R-wave. Some studies of heart rate variability are based on the heart period (Δi) rather than rate (1/Δi) time series, and there does not appear to be a consensus regarding which metric is a superior index of autonomic activity (Berntson et al., 1997). We also computed the sliding-window heart period time series for each subject, and observe high correlation between the two metrics (see Results) and negligible differences at the group level (data not shown).
While RMSSD captures primarily the high frequency component of HRV, we additionally use a frequency-domain measure of HRV in order to more specifically compare the effects of low- and high-frequency components of the HRV. After resampling the inverse inter-beat-interval time series onto a regular grid (sampling interval=0.25 s) using sinc interpolation, the LF and HF components of HRV over a time window wt=[t,t+T] were obtained by computing the Fourier transform over timepoints in wt and extracting the power in the LF (0.05–0.15 Hz) and HF (0.15–0.5 Hz) bands, respectively. As will be described in the next section, calculation of RMSSD-HRV, HF-HRV, and LF-HRV was performed in sliding windows across the resting-state scan, generating a time series of HRV measurements that can be compared to a time series of functional connectivity measurements computed in identical windows.
Prior to computing all HRV metrics, intermittent errors in R-wave detection were repaired using linear interpolation over the affected segment of the heart rate time series. Peak-detection errors and noisy segments of data were identified by visual inspection of the raw cardiac (photoplethysmograph) traces. Thirteen subjects had segments of cardiac data that needed repair; amongst these 13, the average number of data points needing repair was less than 1% of each subject’s total number of heart rate time points (0.96%±0.94%).
Temporal relationship between functional connectivity and heart rate variability
A major objective of the current study is to identify brain regions whose functional connectivity with the dACC and amygdala vary in concert with changes in autonomic state (HRV). For each subject and seed ROI, a whole-brain sliding-window analysis of seed-based functional connectivity was performed in individual space, using 45-s windows with 50% overlap between adjacent windows (to reduce temporal autocorrelation), yielding 25 windows across each resting-state scan. Every voxel’s sequence of sliding-window correlation coefficients with the seed was then transformed to a sequence of Fisher z values, and was subsequently compared to the sequence of sliding-window HRV measurements (performed in identical time windows) using linear regression (Fig. 2). Prior to computing sliding-window measurements, all fMRI time series were shifted back in time by 5 s (=4 TRs) to account for the approximate hemodynamic delay. However, we note that due to the long sliding-window size, the 5-s offset in fact had a negligible impact on the final results. The reason for simply shifting the time window for HRV calculations, rather than convolving the HRV waveform with a hemodynamic response function, is because here we are treating HRV as a state variable in the sliding-window analysis and hence desire the undistorted amplitude values.
Fig. 2.

Schematic of approach for calculating the temporal relationship between functional connectivity and heart rate variability. A sliding-window analysis of heart rate variability is performed on the heart rate time series (upper left), producing a sequence of HRV values across the scan (upper right). Similarly, a sliding-window analysis of correlation between the BOLD signal of the seed time series and that of each voxel in the brain is performed (illustrated for one voxel; lower left), producing a sequence of functional connectivity values (lower right). Finally, the HRV and functional connectivity sequences are compared using linear regression.
Adjusting for respiratory effects
Respiration rate and volume are known to affect the amplitude of HRV. As such, measurements of HRV are entangled with concurrent changes in respiratory parameters that may also cause changes in BOLD activity, either neural (Evans et al., 1999; Evans et al., 2009) or artifactual (Glover et al., 2000; Birn et al., 2006; Wise et al., 2004). Therefore, we performed a supplementary re-analysis in which sliding-window measures of respiratory rate and respiration volume were included alongside HRV in the linear regression model against functional connectivity. However, we note that the auto-gaining and limited dynamic range of the Siemens respiratory monitoring system used here affects the observation of effects of long term changes of intrathoracal volume as well as accurate measures of extreme maneuvers, such as very deep breaths; the former is unlikely to affect the analysis, since changes in HRV/respiration are analyzed on time-scales shorter than would be affected by the autogain procedure.
Normalization and group analysis
To examine results at the group level, single-subject Pearson correlation maps were converted to Fisher z statistics, normalized to the MNI space with the SPM5 “EPI’ template and 3-mm isotropic resampling, and smoothed with a 6-mm full-width-half-max Gaussian kernel. The resulting images were entered into a group-level one-sample t-test in SPM5, with an explicit gray matter mask applied during statistical testing. An SPM8 full factorial model was used to assess frequency- (high and low frequency component) and ROI-dependent influences (dACC, amygdala) of HRV on changes in FC. Corresponding ROI values were extracted using the REX toolbox for SPM8 (by Susan Whitfield-Gabrieli) for visual display. Statistical testing of extracted values was performed using SPSS 15. All coordinates are reported in MNI space, and all figures of group-level activation appear in neurological convention, superimposed on the ch2 template from the MRIcron software (http://www.mricron.com). Statistical significance was determined with cluster-level thresholding (Poline et al., 1997) to obtain clusters at the corrected level of p<0.05. Unless stated otherwise, the initial cluster-defining uncorrected height threshold was p<0.001.
Inter-subject relationship between functional connectivity and heart rate variability
In addition to understanding how functional connectivity covaries over time with HRV within subjects, it is also of interest to know whether – across subjects – the mean functional connectivity across a scan relates to mean HRV across the scan. This secondary aim follows the assumption that temporal variability of physiological, psychological or brain states would at some degree be scale free, so that the same brain systems which underlie faster individual dynamics within a 10 min resting state scan may also represent slower state cycles which, due mainly to phase shifts, result in inter-individual differences in healthy subjects across a 10 min period. For this analysis, each subject’s static functional connectivity map (across the whole rest period) was entered into a group-level regression with mean HF-HRV as a covariate. The analysis was repeated with the covariate of mean LF-HRV. Networks that covaried with subjects’ mean HRV were then compared to those underlying intrasubject dynamics.
Resting-state BOLD signal relating to HRV
We also quantified BOLD signal fluctuations (activation) relating to HRV in the resting state. For this analysis, instantaneous power in the LF and HF bands of HRV was determined by applying a continuous wavelet transform (Morlet wavelet, Ψ0(η)=π−1/4eiω0ηe−η2/2, with ω0=6) to the heart rate time series. At each time point, the wavelet transform magnitude was averaged over scales within the 0.05–0.15 Hz band to obtain a time series of LF power, and over scales within the 0.15–0.4 Hz band for HF power. The resulting power time series were convolved with the hemodynamic response function from SPM5 and regressed against the BOLD signal time series from every voxel in the brain.
Results
Relationship between HRV and respiration parameters
Correlations between sliding-window measures of HRV and respiration are shown in Table 1. The RMSSD metric of HRV using both the heart rate and inter-beat-interval time series were strongly correlated (0.90±0.09); results presented henceforth will be based on the heart rate time series. As expected, the relationship between RMSSD and frequency-domain HRV metrics was higher for the HF band (0.79±0.15) than for the LF band (0.42±0.27). Respiratory rate and volume displayed moderate inverse correlation, and – consistent with known physiology – increases in HRV were associated with increases in respiration volume and with decreases in respiration rate. Mean respiration rates for each subject were 0.27±0.06 Hz, ranging from a minimum of 0.153 Hz to a maximum of 0.38 Hz.
Table 1.
Relationship between sliding-window metrics of HRV and respiration.
| RMSSD-ibi | HF | LF | Respiration rate |
Respiration volume |
|
|---|---|---|---|---|---|
| RMSSD-hr | 0.90 (0.09) | 0.79 (0.15) | 0.42 (0.27) | −0.18 (0.32) | 0.21 (0.26) |
| RMSSD-ibi | 0.69 (0.18) | 0.32 (0.30) | −0.19 (0.35) | 0.13 (0.22)a | |
| HF | 0.29 (0.33) | −0.28 (0.32) | 0.22 (0.26) | ||
| LF | −0.26 (0.27) | 0.37 (0.24) | |||
| Respiration rate |
−0.33 (0.32) |
Values indicate mean of correlation coefficients across N=35 subjects. Standard deviation appears in parentheses. “hr”, heart rate; “ibi”, inter-beat-interval.
The least significant entry has p<0.0023.
Temporal relationship between functional connectivity and heart rate variability
We observed significant covariation of HRV with regional connectivity over the resting-state scan. Regions for which the sliding-window functional connectivity with the dACC had significant positive correlation with the sliding-window fluctuations in HRV (RMSSD measure) are illustrated in Fig. 3 (top row). Corresponding results for the amygdala seed region are presented in the bottom row, and all significant regions are reported in Table 2. Notably, no voxels had functional connectivity fluctuations with either the dACC or amygdala that were negatively correlated with changes in HRV at any statistical threshold. Across subjects, the mean correlation between dACC and amygdala seed time series was r=0.26±0.15.
Fig. 3.
Regions for which temporal fluctuation in functional connectivity with the dACC (top row) and amygdala (bottom row) during resting state had significant positive correlation with fluctuations in HRV. Clusters are significant at p<0.05 corrected.
Table 2.
Regions where RMSSD correlated with functional connectivity of dACC or amygdala. Clusters are significant at p<0.05, corrected; see Fig. 3.
| Regions (cortical) | dACC |
Amygdala |
||||||
|---|---|---|---|---|---|---|---|---|
| x | y | z | t | x | y | z | t | |
| Angular gyrus | 39 | −66 | 48 | 3.91 | ||||
| Anterior insula | −30 | 21 | −12 | 3.44 | −27 | 24 | −3 | 3.9 |
| 27 | 27 | −12 | 4.25 | 30 | 21 | −9 | 5.72 | |
| Cuneus | −12 | −78 | 33 | 3.45 | ||||
| 15 | −69 | 27 | 4.09 | |||||
| Dosal anterior cingulate cortex | 6 | 30 | 27 | 4.87 | ||||
| Fusiform gyrus | 33 | −48 | −21 | 4.55 | −27 | −3 | −33 | 4.19 |
| 39 | −12 | −30 | 4.35 | |||||
| Inferior frontal gyrus | 54 | 9 | 21 | 5.39 | ||||
| Inferior parietal gyrus (BA4O) | 45 | −54 | 39 | 4.75 | −39 | −45 | 48 | 4.55 |
| 42 | −45 | 42 | 6.12 | |||||
| Inferior temporal gyrus | −45 | −48 | −15 | 5.52 | ||||
| 48 | −45 | −18 | 4.46 | |||||
| Lingual gyrus | 18 | −45 | −12 | 5.93 | ||||
| Medial frontal gyms | 27 | 30 | 39 | 4.43 | 30 | 42 | 24 | 6.19 |
| 51 | 9 | 39 | 4.8 | |||||
| Medial temporal gyrus | −45 | −57 | −3 | 3.93 | ||||
| 66 | −27 | −3 | 4.34 | |||||
| Midcingulate gyrus | −9 | 0 | 39 | 4.98 | −6 | −24 | 36 | 5.02 |
| −6 | −24 | 42 | 4.75 | 6 | −12 | 30 | 5.21 | |
| 6 | 6 | 33 | 4.37 | |||||
| Midinsula | −57 | 3 | 0 | 3.92 | ||||
| 48 | 12 | 0 | 4.16 | |||||
| Parahippocampal gyrus | 24 | 6 | −27 | 4.25 | −21 | 0 | −30 | 3.85 |
| 24 | 3 | −30 | 3.72 | |||||
| Postcentral gyrus | −45 | −27 | 57 | 4.73 | −48 | −9 | 51 | 6.29 |
| −27 | −39 | 54 | 5.11 | −21 | −39 | 60 | 4.63 | |
| 33 | −36 | 54 | 3.82 | 21 | −42 | 60 | 4.28 | |
| 54 | −21 | 33 | 5.34 | |||||
| Posterior insula | −30 | −15 | 0 | 4.77 | −33 | −18 | 15 | 4.87 |
| 42 | −21 | 15 | 4.04 | 42 | −12 | −3 | 4.98 | |
| Precentral gyrus | −15 | −15 | 69 | 4.34 | −48 | −9 | 51 | 6.29 |
| 33 | −18 | 54 | 4.22 | 45 | 6 | 48 | 4.39 | |
| Precuneus | −12 | −48 | 63 | 4.39 | −12 | −69 | 39 | 4.64 |
| −9 | −75 | 45 | 3.97 | −6 | −48 | 63 | 4.06 | |
| 9 | −60 | 48 | 4.91 | 9 | −69 | 48 | 5.26 | |
| 9 | −51 | 66 | 3.97 | |||||
| Superior frontal gyrus | 24 | 33 | 36 | 4.46 | ||||
| 24 | −3 | 54 | 3.93 | |||||
| Superior parietal gyrus | 12 | −72 | 51 | 5.14 | −36 | −51 | 60 | 3.6 |
| 45 | −42 | 63 | 5.78 | |||||
| Superior/medial occipital gyrus | −21 | −81 | 33 | 3.5 | ||||
| 24 | −78 | 21 | 4.73 | |||||
| Supplemental motor area/ paracentral lobule |
0 | −21 | 66 | 3.93 | −6 | 0 | 48 | 3.53 |
We also examined how the results are altered with the inclusion of respiratory rate and volume parameters in the sliding-window regression. The primary effect was to decrease the t-scores and spatial extent of clusters, though most remained significant at the corrected threshold (Supplementary Fig. 1).
Frequency analysis of HRV
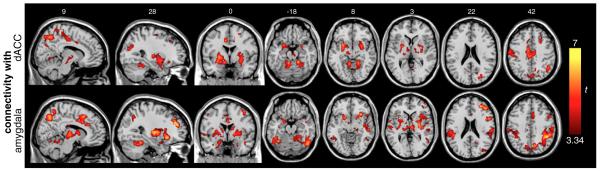
While RMSSD by nature selects primarily for high frequency components of HRV, we also specifically examined the differential effects of low- and high-frequency components of HRV using spectral analysis. The mean low-frequency (0.05–0.15 Hz; “LF-HRV”) and high-frequency (0.15–0.4 Hz; “HF-HRV”) power of HRV was computed in each sliding window, yielding a sequence of HF-HRV and LF-HRV values across a scan. Because correlations between the LF and HF signals were moderately high (16 of the 35 subjects had r>0.34, p<0.05 right-sided t-test), we decided to use separate regression analyses and superimpose the results for illustration. Regions where increased functional connectivity with the dACC and amygdala was correlated with increased power in the LF and HF bands of HRV are shown in Fig. 4 and listed in Supplementary Table 1. Here, a more stringent initial uncorrected threshold of p<0.0001 (t(35)>4.17) was used in order to better highlight differences between the LF and HF components. Whole-brain maps with the same (p<0.001) initial height threshold as the RMSSD analysis are provided in Supplementary Fig. 2.
Fig. 4.

Regions for which temporal fluctuation in functional connectivity with the dACC (top row) and amygdala (middle row) during resting state had significant positive correlation with fluctuations in Fourier-based LF (blue) and HF (red) measures of HRV. Bottom row: regions for which BOLD activity was correlated with the time series of LF- and HF-HRV. All maps are cluster thresholded at p<0.05 (corrected), with a height threshold of p<0.0001 uncorrected (t>4.17) for the connectivity maps and p<0.001 (t>3.34) for the activation maps. Peak coordinates are listed in Tables 3A and 3B.
To identify regions where the FC of both ROIs was associated selectively with the HF component of HRV, regions showing a conjoined effect of HF-HRV on FC for both dACC and amygdala seeds (p<0.05 corrected) were masked exclusively by regions showing a conjoined effect of LF-HRV on FC (uncorrected p<0.05 threshold). Applying a stringent inclusive threshold with a liberal exclusive threshold yields a conservative estimate of HF-specific effects.
Positive effects of HF-HRV on FC with both ROIs were found to be significant in the brainstem (Fig. 5), thalamus, and lateral hypothalamus (Table 3A).
Fig. 5.
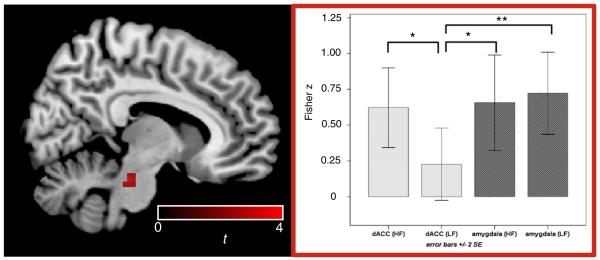
Significant effects of HF-HRV beyond LF-HRV were found in the indicated brainstem cluster (left); values across subjects (mean±2 SE) are illustrated on the right (*p<0.05, **p<0.01), indicating that the specificity of the effect to HF is due to insignificant LF covariation with connectivity between dACC and brainstem.
Table 3A.
Regions showing frequency-specific HRV associations with the functional connectivity from both dACC and amygdala seed regions. Effect of high-frequency HRV independent of low-frequency HRV.
| Region | x | y | z | t |
|---|---|---|---|---|
| Brainstem | 12 | −27 | −24 | 4.06 |
| Thalamus | 3 | −6 | −3 | 3.76 |
| Lateral hypothalamus | −3 | −3 | −9 | 3.33 |
Conversely, with an identical analysis, a selective main effect of LF-HRV on FC with both ROIs was found to be significant in regions including the right dorsolateral prefrontal cortex (dlPFC), bilateral insula, bilateral portions of the temporoparietal junction and in secondary visual areas (p<0.05 corrected; see Fig. 6/Table 3B) when applying an exclusive mask for HF effects. Differential effects of HF and LF HRV on connectivity with either ROI (dACC or amygdala) are listed in Supplementary Table 2.
Fig. 6.
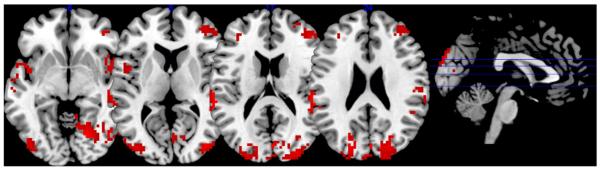
Positive conjoint effect of the LF-HRV component on FC with dACC and amygdala (p<0.05 corected), masked by the respective conjoint HF-HRV effect on both ROIs at p<0.05 uncorrected to obtain a conservative estimate of LF-specific effects. Peak coordinates are listed in Table 3B.
Resting-state BOLD signal relating to HRV
For comparison with the functional connectivity results, we also examined the correlation between resting-state BOLD signal changes and HRV. As described above, measurements of LF- and HF-HRV power were computed at each fMRI time frame (TR) using the wavelet transform. Separate linear models were used here as well. Results are shown in Fig. 4 (bottom row) and significant clusters are reported in Supplementary Table 1.
Association between HRV and FC independent of BOLD signal change
We first characterized regions in which both BOLD signal change and FC were related to HRV. A thresholded image (“FC mask”) was derived by thresholding the group-level statistical map of the relationship between HF-HRV and FC with a given seed ROI (e.g. dACC) at p<0.05 corrected. A second thresholded image (“BOLD mask”) was created by taking the additive effect of significant HF- and LF-HRV relationships with BOLD signal change (i.e., voxels whose time series correlated with LF or HF HRV or both). A threshold of p<0.001 uncorrected was used for this mask, and the intersection between the FC and BOLD masks was taken. A significant overlap was found in regions including the bilateral ventral pre- and postcentral gyrus, cingulate gyrus, posterior insula, cerebellum, thalamus, sublenticular extended amygdala and midbrain (p<0.05 corrected). Results for the HF-HRV with the dACC seed are shown in Fig. 7 (red color scale); the remaining combinations are shown in Supplementary Fig. 3.
Fig. 7.
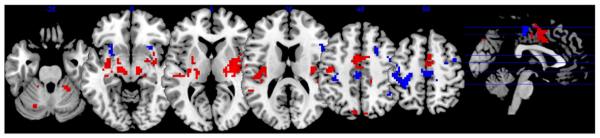
Relationship between HF-HRV and dACC functional connectivity, overlapping with (red) and distinct from (blue) effects of BOLD signal variation.
Regions where HRV had a significant relationship with FC – but not BOLD signal change – were assessed in a similar manner, but this time by applying the BOLD mask exclusively to the FC mask. Here, the exclusive mask threshold was set to p<0.05 uncorrected (with the FC map still at p<0.05 corrected) in order to generate a conservative estimate of regions showing an FC-HRV effect without having a BOLD signal time course that is correlated with HRV. Regions showing such an FC-specific effect included the dorsal pre- and postcentral gyrus, superior, inferior and dorsolateral prefrontal cortex (dlPFC), supplemental motor area, anterior insula, pallidum and putamen (p<0.05 corrected). Results for the HF-HRV with the dACC seed are shown in Fig. 7 (blue color scale); the remaining combinations are shown in Supplementary Fig. 3.
Inter-subject relationship between mean functional connectivity and mean heart rate variability
In addition to regions for which modulation of functional connectivity covaried with HRV within a scan, we examined whether – across subjects – there were any regions whose mean functional connectivity across the entire scan related to average measures of HF or LF HRV across the scan. At the group level, no voxels were significant at a corrected threshold. For exploratory purposes, lowering the threshold to p<0.05 uncorrected and restricting the search to regions that were significant in the within-subject analysis of Fig. 3 yielded regions shown in Fig. 8 (Supplementary Table 3).
Fig. 8.

Areas for which the inter-subject analysis of mean functional connectivity and mean HRV survived a threshold of p<0.05 uncorrected, masked with clusters significant at p<0.05 (corrected) in the analysis of the temporal relationship between functional connectivity and HRV.
Discussion
Here, we examined how fluctuations in functional connectivity relate to heart rate variability, a marker of physiological and psychological state. Specifically, two key structures implicated in salience and autonomic processing (dACC, amygdala) were found to exhibit changes in seed-based connectivity that tracked shifts in the amplitude of HRV across the course of a resting-state fMRI scan. Even within the short scan duration (approx. 10 min), transient increases in HRV were accompanied by transient increases in functional connectivity between the dACC and regions including the cingulate cortex, basal ganglia, thalamus, amygdala and midbrain, and between the amygdala and regions including the cingulate cortex, basal ganglia, anterior insula, and dorsolateral prefrontal cortex. Examining low and high frequency components of HRV separately, it was observed that fluctuations in high frequency HRV components correlated with the connectivity of both seed ROIs (amygdala and dACC) to the thalamus and the brainstem; fluctuations in low frequency HRV correlated with the connectivity of both ROIs to the parieto-occipital cortex. Regions showing an HRV-dependent functional connectivity from both seeds but no significant covariation with BOLD signal levels included dlPFC, anterior insula, and paracentral gyri.
Relationship between resting-state connectivity and HRV
Regions whose strength of functional connectivity with both the dACC and amygdala covaried with changes in HRV, measured by RMSSD, included the cingulate cortex and basal ganglia. The dACC additionally showed HRV-dependent connectivity with the thalamus, amygdala and midbrain, while the amygdala showed HRV-dependent connectivity with the anterior insula and dorsolateral prefrontal cortex. While RMSSD by nature selects primarily for high frequency components of HRV, differential effects of low- and high-frequency components of HRV were specifically examined using spectral analysis. High frequency HRV components were linked with the connectivity of both seed ROIs to regions including the thalamus and the brainstem. The brainstem showed a differential effect of HF- and LF-HRV on connectivity with the dACC seed (Fig. 5), with a significantly stronger relationship with HF HRV compared to LF HRV; the amygdala, on the other hand, showed both HF- and LF-related connectivity to the brainstem.
The HF component of HRV has been reported to be preferentially affected by parasympathetic influence, while the LF component is rather, if not entirely, affected by sympathetic tone. These effects have been explained with differential synaptic transmission cascades in the nature of parasympathetic or sympathetic nerve end terminals reaching the cardiac sinus node (reviewed by Berntson et al., 1997). In this study, differential effects of HF and LF HRV were found in the brainstem, a region containing parasympathetic relay stations such as the periaquaeductal gray and the nucleus of the solitary tract. The PAG shows anatomical connections to baroreflex centers in the medulla (Behbehani, 1995; van der Plas et al., 1995) and to regions related to afferent and efferent regulation of autonomic control, such as the insula and amygdala (Gray et al., 2009; Saha, 2005), and has been linked to cardiac responses towards physiological and psychological stress (Topolovec et al., 2004; Wager et al., 2009a; Wager et al., 2009b). The nucleus of the solitary tract is involved in the baroreceptor reflex regulating respiratory–heart rate interaction (Eckberg et al., 1988; Sved et al., 2001). Glossopharyngeal and vagal parasympathetic afferents from carotid and sinusoidal baroreceptors terminate in the nucleus of the solitary tract in the brainstem and, via this loop, mediate the cardiac baroreflex. Through direct connections to the ventromedial thalamus, this autonomic information reaches higher order cortical regions. Of note, a thalamic cluster, appearing to overlap with the ventromedial thalamus, was also shown to be specifically mediated by HF-HRV components in our analysis.
Low frequency HRV was found to relate to connectivity between the temporoparietal junction (TPJ) and both the dACC and amygdala seed regions. This region, providing connections to dACC and insula (Kucyi et al., 2012; Mars et al., 2012), is associated with changes in vigilance states and attentional shifts (Kincade et al., 2005; Olbrich et al., 2009). A change of connectivity between dACC and TPJ that co-occurs with changes in LF HRV could in principle be linked to an adaptive process in which psychological and physiological states are adjusted when reorienting attention and changing vigilance states, such as previously reported for activity in TPJ during functional experiments involving task fMRI.
HRV-related functional connectivity in relation to activation
In our analysis, regions having BOLD signal time series that correlated significantly with HRV dynamics were present, including the putamen, posterior insula and SMA. These are in line with findings by Critchley et al. (2003), who investigated task-induced HRV changes, although in our case a strictly passive condition (resting state) was used. In our study, regions in which HRV was associated with connectivity to both seed ROIs, but not with mere BOLD signal changes, included dlPFC, anterior insula and paracentral gyri. This finding of a clear separation between (1) the dynamics in BOLD signal variations of a region and (2) its connectivity to another region suggests some independence between the underlying sources for both types of correlation with HRV, as well as reveals a network characterized by high intrinsic functional connectivity in the physiological context of high HRV. One difference between our study and that of Critchley et al. (2003) was the absence of significant correlations between HRV and BOLD signal fluctuations in the anterior insula in our data. The reasons may relate to absence of a task in our study, as well as to methodological differences, such as in the computation of HRV.
Selection of seed regions
Activation in the dACC has been related to changes in HRV during task-fMRI (Critchley, 2005; Critchley et al., 2003) and task-induced changes in rCBF, measured by PET (Lane et al., 2009). This relationship is reported to be absent in patients with an impairment of the autonomic nervous system (Critchley et al., 2001) or of the dACC itself (Critchley et al., 2003). The dACC projects anatomically to subcortical brain regions associated with homeostasis and autonomic control, such as the periaqueductal gray, hypothalamus and pons (An et al., 1998; Ongur et al., 1998; Porrino and Goldman-Rakic, 1982; Vilensky and van Hoesen, 1981); it also projects to the insula (Mesulam and Mufson, 1982; Vogt and Pandya, 1987), and is thought to modulate the latter in the process of integrating sensory information into awareness (Medford and Critchley, 2010).
The amygdala is part of the salience network (Seeley et al., 2007) and has been shown to play a major role in the mediation of autonomic responses during emotionally relevant stimulation. Activity in the amygdala was shown to initiate the bradycardia responses to acute fear, even predicting stress-induced increases in ventricular filling (Dalton et al., 2005). Moreover, amygdala activity has been linked to the sympathetic skin response during fear (Asahina et al., 2003; Williams et al., 2001), and shows hyperactivity in depression (Drevets, 2001), a disease having a characteristic decrease in HRV. Studies that have directly examined correlations between heart rate and amygdala activity have reached varied conclusions, reporting positive (Gianaros et al., 2004), negative (Critchley et al., 2000; Wager et al., 2009b) or even no relationship to heart rate response (Wager et al., 2009a), possibly due to differences in task paradigms; nonetheless, the amygdala and the dACC have arisen in the literature as important subcortical and cortical regions, respectively, mediating arousal and HRV levels. Future studies may consider functional connectivity from other key regions implicated in autonomic function, such as the insula and brainstem. Our analysis framework could be extended to a more comprehensive whole-brain investigation using parcellations derived from methods such as independent component analysis or clustering (Craddock et al., 2012; Kiviniemi et al., 2009), and to examine seed regions from other major networks (e.g. the default-mode network). In fact, in a recent study published during the initial review of this manuscript (Fan et al., 2012), it was found with a psycho-physiological interactions analysis (Friston et al., 1997) that the skin conductance response (SCR) signal correlated with the activity and connectivity of the posterior cingulate cortex, with increases in SCR (autonomic arousal) related to both decreased signal in the default-mode network and increased signal in the task-positive network.
Inter-subject relationship between BOLD connectivity and HRV
Unlike the within-subject analysis, the between-subject analysis yielded significant clusters only at an uncorrected threshold. A region corresponding to the posterior (centromedial) thalamic nuclei, whose connectivity with the amygdala which was found to covary with HRV in the intra-individual (Figs. 3 and 4) analysis and weakly at the inter-individual (Fig. 8) analysis, follows a well-described anatomical route of a preferential anatomical connectivity (Eckert et al., 2012) and salience related activations (Metzger et al., 2010). This overlap, which would indeed speak in favor of a common framework to explain dynamics of connectivity as representations varying psychological states, needs however to be regarded with caution due to the weak significance and potential bias (specificity) by the length of the sliding window used for analysis. A potential reason for the weakness of the between-subject effect may further stem from individual differences such as age, caffeine intake, and health (Berntson et al., 1997), which may factor more strongly into the inter-subject analysis than into within-subject fractional changes.
Implications for dynamic analysis of resting state functional connectivity
The present analysis took steps toward understanding the relationship between fluctuations in functional connectivity using HRV as an indicator of state change. While HRV is by no means a complete picture of the “vigilance state” of an individual, and itself has only indirect connections to both psychological and autonomic processes, the finding that salience network modulation occurs in concert with HRV variations lends support to a representation of psychological states by transient resting-state connectivity. The fact that the significant regions in the analysis were confined to rather focal anatomic regions suggests that we are not observing a blood-flow-related widespread inflation of connectivity with systemic processes that may co-occur with changes in HRV, but more likely some kind of neural modulation. Importantly, the regions observed here included those which have been attributed to functions such as vigilance and focused attention, processes that would likely vary across a 10 minute resting state scan.
Methodological limitations and future directions
Dynamic measurements of HRV were obtained by means of a sliding fast Fourier transform and RMSSD across 45-s time windows. In choosing a window size, one must consider several tradeoffs, such as balancing the robustness of estimation (for which a longer window of observation is helpful) with the sensitivity to temporal changes (which is reduced with longer windows) and the desire to maximize the total number of sliding-window measurements within the fixed duration of the resting-state scan. In addition, one must consider the time scale over which to expect interpretable psychophysiological changes to evolve. Our selection of a 45-s window and 50% overlap yielded 25 sliding-window measurements per scan, 36 fMRI time points per window for estimating functional connectivity (correlation), and accommodates >6.75 cycles of HF HRV (>0.15 Hz). While 45 s may be adequate for studying HF HRV, it is rather short for LF HRV, since the number of LF cycles contained within 45 s ranges between 2.25 (for oscillations of 0.05 Hz) and 6.75 (for 0.15 Hz). Thus, conclusions about LF HRV from the data in this study ought to be formed with some caution. While optimization of the time window across all objectives is not straightforward, further work using longer resting-state scans will be more conducive to the study of low-frequency functional connectivity and HRV.
It is well known that the amplitude of HRV is influenced by respiration rate and depth. Thus, it is difficult to isolate an index of parasympathetic activity or cognitive/emotional strain using the HRV alone, though efforts have been made toward mathematically separating respiratory influences from HRV measurements (Choi and Gutierrez-Osuna, 2011). Linearly covarying for respiratory rate and approximate respiration volume in the present study was found to diminish, but not extinguish, the significant relationship between HRV and functional connectivity.
As a pre-processing step, we regressed out respiratory volume- and heart-rate-related components of the fMRI data via RVHRCOR regressors (Chang and Glover, 2009). While it may seem contradictory or circular to regress out signals pertaining to the variable of interest (HRV), the rationale stems from the fact that physiological fluctuations can cause both neural and non-neural modulation of the BOLD signal. Specifically, fluctuations in respiration rate/volume (“RV”) and heart rate (“HR”) have been shown to produce spatially-widespread (gray matter) BOLD signal fluctuations believed to result primarily from systemic changes in arterial CO2 and blood flow (e.g. Birn et al., 2006, Shmueli et al., 2007, Chang and Glover, 2009). Ideally, we wish to eliminate this non-neural component so that the residual BOLD signal more closely reflects fluctuations in local neuronal metabolism. By convolving RV and HR with a priori causal transfer functions (RRF, CRF) that have been derived to model the global non-neural influences of RV and HR on BOLD (Chang and Glover, 2009), we employ a conservative approach to removing RV/HR (in contrast with, for instance, regressing out RV and HR signals at multiple time lags). To further investigate the impact of RVHRCOR, we performed a supplementary re-analysis without including the RVHRCOR pre-processing step. This analysis expanded the spatial extent of clusters for which functional connectivity was associated with HRV, compared to when RVHRCOR was performed (data not shown), suggesting that our original results represent a conservative estimate of regions with HRV-related FC, and furthermore implying that the regression step does not generate false positives. Another potential concern is the proximity of the seed regions (dACC, amygdala) to major blood vessels, perhaps rendering them more susceptible to pulsation artifacts. While cardiac pulsation artifacts were reduced using RETROICOR, residuals may nevertheless remain, which should be noted as a potential caveat.
Another potential caveat involves the accuracy of the pulse oximeter (PO) placed on the finger, which is used in the present study for calculating HRV. These measurements can be influenced by changes in peripheral vasomotor tone, e.g. due to control mechanisms for autonomic or temperature regulation, that may modulate the timing of the measured pulse. However, a number of recent studies suggest that PO wave variability is a sufficient measure of HRV under resting conditions (reviewed in Schafer and Vagedes, in press). Also, since our primary analysis uses relatively large time-windows, for which the overall beat-to-beat variability across windows (relative to one another) is of interest, the accuracy is likely adequate. In addition, in unpublished studies in our lab, we compared the use of PO and ECG waveforms for ballistocardiogram denoising of simultaneous EEG-fMRI data, finding that the delay in cardiac trigger point derived from PO waveforms relative to ECG-derived triggers was highly consistent within subjects and across scans. We note in addition that strong cardiac peaks were apparent in all measurement traces, suggesting that the fingers were warm and the measurement was indeed sensitive and robust enough for the relatively short duration of the scans.
In our sliding-window analysis, the functional connectivity and HRV processes are collapsed into one measurement per sliding window. Therefore, the correlation between measurements from the two processes may contain a combination of causal influence of neural activity on HRV, and vice versa, that are occurring on a finer-grained temporal scale. In other words, whether changes in HRV are inducing changes in functional connectivity, or the other way around – or both – is not clear from the present analysis. Determining the direction of causality is challenging because connectivity measurements require a sufficiently long time interval for estimating a reliable correlation value, which – for the lower frequencies in the BOLD signal – can be many seconds. Further examination of this question, perhaps using electrical rather than hemodynamic measurements of brain activity, may be an avenue of future study.
In conclusion, we here provide evidence for neural (BOLD functional connectivity) correlates of distinct autonomous nervous states as characterized by HRV, suggesting a physiological contribution to the observed non-stationarity of resting state connectivity between particular regions that may ultimately translate to a psychological dimension of time-varying vigilance states.
Supplementary Material
Table 3B.
Regions showing frequency-specific HRV associations with the functional connectivity from both dACC and amygdala seed regions. Effect of low-frequency HRV independent of high-frequency HRV.
| Region | x | y | z | t |
|---|---|---|---|---|
| (dlPFC) Medial frontal gyrus | −33 | 42 | 21 | 3.73 |
| 45 | 39 | 18 | 4.05 | |
| Angular gyrus | 45 | −48 | 36 | 3.84 |
| Anterior and mid insula | 48 | 3 | 0 | 4.16 |
| Cuneus (BA18) | 3 | −84 | 24 | 4.66 |
| Frontal inferior operculum | −54 | 9 | 6 | 3.47 |
| Fusiform gyrus | 21 | −48 | −12 | 5.72 |
| Inferior parietal gyrus | 30 | −54 | 45 | 3.81 |
| Inferior temporal gyrus (BA20) | 60 | −15 | −24 | 3.84 |
| Lingual gyrus | 21 | −69 | −6 | 4.51 |
| Medial occipital gyrus | 39 | −84 | 12 | 4.45 |
| Mid insula | −42 | 6 | 6 | 3.98 |
| Posterior insula | 54 | 3 | −9 | 3.97 |
| Superior occipital gyrus | −21 | −81 | 24 | 4.37 |
| 24 | −66 | 42 | 4.17 | |
| Superior parietal gyrus | −24 | −51 | 69 | 3.69 |
| Superior temporal gyrus (BA21/42) | 54 | −39 | 15 | 3.86 |
| −60 | −33 | 18 | 4.75 | |
| Superior temporal pole | 51 | 12 | −12 | 4.28 |
| Supramarginal gyrus | −54 | −39 | 24 | 5.03 |
| 51 | −21 | 24 | 3.94 |
Acknowledgments
The authors gratefully acknowledge support from NIH grants F31-AG032168 (CC), P41-RR09784 (GHG), and the Intramural Research Program of the National Institute of Neurological Disorders and Stroke (CC, JHD), as well as SFB 779 (CDM, MW), BMBF-SuppHab (MW) and an OvGU research stipend (CDM).
Footnotes
Supplementary data to this article can be found online at http://dx.doi.org/10.1016/j.neuroimage.2012.11.038.
References
- An X, Bandler R, Ongur D, Price JL. Prefrontal cortical projections to longitudinal columns in the midbrain periaqueductal gray in macaque monkeys. J. Comp. Neurol. 1998;401:455–479. [PubMed] [Google Scholar]
- Asahina M, Suzuki A, Mori M, Kanesaka T, Hattori T. Emotional sweating response in a patient with bilateral amygdala damage. Int. J. Psychophysiol. 2003;47:87–93. doi: 10.1016/s0167-8760(02)00123-x. [DOI] [PubMed] [Google Scholar]
- Behbehani MM. Functional characteristics of the midbrain periaqueductal gray. Prog. Neurobiol. 1995;46:575–605. doi: 10.1016/0301-0082(95)00009-k. [DOI] [PubMed] [Google Scholar]
- Bernardi L, Salvucci F, Suardi R, Solda PL, Calciati A, Perlini S, Falcone C, Ricciardi L. Evidence for an intrinsic mechanism regulating heart rate variability in the transplanted and the intact heart during submaximal dynamic exercise? Cardiovasc. Res. 1990;24:969–981. doi: 10.1093/cvr/24.12.969. [DOI] [PubMed] [Google Scholar]
- Berntson GG, Bigger JT, Jr., Eckberg DL, Grossman P, Kaufmann PG, Malik M, Nagaraja HN, Porges SW, Saul JP, Stone PH, van der Molen MW. Heart rate variability: origins, methods, and interpretive caveats. Psychophysiology. 1997;34:623–648. doi: 10.1111/j.1469-8986.1997.tb02140.x. [DOI] [PubMed] [Google Scholar]
- Birn RM, Diamond JB, Smith MA, Bandettini PA. Separating respiratory-variation-related fluctuations from neuronal-activity-related fluctuations in fMRI. Neuroimage. 2006;31:1536–1548. doi: 10.1016/j.neuroimage.2006.02.048. [DOI] [PubMed] [Google Scholar]
- Biswal B, Yetkin FZ, Haughton VM, Hyde JS. Functional connectivity in the motor cortex of resting human brain using echo-planar MRI. Magn. Reson. Med. 1995;34:537–541. doi: 10.1002/mrm.1910340409. [DOI] [PubMed] [Google Scholar]
- Chang C, Glover GH. Effects of model-based physiological noise correction on default mode network anti-correlations and correlations. Neuroimage. 2009;47:1448–1459. doi: 10.1016/j.neuroimage.2009.05.012. [DOI] [PMC free article] [PubMed] [Google Scholar]
- Chang C, Glover GH. Time–frequency dynamics of resting-state brain connectivity measured with fMRI. Neuroimage. 2010;50:81–98. doi: 10.1016/j.neuroimage.2009.12.011. [DOI] [PMC free article] [PubMed] [Google Scholar]
- Choi J, Gutierrez-Osuna R. Removal of respiratory influences from heart rate variability in stress monitoring. IEEE Sensors J. 2011;11:2649–2656. [Google Scholar]
- Craddock RC, James GA, Holtzheimer PE, III, Hu XP, Mayberg HS. A whole brain fMRI atlas generated via spatially constrained spectral clustering. Hum. Brain Mapp. 2012;33:1914–1928. doi: 10.1002/hbm.21333. [DOI] [PMC free article] [PubMed] [Google Scholar]
- Critchley HD. Neural mechanisms of autonomic, affective, and cognitive integration. J. Comp. Neurol. 2005;493:154–166. doi: 10.1002/cne.20749. [DOI] [PubMed] [Google Scholar]
- Critchley HD, Corfield DR, Chandler MP, Mathias CJ, Dolan RJ. Cerebral correlates of autonomic cardiovascular arousal: a functional neuroimaging investigation in humans. J. Physiol. 2000;523(Pt 1):259–270. doi: 10.1111/j.1469-7793.2000.t01-1-00259.x. [DOI] [PMC free article] [PubMed] [Google Scholar]
- Critchley HD, Mathias CJ, Dolan RJ. Neuroanatomical basis for first- and second-order representations of bodily states. Nat. Neurosci. 2001;4:207–212. doi: 10.1038/84048. [DOI] [PubMed] [Google Scholar]
- Critchley HD, Mathias CJ, Josephs O, O’Doherty J, Zanini S, Dewar BK, Cipolotti L, Shallice T, Dolan RJ. Human cingulate cortex and autonomic control: converging neuroimaging and clinical evidence. Brain. 2003;126:2139–2152. doi: 10.1093/brain/awg216. [DOI] [PubMed] [Google Scholar]
- Dalton KM, Kalin NH, Grist TM, Davidson RJ. Neural–cardiac coupling in threat-evoked anxiety. J. Cogn. Neurosci. 2005;17:969–980. doi: 10.1162/0898929054021094. [DOI] [PubMed] [Google Scholar]
- de Pasquale F, Della Penna S, Snyder AZ, Lewis C, Mantini D, Marzetti L, Belardinelli P, Ciancetta L, Pizzella V, Romani GL, Corbetta M. Temporal dynamics of spontaneous MEG activity in brain networks. Proc. Natl. Acad. Sci. U. S. A. 2010;107:6040–6045. doi: 10.1073/pnas.0913863107. [DOI] [PMC free article] [PubMed] [Google Scholar]
- Drevets WC. Neuroimaging and neuropathological studies of depression: implications for the cognitive–emotional features of mood disorders. Curr. Opin. Neurobiol. 2001;11:240–249. doi: 10.1016/s0959-4388(00)00203-8. [DOI] [PubMed] [Google Scholar]
- Eckberg DL, Rea RF, Andersson OK, Hedner T, Pernow J, Lundberg JM, Wallin BG. Baroreflex modulation of sympathetic activity and sympathetic neurotransmitters in humans. Acta Physiol. Scand. 1988;133:221–231. doi: 10.1111/j.1748-1716.1988.tb08401.x. [DOI] [PubMed] [Google Scholar]
- Eckert U, Metzger CD, Buchmann JE, Kaufmann J, Osoba A, Li M, Safron A, Liao W, Steiner J, Bogerts B, Walter M. Preferential networks of the mediodorsal nucleus and centromedian-parafascicular complex of the thalamus - a DTI tractography study. Hum. Brain Mapp. 2012;33:2627–2637. doi: 10.1002/hbm.21389. [DOI] [PMC free article] [PubMed] [Google Scholar]
- Elghozi JL, Julien C. Sympathetic control of short-term heart rate variability and its pharmacological modulation. Fundam. Clin. Pharmacol. 2007;21:337–347. doi: 10.1111/j.1472-8206.2007.00502.x. [DOI] [PubMed] [Google Scholar]
- Elghozi JL, Girard A, Laude D. Effects of drugs on the autonomic control of short-term heart rate variability. Auton. Neurosci. 2001;90:116–121. doi: 10.1016/S1566-0702(01)00276-4. [DOI] [PubMed] [Google Scholar]
- Evans KC, Shea SA, Saykin AJ. Functional MRI localisation of central nervous system regions associated with volitional inspiration in humans. J. Physiol. 1999;520(Pt. 2):383–392. doi: 10.1111/j.1469-7793.1999.00383.x. [DOI] [PMC free article] [PubMed] [Google Scholar]
- Evans KC, Dougherty DD, Schmid AM, Scannell E, McCallister A, Benson H, Dusek JA, Lazar SW. Modulation of spontaneous breathing via limbic/paralimbic-bulbar circuitry: an event-related fMRI study. Neuroimage. 2009;47:961–971. doi: 10.1016/j.neuroimage.2009.05.025. [DOI] [PMC free article] [PubMed] [Google Scholar]
- Fan J, Xu P, Van Dam NT, Eilam-Stock T, Gu X, Luo YJ, Hof PR. Spontaneous brain activity relates to autonomic arousal. J. Neurosci. 2012;32:11176–11186. doi: 10.1523/JNEUROSCI.1172-12.2012. [DOI] [PMC free article] [PubMed] [Google Scholar]
- Task Force Heart rate variability: standards of measurement, physiological interpretation and clinical use. Task Force of the European Society of Cardiology and the North American Society of Pacing and Electrophysiology. Circulation. 1996;93:1043–1065. [PubMed] [Google Scholar]
- Fox MD, Raichle ME. Spontaneous fluctuations in brain activity observed with functional magnetic resonance imaging. Nat. Rev. Neurosci. 2007;8:700–711. doi: 10.1038/nrn2201. [DOI] [PubMed] [Google Scholar]
- Friston KJ, Buechel C, Fink GR, Morris J, Rolls E, Dolan RJ. Psychophysiological and modulatory interactions in neuroimaging. Neuroimage. 1997;6:218–229. doi: 10.1006/nimg.1997.0291. [DOI] [PubMed] [Google Scholar]
- Gianaros PJ, Van Der Veen FM, Jennings JR. Regional cerebral blood flow correlates with heart period and high-frequency heart period variability during working-memory tasks: implications for the cortical and subcortical regulation of cardiac autonomic activity. Psychophysiology. 2004;41:521–530. doi: 10.1111/1469-8986.2004.00179.x. [DOI] [PMC free article] [PubMed] [Google Scholar]
- Gianaros PJ, Sheu LK, Matthews KA, Jennings JR, Manuck SB, Hariri AR. Individual differences in stressor-evoked blood pressure reactivity vary with activation, volume, and functional connectivity of the amygdala. J. Neurosci. 2008;28:990–999. doi: 10.1523/JNEUROSCI.3606-07.2008. [DOI] [PMC free article] [PubMed] [Google Scholar]
- Glover GH, Li TQ, Ress D. Image-based method for retrospective correction of physiological motion effects in fMRI: RETROICOR. Magn. Reson. Med. 2000;44:162–167. doi: 10.1002/1522-2594(200007)44:1<162::aid-mrm23>3.0.co;2-e. [DOI] [PubMed] [Google Scholar]
- Gray MA, Rylander K, Harrison NA, Wallin BG, Critchley HD. Following one’s heart: cardiac rhythms gate central initiation of sympathetic reflexes. J. Neurosci. 2009;29:1817–1825. doi: 10.1523/JNEUROSCI.3363-08.2009. [DOI] [PMC free article] [PubMed] [Google Scholar]
- Grigg O, Grady CL. Task-related effects on the temporal and spatial dynamics of resting-state functional connectivity in the default network. PLoS One. 2010;5:e13311. doi: 10.1371/journal.pone.0013311. [DOI] [PMC free article] [PubMed] [Google Scholar]
- Hayano J, Sakakibara Y, Yamada A, Yamada M, Mukai S, Fujinami T, Yokoyama K, Watanabe Y, Takata K. Accuracy of assessment of cardiac vagal tone by heart rate variability in normal subjects. Am. J. Cardiol. 1991;67:199–204. doi: 10.1016/0002-9149(91)90445-q. [DOI] [PubMed] [Google Scholar]
- Horovitz SG, Braun AR, Carr WS, Picchioni D, Balkin TJ, Fukunaga M, Duyn JH. Decoupling of the brain’s default mode network during deep sleep. Proc. Natl. Acad. Sci. U. S. A. 2009;106:11376–11381. doi: 10.1073/pnas.0901435106. [DOI] [PMC free article] [PubMed] [Google Scholar]
- Huikuri HV, Perkiomaki JS, Maestri R, Pinna GD. Clinical impact of evaluation of cardiovascular control by novel methods of heart rate dynamics. Philos. Trans. Series A. 2009;367:1223–1238. doi: 10.1098/rsta.2008.0294. [DOI] [PubMed] [Google Scholar]
- Jenkinson M, Bannister P, Brady M, Smith S. Improved optimization for the robust and accurate linear registration and motion correction of brain images. Neuroimage. 2002;17:825–841. doi: 10.1016/s1053-8119(02)91132-8. [DOI] [PubMed] [Google Scholar]
- Jonsson P, Sonnby-Borgstrom M. The effects of pictures of emotional faces on tonic and phasic autonomic cardiac control in women and men. Biol. Psychol. 2003;62:157–173. doi: 10.1016/s0301-0511(02)00114-x. [DOI] [PubMed] [Google Scholar]
- Kemp AH, Quintana DS, Gray MA, Felmingham KL, Brown K, Gatt JM. Impact of depression and antidepressant treatment on heart rate variability: a review and meta-analysis. Biol. Psychiatry. 2010;67:1067–1074. doi: 10.1016/j.biopsych.2009.12.012. [DOI] [PubMed] [Google Scholar]
- Kincade JM, Abrams RA, Astafiev SV, Shulman GL, Corbetta M. An event-related functional magnetic resonance imaging study of voluntary and stimulus-driven orienting of attention. J. Neurosci. 2005;25:4593–4604. doi: 10.1523/JNEUROSCI.0236-05.2005. [DOI] [PMC free article] [PubMed] [Google Scholar]
- Kiviniemi V, Starck T, Remes J, Long X, Nikkinen J, Haapea M, Veijola J, Moilanen I, Isohanni M, Zang YF, Tervonen O. Functional segmentation of the brain cortex using high model order group PICA. Hum. Brain Mapp. 2009;30:3865–3886. doi: 10.1002/hbm.20813. [DOI] [PMC free article] [PubMed] [Google Scholar]
- Kiviniemi V, Vire T, Remes J, Elseoud AA, Starck T, Tervonen O, Nikkinen J. A sliding time-window ICA reveals spatial variability of the default mode network in time. Brain connectivity. 2011;1:339–347. doi: 10.1089/brain.2011.0036. [DOI] [PubMed] [Google Scholar]
- Kucyi A, Moayedi M, Weissman-Fogel I, Hodaie M, Davis KD. Hemispheric asymmetry in white matter connectivity of the temporoparietal junction with the insula and prefrontal cortex. PLoS One. 2012;7:e35589. doi: 10.1371/journal.pone.0035589. [DOI] [PMC free article] [PubMed] [Google Scholar]
- Lane RD, McRae K, Reiman EM, Chen K, Ahern GL, Thayer JF. Neural correlates of heart rate variability during emotion. Neuroimage. 2009;44:213–222. doi: 10.1016/j.neuroimage.2008.07.056. [DOI] [PubMed] [Google Scholar]
- Licht CM, de Geus EJ, Zitman FG, Hoogendijk WJ, van Dyck R, Penninx BW. Association between major depressive disorder and heart rate variability in the Netherlands Study of Depression and Anxiety (NESDA) Arch. Gen. Psychiatry. 2008;65:1358–1367. doi: 10.1001/archpsyc.65.12.1358. [DOI] [PubMed] [Google Scholar]
- Mars RB, Sallet J, Schuffelgen U, Jbabdi S, Toni I, Rushworth MF. Connectivity-based subdivisions of the human right “temporoparietal junction area”: evidence for different areas participating in different cortical networks. Cereb. Cortex. 2012;22:1894–1903. doi: 10.1093/cercor/bhr268. [DOI] [PubMed] [Google Scholar]
- Medford N, Critchley HD. Conjoint activity of anterior insular and anterior cingulate cortex: awareness and response. Brain Struct. Funct. 2010;214:535–549. doi: 10.1007/s00429-010-0265-x. [DOI] [PMC free article] [PubMed] [Google Scholar]
- Mesulam MM, Mufson EJ. Insula of the old world monkey. III: Efferent cortical output and comments on function. J. Comp. Neurol. 1982;212:38–52. doi: 10.1002/cne.902120104. [DOI] [PubMed] [Google Scholar]
- Metzger CD, Eckert U, Steiner J, Sartorius A, Buchmann JE, Stadler J, Tempelmann C, Speck O, Bogerts B, Abler B, Walter M. High field FMRI reveals thalamocortical integration of segregated cognitive and emotional processing in mediodorsal and intralaminar thalamic nuclei. Front. Neuroanat. 2010;4:138. doi: 10.3389/fnana.2010.00138. [DOI] [PMC free article] [PubMed] [Google Scholar]
- Montano N, Porta A, Cogliati C, Costantino G, Tobaldini E, Casali KR, Iellamo F. Heart rate variability explored in the frequency domain: a tool to investigate the link between heart and behavior. Neurosci. Biobehav. Rev. 2009;33:71–80. doi: 10.1016/j.neubiorev.2008.07.006. [DOI] [PubMed] [Google Scholar]
- Napadow V, Dhond R, Conti G, Makris N, Brown EN, Barbieri R. Brain correlates of autonomic modulation: combining heart rate variability with fMRI. Neuroimage. 2008;42:169–177. doi: 10.1016/j.neuroimage.2008.04.238. [DOI] [PMC free article] [PubMed] [Google Scholar]
- Olbrich S, Mulert C, Karch S, Trenner M, Leicht G, Pogarell O, Hegerl U. EEG-vigilance and BOLD effect during simultaneous EEG/fMRI measurement. Neuroimage. 2009;45:319–332. doi: 10.1016/j.neuroimage.2008.11.014. [DOI] [PubMed] [Google Scholar]
- Ongur D, An X, Price JL. Prefrontal cortical projections to the hypothalamus in macaque monkeys. J. Comp. Neurol. 1998;401:480–505. [PubMed] [Google Scholar]
- Pannekoek JN, Veer IM, van Tol MJ, van derWerff SJ, Demenescu LR, Aleman A, Veltman DJ, Zitman FG, Rombouts SA, van der Wee NJ. Resting-state functional connectivity abnormalities in limbic and salience networks in social anxiety disorder without comorbidity. Eur. Neuropsychopharmacol. doi: 10.1016/j.euroneuro.2012.04.018. in press. http://dx.doi.org/10.1016/j.euroneuro.2012.04.018 (Electronic publication ahead of print) [DOI] [PubMed] [Google Scholar]
- Penttila J, Kuusela T, Scheinin H. Analysis of rapid heart rate variability in the assessment of anticholinergic drug effects in humans. Eur. J. Clin. Pharmacol. 2005;61:559–565. doi: 10.1007/s00228-005-0953-2. [DOI] [PubMed] [Google Scholar]
- Poline JB, Worsley KJ, Evans AC, Friston KJ. Combining spatial extent and peak intensity to test for activations in functional imaging. Neuroimage. 1997;5:83–96. doi: 10.1006/nimg.1996.0248. [DOI] [PubMed] [Google Scholar]
- Porrino LJ, Goldman-Rakic PS. Brainstem innervation of prefrontal and anterior cingulate cortex in the rhesus monkey revealed by retrograde transport of HRP. J. Comp. Neurol. 1982;205:63–76. doi: 10.1002/cne.902050107. [DOI] [PubMed] [Google Scholar]
- Raz G, Winetraub Y, Jacob Y, Kinreich S, Maron-Katz A, Shaham G, Podlipsky I, Gilam G, Soreq E, Hendler T. Portraying emotions at their unfolding: a multilayered approach for probing dynamics of neural networks. Neuroimage. 2012;60:1448–1461. doi: 10.1016/j.neuroimage.2011.12.084. [DOI] [PubMed] [Google Scholar]
- Saha S. Role of the central nucleus of the amygdala in the control of blood pressure: descending pathways to medullary cardiovascular nuclei. Clin. Exp. Pharmacol. Physiol. 2005;32:450–456. doi: 10.1111/j.1440-1681.2005.04210.x. [DOI] [PubMed] [Google Scholar]
- Sakoglu U, Pearlson GD, Kiehl KA, Wang YM, Michael AM, Calhoun VD. A method for evaluating dynamic functional network connectivity and task-modulation: application to schizophrenia. MAGMA. 2010;23:351–366. doi: 10.1007/s10334-010-0197-8. [DOI] [PMC free article] [PubMed] [Google Scholar]
- Schafer A, Vagedes J. How accurate is pulse rate variability as an estimate of heart rate variability?: a review on studies comparing photoplethysmographic technology with an electrocardiogram. Int. J. Cardiol. doi: 10.1016/j.ijcard.2012.03.119. in press. http://dx.doi.org/10.1016/j.ijcard.2012.03.119 (Electronic publication ahead of print) [DOI] [PubMed] [Google Scholar]
- Seeley WW, Menon V, Schatzberg AF, Keller J, Glover GH, Kenna H, Reiss AL, Greicius MD. Dissociable intrinsic connectivity networks for salience processing and executive control. J. Neurosci. 2007;27:2349–2356. doi: 10.1523/JNEUROSCI.5587-06.2007. [DOI] [PMC free article] [PubMed] [Google Scholar]
- Sheehan DV, Lecrubier Y, Sheehan KH, Amorim P, Janavs J, Weiller E, Hergueta T, Baker R, Dunbar GC. The Mini-International Neuropsychiatric Interview (M.I.N.I.): the development and validation of a structured diagnostic psychiatric interview for DSM-IV and ICD-10. J. Clin. Psychiatry. 1998;59(Suppl. 20):22–33. (quiz 34–57) [PubMed] [Google Scholar]
- Shmueli K, van Gelderen P, de Zwart JA, Horovitz SG, Fukunaga M, Jansma JM, Duyn JH. Low-frequency fluctuations in the cardiac rate as a source of variance in the resting-state fMRI BOLD signal. Neuroimage. 2007;38:306–320. doi: 10.1016/j.neuroimage.2007.07.037. [DOI] [PMC free article] [PubMed] [Google Scholar]
- Sved AF, Ito S, Madden CJ, Stocker SD, Yajima Y. Excitatory inputs to the RVLM in the context of the baroreceptor reflex. Ann. N. Y. Acad. Sci. 2001;940:247–258. doi: 10.1111/j.1749-6632.2001.tb03681.x. [DOI] [PubMed] [Google Scholar]
- Thayer JF, Ahs F, Fredrikson M, Sollers JJ, III, Wager TD. A meta-analysis of heart rate variability and neuroimaging studies: implications for heart rate variability as a marker of stress and health. Neurosci. Biobehav. Rev. 2012;36:747–756. doi: 10.1016/j.neubiorev.2011.11.009. [DOI] [PubMed] [Google Scholar]
- Topolovec JC, Gati JS, Menon RS, Shoemaker JK, Cechetto DF. Human cardiovascular and gustatory brainstem sites observed by functional magnetic resonance imaging. J. Comp. Neurol. 2004;471:446–461. doi: 10.1002/cne.20033. [DOI] [PubMed] [Google Scholar]
- van der Plas J, Wiersinga-Post JE, Maes FW, Bohus B. Cardiovascular effects and changes in midbrain periaqueductal gray neuronal activity induced by electrical stimulation of the hypothalamus in the rat. Brain Res. Bull. 1995;37:645–656. doi: 10.1016/0361-9230(95)00061-i. [DOI] [PubMed] [Google Scholar]
- Vilensky JA, van Hoesen GW. Corticopontine projections from the cingulate cortex in the rhesus monkey. Brain Res. 1981;205:391–395. doi: 10.1016/0006-8993(81)90348-6. [DOI] [PubMed] [Google Scholar]
- Vogt BA, Pandya DN. Cingulate cortex of the rhesus monkey: II. Cortical afferents. J. Comp. Neurol. 1987;262:271–289. doi: 10.1002/cne.902620208. [DOI] [PubMed] [Google Scholar]
- Wager TD, van Ast VA, Hughes BL, Davidson ML, Lindquist MA, Ochsner KN. Brain mediators of cardiovascular responses to social threat, part II: prefrontal–subcortical pathways and relationship with anxiety. Neuroimage. 2009a;47:836–851. doi: 10.1016/j.neuroimage.2009.05.044. [DOI] [PMC free article] [PubMed] [Google Scholar]
- Wager TD, Waugh CE, Lindquist M, Noll DC, Fredrickson BL, Taylor SF. Brain mediators of cardiovascular responses to social threat: part I: reciprocal dorsal and ventral sub-regions of the medial prefrontal cortex and heart-rate reactivity. Neuroimage. 2009b;47:821–835. doi: 10.1016/j.neuroimage.2009.05.043. [DOI] [PMC free article] [PubMed] [Google Scholar]
- Waites AB, Stanislavsky A, Abbott DF, Jackson GD. Effect of prior cognitive state on resting state networks measured with functional connectivity. Hum. Brain Mapp. 2005;24:59–68. doi: 10.1002/hbm.20069. [DOI] [PMC free article] [PubMed] [Google Scholar]
- Wallentin M, Nielsen AH, Vuust P, Dohn A, Roepstorff A, Lund TE. Amygdala and heart rate variability responses from listening to emotionally intense parts of a story. Neuroimage. 2011;58:963–973. doi: 10.1016/j.neuroimage.2011.06.077. [DOI] [PubMed] [Google Scholar]
- Williams LM, Phillips ML, Brammer MJ, Skerrett D, Lagopoulos J, Rennie C, Bahramali H, Olivieri G, David AS, Peduto A, Gordon E. Arousal dissociates amygdala and hippocampal fear responses: evidence from simultaneous fMRI and skin conductance recording. Neuroimage. 2001;14:1070–1079. doi: 10.1006/nimg.2001.0904. [DOI] [PubMed] [Google Scholar]
- Wise RG, Ide K, Poulin MJ, Tracey I. Resting fluctuations in arterial carbon dioxide induce significant low frequency variations in BOLD signal. Neuroimage. 2004;21:1652–1664. doi: 10.1016/j.neuroimage.2003.11.025. [DOI] [PubMed] [Google Scholar]
Associated Data
This section collects any data citations, data availability statements, or supplementary materials included in this article.